Power analysis and sample size determination Dr Douwe
 13 March")

")


")


- Slides: 25
Power analysis and sample size determination Dr Douwe Postmus (d. postmus@umcg. nl) 13 March 2018
Example • The antitumor activity of a new cancer treatment is studied in a sample of 20 patients • Each patient has a probability of p of responding to the treatment • Let X denote the total number of responders (successes) in the sample • X is binomially distributed with number of trials n = 20 and success probability p
Binomial distribution (n=20)
Does the drug have sufficient activity? • The treatment is considered to have insufficient activity if the response rate is 30% or lower • A response rate of 50% or higher is considered to be a clinically relevant response rate Statistical hypotheses: • Null hypothesis (H 0): p = 0. 3 • Alternative hypothesis (H 1): p = 0. 5
Type I and type II errors Decision Reality H 0 true H 1 true H 0 true OK Type I error, probability: α H 1 true Type II error, probability: β OK power probability: 1 -
Type I error rate • The probability of making a type I error is controlled by the researcher (usually α=0. 05) • Here, we decide to reject H 0 when the total number of responders X is equal to or larger than 10 Type I error rate: P(X ≥ 10 | p=0. 3) = 0. 048
Type II error rate • Suppose that H 1 is true • We make a type II error if we accept H 0, which occurs when X < 10 • Type II error rate: P(X<10 | p=0. 5) = 0. 41 • Power: P(X ≥ 10 | p=0. 5) = 0. 59
What happens if n increases? Type I error rate: P(X ≥ 10 | p=0. 3) = 0. 048 Type I error rate: P(X ≥ 18 | p=0. 3) = 0. 032
What happens if n increases? Type II error rate: P(X <10 | p=0. 5) = 0. 41 Type II error rate: P(X <18 | p=0. 5) = 0. 21
Power as a function of n
Sample size determination
Determinants of power • Sample size: the larger the sample size, the greater the power • Type I error rate (α): The larger the type I error rate, the more powerful the test • The effect size: the larger the difference between p 0 and p 1, the greater the power
Calculation of power 1. Use the distribution of the test statistic under the null hypothesis to define a rejection region with the desired type I error rate 2. Use the distribution of the test statistic under the alternative hypothesis to determine the probability that the value of the test statistic falls in the rejection region. This is the power of the test
Example: cholesterol lowering treatment •
Independent samples t-test •
Independent samples t-test •
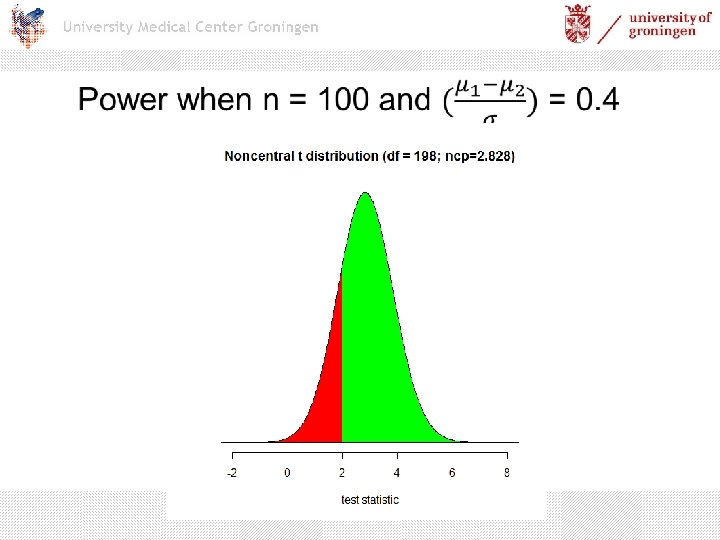
Rejection region when n=100 and α = 0. 05
Distribution of t under H 1 •
Power analysis using G*Power
Power as a function of n
Sample size determination
Sample size determination 1. 2. 3. 4. 5. Select an appropriate test statistic Determine the minimal clinically relevant effect size Specify the desired type I error rate Specify the desired type II error rate (power) The mimimal required sample size is the smallest value of n for which the constraints on the type I and II error rates are satisfied
Next lectures When? Where? What? Who April 10, 2018 Room 16 Conditional Survival Y. Chen May 8, 2018 Room 16 Resampling, the bootstrap method H. Burgerhof June 12, 2018 Room 16 Missing data S. la Bastide
Questions?