Poverty Inequity and the Distribution of Natural Resource

Poverty, Inequity, and the Distribution of Natural Resource Revenues in Africa Peter Veit Institutions and Governance Program World Resources Institute February 2005

Poverty Rates

Why Worry About Inequity? § Inequity retards econ growth and can cause poverty and underdevelopment; equity promotes faster econ growth § Constitutions guarantee basic right to life and broad-based national development § Inequity (probably more than poverty) breeds resentment and can lead to violence and ultimately separatist movements

Civil Wars Linked to Resource Wealth: Africa, 1990 -2002 STATE YEAR NATURAL RESOURCE Angola 1975 -2002 Oil, diamonds Angola (Cabinda) 1975 Oil Congo, Rep. of 1997 Oil Congo, Dem. Rep. of 1996 - Copper, gold, cobalt, diamonds, coltan Liberia 1989 -96 rubber, gold, diamonds, rubber Timber, iron, Morocco Oil, phosphates 1975 - Sierra Leone 1991 -2000 Diamonds Sudan 1983 -2005? Oil

Inequity by Region Gini Index Range Number of Countries 60 -100 6 50 -59. 9 7 5 5 6 40 -49. 9 8 1 2 9 1 5 30 -39. 9 14 19 7 7 1 1 0 -29. 9 3 15 North America CA & Caribbean Asia Europe 1 2 1 Mid East/N Africa Regon of the World Source: 2004 Human Development Report, UNDP Sub. Saharan Africa South America Oceana

Inequity by Population Group Gini Coefficient, South Africa Ethnic Group 1991 1996 2001 African 62 66 72 White 46 50 60 Coloured 52 56 64 Asian 49 52 60 Total 68 69 77

Trends in Inequity

Addressing Poverty with High Inequity: The Case for Distribution § Econ policy reforms are conducive to reductions in poverty, econ growth is a necessary, but insufficient condition § Location (infrastructure, education) and access (finances, land) matter. In their absence, the poor cannot benefit from new economic opportunities, increasing inequity § Distribution, especially of assets, to the poor, coupled with intensified growth in the sectors in which they engage can speed up their participation in the growth process

Addressing Poverty with High Inequity cont’d § Distribution is more effective than econ growth in reducing poverty in high inequality countries and in the least developed countries. Small changes in distribution can have a large effect on poverty reduction. § Multiple targeting methods for poverty reduction. Using more methods produces provides better targeting;

Goal and Objectives Goal. Increase efficiency of econ growth and maximize the reduction in poverty by use of distribution strategy of natural resource assets, especially in countries with high inequity. Objectives § Increase the assets of the poor and their opportunities for high returns to these assets so that they can participate in the econ opportunities § Poverty is a primary criteria in establishing distributions; poor people are targeted in the distribution of public resources § In resource-dependent economies, poor people capture a disproportionately large share of natural resource revenues

Why Focus on Natural Resource Assets? § Large, underutilized environmental endowments § National and household economies driven by natural resources; rural poor most dependent on nature § Natural resources not evenly distributed in space and not equally accessible to all § Easier to distribute natural resource assets than other forms of capital § If not managed well, can lead to poverty, inequity, environmental degradation,

Resource Dependency, 1995 Mineral Dependency Oil Dependency Rank State 1. Botswana % GDP Rank State % GDP 35. 1 68. 5 2. Sierra Leone 40. 9 1. Angola 28. 9 6. Congo, Rep. of 3. Zambia 26. 1 7. Nigeria 39. 9 5. Mauritania 18. 4 9. Gabon 36. 1 8. Liberia 12. 5 12. Algeria 23. 5 9. Niger 19. 8 11. Guinea 12. 2 14. Libya 11. 8 12. Congo, Dem. Rep. of Guinea, 7. 0 Chad, Equatorial 15. Togo 5. 1 Congo Dem Rep of, 16. Central African Rep. 4. 8 18. Ghana 4. 6 20. Angola 3. 6 Uganda, Tanzania?

Households’ Total Income Shares by Quintile and by Major Income Source Rural Households and their dependence on Environmental Resources (A Case Study of Zimbabwe) §Environmental Income makes a substantial contribution to total incomes, comprising 36. 87 percent • The share of aggregate environmental income decreases as income rises, therefore, the poor are more resource-dependent than the rich Source: Cavendish 1999

Source: 2004 Human Development Report, UNDP

Two Components of Distributional Equity Vertical Distribution. The distribution of revenue among institutions along the market chain from the source to the market Problem: Policies and practices ensure that benefits are concentrated and captured by the elite Goal: Raise the return of the poor’s natural resource assets and enable them to capture a larger share of profits as direct income Horizontal Distribution. The distribution of public revenues, including public goods/services, across regions and peoples Problem: Poverty not a main distribution criterion Goal: Target poor people and regions; rural poor

Vertical Dist - Charcoal Profits, Senegal 1994 2002/3 12% ? 22% ? Transporters - - Coxeur de Brousse - - Merchants/ Patrons 53% + Migrant Wood-cutters 10% = Forest Villages 3% ? Urban population Retailers Urban wholesalers Co-operatives

Mechanisms of Benefit Concentration VILLAGERS Forest access control Threats of violence Village access (wells & housing) MERCHANTS Control of labor opportunities Permits Credit Control of market access Control of access to markets Quotas, licenses Cooperative membership Social ties with government Leverage over prices Collusive price fixing Inter-locking credit-labor arrangements Misinformation WOODCUTTERS Access to merchants Social ties Social identity Technical skills WHOLESALERS Control of distribution Credit Arrangements/Capital Knowledge of demand Social ties with vendors & merchants RETAILERS Maintenance of access to wholesalers Manipulation of Weight Management plans RC right to say no RC labor allocation Access to RC

Horizontal Distribution Inter-Jurisdictional Equity. Distributional equity across districts and other subdivisions within a nation § A central government responsibility and a function of the willingness of the state to engage in distributive justice among regions § 3 common disbursement mechanisms § Central government public/social services § Central government transfers to local levels

Central Government Public Services and the Poor: Madagascar District Poverty Incidence p. c. health to districts Source: E Galasso, The World Bank, 2002 p. c. edu to districts
 § Local")
Central Gov’t Transfers to Local Level: Kenya 171 Local Authorities (County Councils) § Local Authority Transfer Fund. 0. 5 -5 M Ksh; development needs § LA Service Delivery Action Plan. 0. 5 -5 M Ksh; recurring costs 210 Constituencies § Constituency Development Fund. 0. 5% of national budget. 20 M Ksh to each constituency (85% of fund); remaining 15% by poverty § Constituency Bursary Fund. Small amounts, disbursement now based on student enrollment and

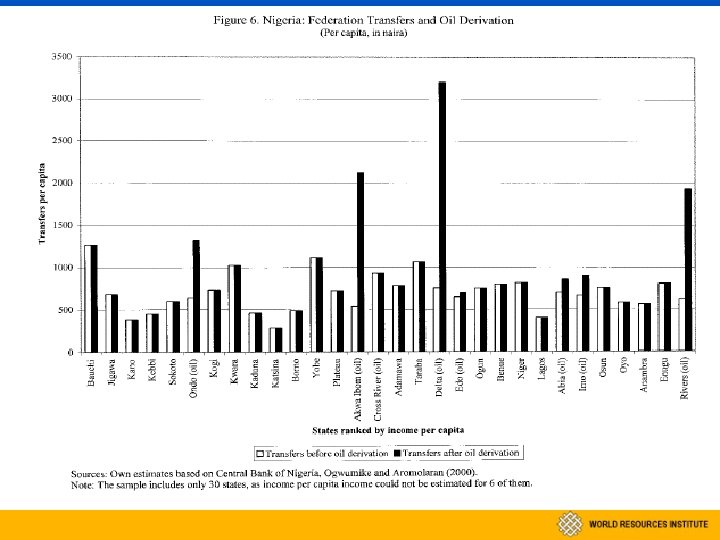
Oil Producing States

Oil Export Revenue, Returned Revenue, Poverty Rates: by Percent, 1958 -2004

Poverty and Protected Areas, Kenya Density of Rural Poor Populations Location of Protected Areas

Horizontal Distribution Intra-Jurisdictional Equity. Distributional equity across peoples and communities within levels of public administration below central government § Assumed to be function of decentralization – local authorities are thought to be more effective at identifying and reaching the poor than the central state § Evidence that responsiveness to the poor is a rare outcome of decentralization; pro-poor practices at the local level are mainly associated with strong central govt commitments

Intra-Jurisdictional Equity: Maasai Mara Game Reserve, Kenya
 generate unique incentives")
Key Issues § Different distribution criteria (derivation, poverty, population, recurring costs) generate unique incentives with specific outcomes (environmental mgmnt, poverty reduction). Mix of criteria to meet multiple objectives (principles of fairness)? § Which distribution mechanisms (CG public services, CG transfer, disbursements to citizens) is most effective in poverty reduction and sound environmental management? § Measures for promoting distribution equity in undemocratic countries (FPIC, Publish What You Pay) § Transboundary distributional equity. Are there principles of fairness across nations? Should they

In this new century, millions of people in the world’s poorest countries remain imprisoned, enslaved and in chains. They are trapped in the prison of poverty. It is time to set them free. -Nelson Mandela, 3 February 2005, preceding G 7 finance ministers meeting

Thank you!
- Slides: 29