
Poverty inequality and welfare in Chile Evidence challenges

- Slides: 19
Poverty, inequality and welfare in Chile: Evidence, challenges and lessons Dante Contreras UNDP and Department of Economics, University of Chile
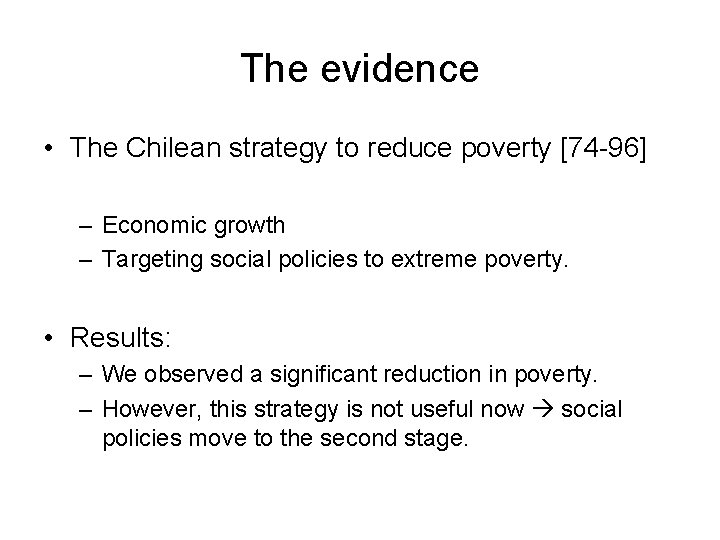
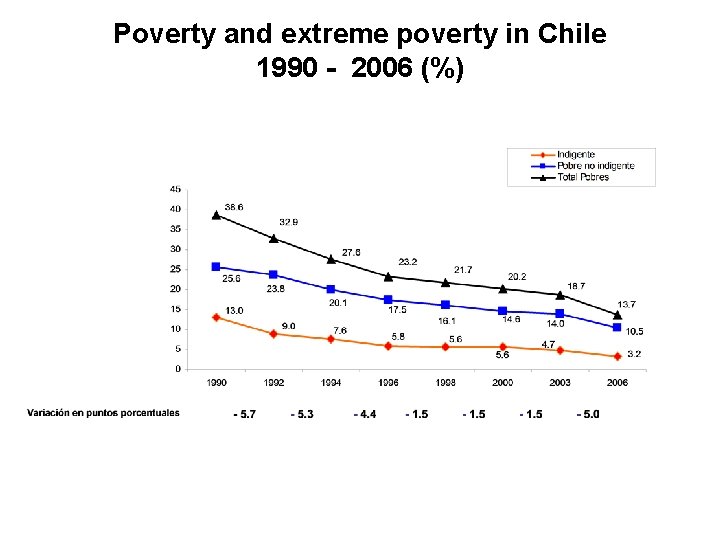
The evidence • The Chilean strategy to reduce poverty [74 -96] – Economic growth – Targeting social policies to extreme poverty. • Results: – We observed a significant reduction in poverty. – However, this strategy is not useful now social policies move to the second stage.
Poverty and extreme poverty in Chile 1990 - 2006 (%)
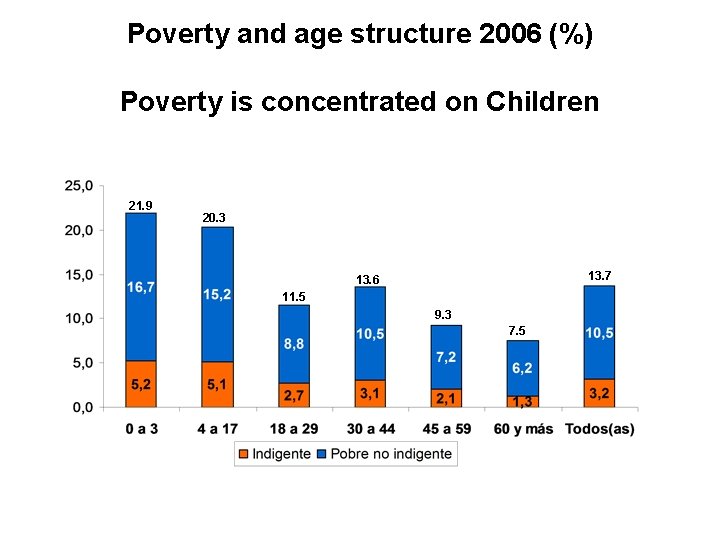
Poverty and age structure 2006 (%) Poverty is concentrated on Children 21. 9 20. 3 13. 7 13. 6 11. 5 9. 3 7. 5
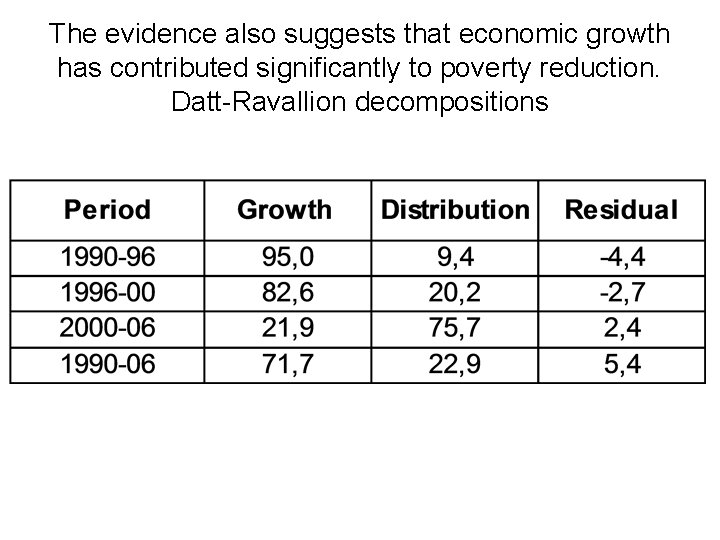
The evidence also suggests that economic growth has contributed significantly to poverty reduction. Datt-Ravallion decompositions
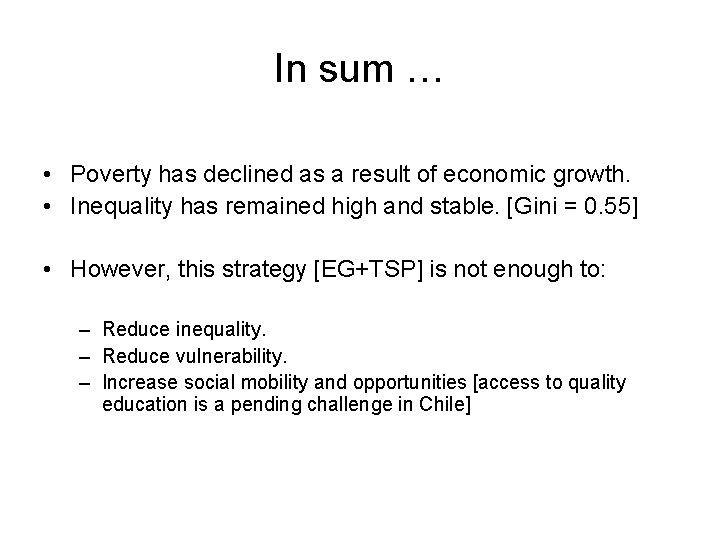
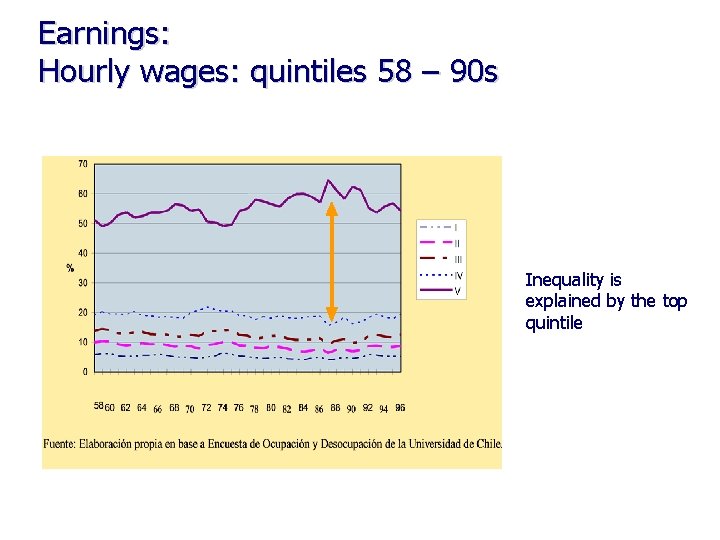
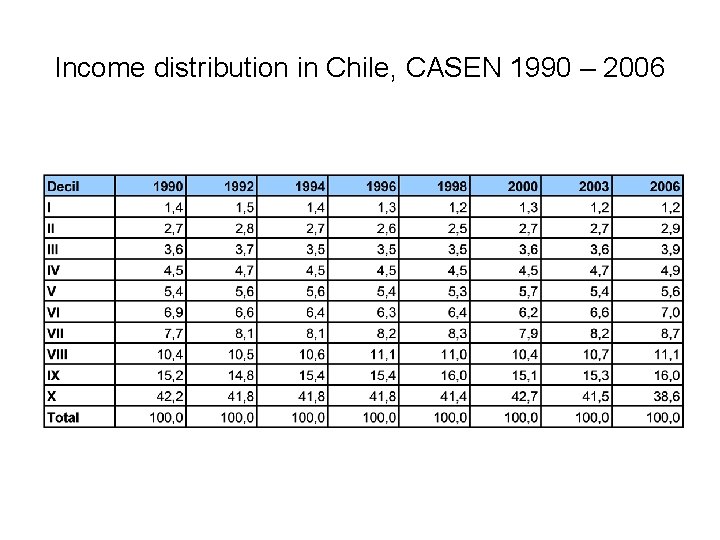
In sum … • Poverty has declined as a result of economic growth. • Inequality has remained high and stable. [Gini = 0. 55] • However, this strategy [EG+TSP] is not enough to: – Reduce inequality. – Reduce vulnerability. – Increase social mobility and opportunities [access to quality education is a pending challenge in Chile]
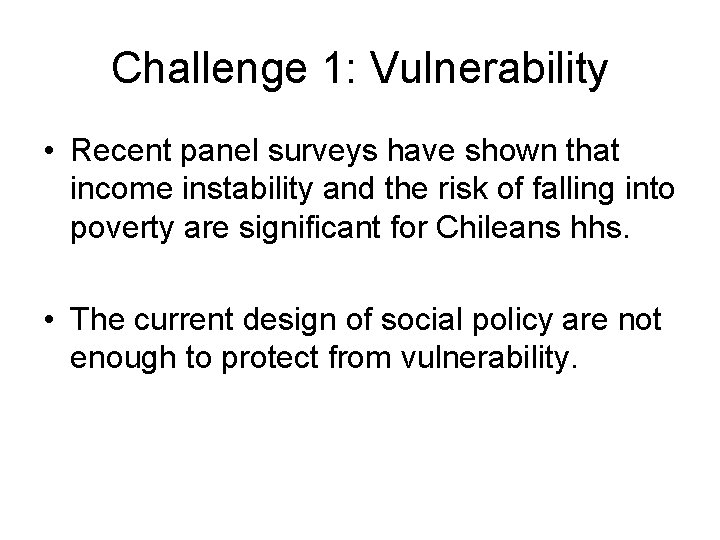
Challenge 1: Vulnerability • Recent panel surveys have shown that income instability and the risk of falling into poverty are significant for Chileans hhs. • The current design of social policy are not enough to protect from vulnerability.
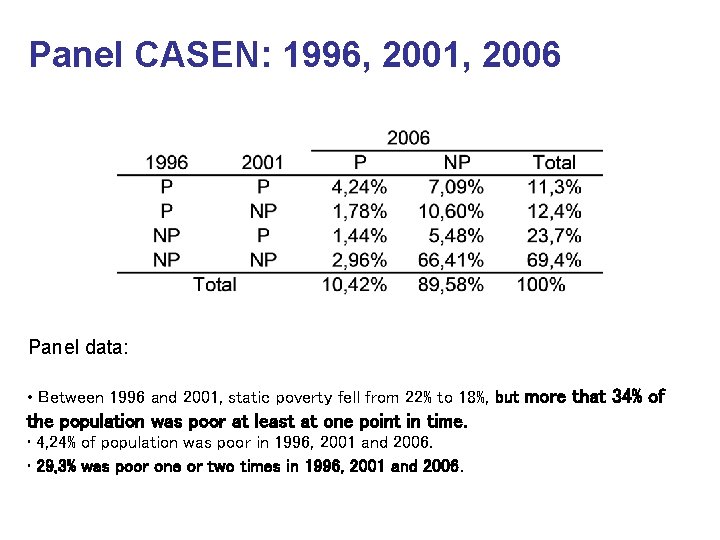
Panel CASEN: 1996, 2001, 2006 Panel data: • Between 1996 and 2001, static poverty fell from 22% to 18%, but more that 34% of the population was poor at least at one point in time. • 4, 24% of population was poor in 1996, 2001 and 2006. • 29, 3% was poor one or two times in 1996, 2001 and 2006.
Chile’s response to these problems • New strategy: social protection system – Chile Solidario extreme poverty. – Chile Crece Contigo children.
Chile Solidario • Chile Solidario is a conditional cash transfer oriented to the poor. Similar strategies are currently implemented in Mexico (Opportunities) and Brazil (Bolsa Familia). Those programs have for objectives to integrally support the poor. • Chile Solidario is a program covering about 300, 000 households. It targets the extremely poor through a national system that registers beneficiaries on the basis of intense monitoring of families conducted by social workers. • Significant effort in design • Less effort in evaluation: UNDP + WB [next week]
The Infant Protection System Chile Crece Contigo • Is a social protection program oriented to children and their families – – From gestation [fifth month of pregnancy] Until children entry to the school system. August 2007 Target to 40% poorest segment of the population • Chile Crece Contigo provides children with access to universal services – Health, nutrition. – Psycho-emotional support. – Integral development over the life cycle. • Significant effort in design • Less effort in evaluation: UNDP + WB [? ]
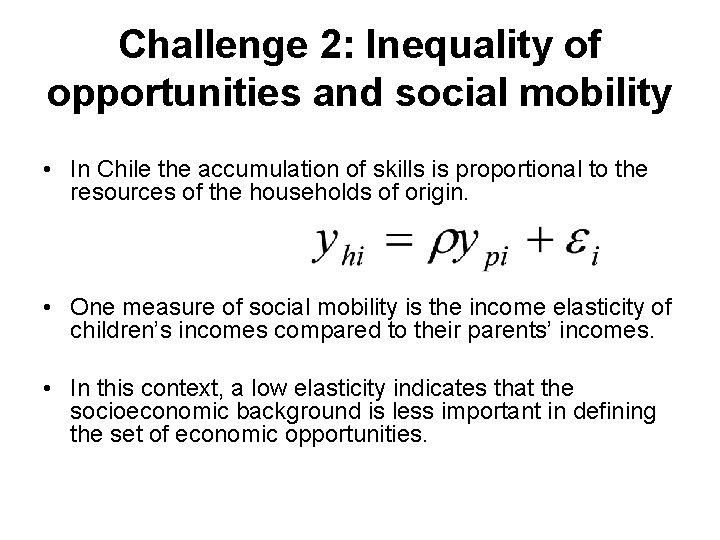
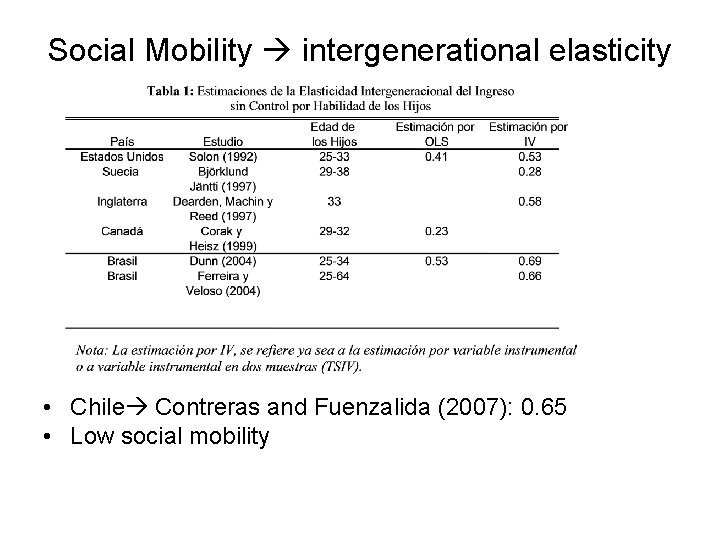
Challenge 2: Inequality of opportunities and social mobility • In Chile the accumulation of skills is proportional to the resources of the households of origin. • One measure of social mobility is the income elasticity of children’s incomes compared to their parents’ incomes. • In this context, a low elasticity indicates that the socioeconomic background is less important in defining the set of economic opportunities.
Social Mobility intergenerational elasticity • Chile Contreras and Fuenzalida (2007): 0. 65 • Low social mobility
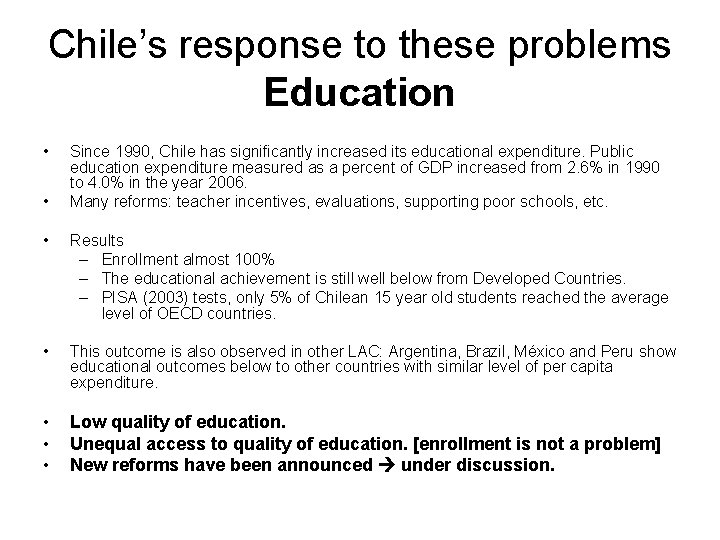
Chile’s response to these problems Education • • Since 1990, Chile has significantly increased its educational expenditure. Public education expenditure measured as a percent of GDP increased from 2. 6% in 1990 to 4. 0% in the year 2006. Many reforms: teacher incentives, evaluations, supporting poor schools, etc. • Results – Enrollment almost 100% – The educational achievement is still well below from Developed Countries. – PISA (2003) tests, only 5% of Chilean 15 year old students reached the average level of OECD countries. • This outcome is also observed in other LAC: Argentina, Brazil, México and Peru show educational outcomes below to other countries with similar level of per capita expenditure. • • • Low quality of education. Unequal access to quality of education. [enrollment is not a problem] New reforms have been announced under discussion.
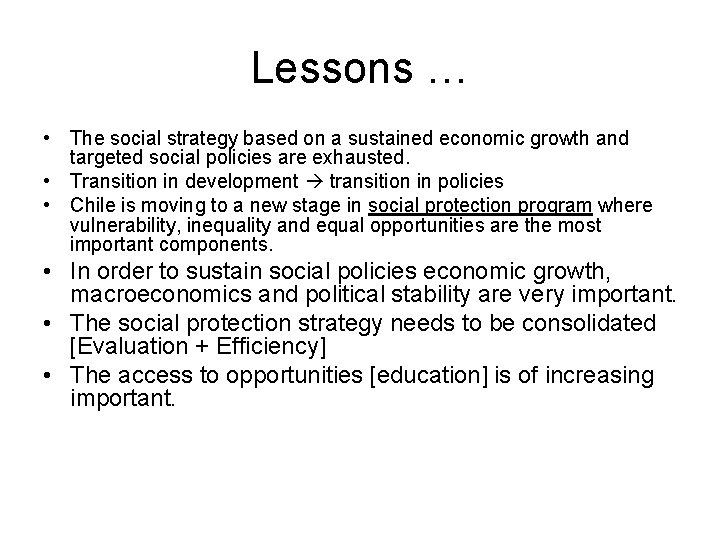
Lessons … • The social strategy based on a sustained economic growth and targeted social policies are exhausted. • Transition in development transition in policies • Chile is moving to a new stage in social protection program where vulnerability, inequality and equal opportunities are the most important components. • In order to sustain social policies economic growth, macroeconomics and political stability are very important. • The social protection strategy needs to be consolidated [Evaluation + Efficiency] • The access to opportunities [education] is of increasing important.
Inequality
Earnings: Hourly wages: quintiles 58 – 90 s Inequality is explained by the top quintile
Income distribution in Chile, CASEN 1990 – 2006