Poverty and Social Exclusion in the United Kingdom


 Dr Aya Abe (National Institute of Population and Social Security")


")


 index where: Pα is the level of poverty n")


 Model If we let R(t) and L(t) represent the number of rabbits")


 Can t afford")
")
- Slides: 48
Poverty and Social Exclusion in the United Kingdom Professor David Gordon Director Townsend Centre for International Poverty Research University of Bristol Department of Social Work Asia University, Wufong Township, Taichung County 413 Taiwan, R. O. C. 15 th April 2010
Web Site: http: //www. bris. ac. uk/poverty/
Source: Luxembourg Income Study – Wave VI
Source: Luxembourg Income Study – Wave VI
Source: Luxembourg Income Study
The Beginning of the Crisis? The Collapse of Lehman Brothers September 2008
The Beginning of the Crisis? The Run on Northern Rock, September 2007 Until 2007, there had not been a run on a UK bank since 1866
The Effects of the Global Economic Crisis
The Scale of the Financial Rescue in the USA & UK The bank’s profits were private but the losses belong to the public! http: //news. bbc. co. uk/2/hi/business/7893317. stm
Poverty and Social Exclusion in the United Kingdom: The 2011 Survey The largest ever research project on Poverty and Social Exclusion in the United Kingdom started on 1 st April 2010. The ESRC (Economic and Social Research Council) has funded this 42 month, £ 4. 3 million pound investigation designed to advance the ‘state of the art’ of poverty and social exclusion measurement. The research team is one of the most experienced in poverty measurement methodology ever assembled in the UK. It is a major collaboration between researchers at Heriot-Watt University, the National Centre for Social Research, Northern Ireland Statistics and Research Agency, Open University, Queen's University Belfast, University of Bristol, University of Glasgow and the University of York.
International Advisory Board 1) Dr Aya Abe (National Institute of Population and Social Security Research, Japan) 2) Professor Julio Boltvinik (El Colegio de México, Mexico) 3) Dr Petra Böhnke (WZB, Germany) 4) Professor Bjorn Hallerod (University of Gothenburg, Sweden) 5) Dr Daniel He-chiun Liou (Asia University, Taiwan) 6) Professor Brian Nolan (University College Dublin, Ireland) 7) Bryan Perry (Research Manager, Ministry of Social Development, New Zealand) 8) Professor Veli-Matti Ritakallio (University of Turku, Finland) 9) Pedro Sáinz - Secretary of the UN Expert Group on Poverty Statistics (Rio Group, Brazil) 10) Professor Peter Saunders (University of New South Wales, Australia) 11) Dr Gemma Wright (University of Oxford) – work in South Africa
Background Every decade since the late 1960 s, UK social scientists have attempted to carry out an independent poverty survey to test out new ideas and incorporate current state of the art methods into UK poverty research. • 1968 -69 Poverty in the UK survey (Peter Townsend and colleagues), • 1983 Poor Britain survey (Joanna Mack, Stewart Lansley) • 1990 Breadline Britain survey (Joanna Mack, Stewart Lansley) • 1999 Poverty and Social Exclusion Survey (Jonathan Bradshaw and colleagues) and its 2002 counterpart in Northern Ireland (Paddy Hillyard and colleagues) • 2011 Poverty and Social Exclusion in the UK (David Gordon and colleagues)
Objectives 1. To improve the measurement of poverty, deprivation, social exclusion and standard of living. 2. To measure the change in the nature and extent of poverty and social exclusion over the past ten years. 3. To produce policy-relevant results about the causes and outcomes of poverty and social exclusion.
Objectives 1. To improve the measurement of poverty, deprivation, social exclusion and standard of living. • To develop new combined income/deprivation poverty measures for adult groups • To facilitate the re-basing of the data on necessities that is incorporated into the measurement of child poverty in the UK (i. e. the combined low income and material deprivation child poverty measure) • To construct a standard of living index for the UK • To test the reliability and validity of the material deprivation module currently being incorporated into European Union Survey of Income and Living Conditions (EU-SILC) and the Laeken indicators
Objectives 2 To measure the change in the nature and extent of poverty and social exclusion over the past ten years. • To collect and analyse new cross-sectional data on poverty and social exclusion thereby extending the existing series of Poverty and Social Exclusion surveys • To collect and analyse qualitative evidence on how living standards and social exclusion shape the lifestyles of families, households and individuals • To provide an independent check on progress in reducing child poverty in 2011 • In Northern Ireland, to assess progress on the extent to which poverty and social exclusion vary across the nine dimensions of equality specified in Section 75 of the Northern Ireland Act 1998, to investigate further the legacies of the Troubles and to ascertain the role of family, institutionally and culturally, in coping with poverty and social exclusion
Objectives 3 To produce policy-relevant results about the causes and outcomes of poverty and social exclusion. • To explore causal relationships between different dimensions of poverty and social exclusion • To use the new data in conjunction with the FRS and the Work and Pensions Longitudinal Study (WPLS) to undertake longitudinal analysis of patterns of poverty, exclusion, employment and benefit receipt • To provide analyses of poverty and social exclusion relevant to the devolved governments within the UK • To analyse comparatively the use of poverty and social exclusion indicators in national and regional anti-poverty strategies, including, comprehensively measuring the living standards of those people identified as poor in current official measures
Survey Data Omnibus Survey: Necessities of Life – A systematic random achieved sample of adults (16+) of about 1, 860 interviews in Britain and 1, 400 in Northern Ireland. Interviewers can interview only at the selected addresses and must seek to persuade those randomly chosen using a Kish grid methodology, to take part in the study. Interviews will take place in respondents’ own homes using Computer-Assisted Interviewing (CAI). Main Survey: Poverty & Social Exclusion – A follow-up survey to the 2010/11 Family Resources Survey (circa 47, 000 households). The main survey in Britain will aim for an achieved sample of 4, 000 households and 6, 000 individuals – with approximately 1, 000 households in the ‘ethnic’ strata and 1, 000 households in Scotland. In Northern Ireland, the achieved sample will be 800 households and 1, 250 individuals. The survey will be divided into a household questionnaire which will be answered by the Household Reference Person (HRP) and an individual questionnaire which will be answered by all adult household members (aged 16 and over).
Questionnaire Development & Testing 1. Literature review – systematic review with specified search criteria (English language published literature / questionnaires) 2. Expert review – by the full research team & advisory groups (expert opinion plus English and non-English published and grey literature / questionnaires) 3. Focus Groups - twelve focus group discussions (pensioners, lone parents, couples with children, couples without children, single people in rural and urban areas, plus two mixed groups) 4. Cognitive Interviews – 15 interviews, a relatively simple technique that asks a small number of respondents to ‘think aloud’ while answering the questions. This may reveal any ‘problems’ with the questionnaire 5. Questionnaire Pilot - a kind of dress rehearsal with a limited number of respondents (20 – 50 people)
Qualitative Data Northern Ireland Family Solidarity Survey, a qualitative survey of around 100 respondents will be conducted to explore the role of family in coping with poverty. In Northern Ireland – the nature of the social divisions were such that the degree of reliance on family was greater in Northern Ireland than elsewhere. Northern Ireland therefore presents a unique opportunity to explore the continuing role of family in the transmission of poverty and in coping with it. The study will have a material focus – examining the extent to which resources are transferred among family members (both nuclear and extended) - and it will also explore family cultures and relationships as factors affecting poverty and social exclusion. This will help to reveal the extent and limits of family solidarity. British Impoverishment Survey, a qualitative survey of 72 respondents will be conducted to explore the ‘life stories’ of participants experiencing poverty, in order to understand poverty persistence and the significance of key ‘life events’ in shaping current circumstances and prospects. This work will contribute to an emerging literature in which poverty is understood as a social and symbolic relationship in which ‘the poor’ are constructed as ‘other’ and excluded from society.
Dissemination A major new website – www. poverty. ac. uk Full results of the 2011 Survey Comparisons with the earlier surveys in 1983, 1990 and 1999 Development of new graphic visualisation tools enabling access to more complex datasets and richer comparisons between datasets across time Video clips of what it means to live in poverty for key groups in 2011 (e. g. young, elderly, unemployed, disabled) and comparisons from the two broadcast documentary series accompanying the 1983 and 1990 surveys (Breadline Britain and Breadline Britain in the 1990 s( to illustrate changing circumstances and attitudes Narrowcast on Open. Learn, i-tunes U and You-tube
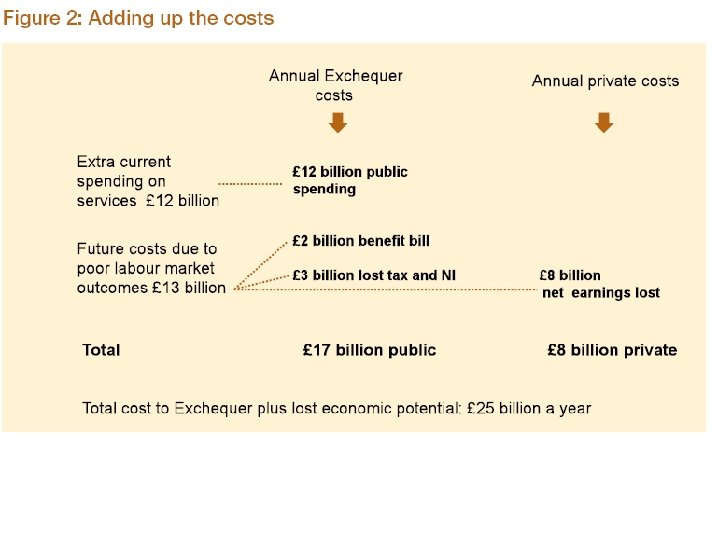
The Costs of Poverty in the UK
Summary of Outcomes of Child Poverty • • • • Outcome Are Outcomes Associated with Poverty? Mortality Morbidity Accidents Mental Illness Suicide Child Abuse Teenage Pregnancy Environment/Housing Conditions Homelessness Low Education attainment School exclusions Crime Smoking Alcohol Drugs Child Labour Yes, strong association with social class Yes, strong association for most diseases Yes, for fatal accidents (but not accident morbidity) Yes Yes, except sexual abuse Yes Yes Don’t Know No Mainly after childhood No No No Source: Bradshaw (2001)
Economic Cost of Child Poverty in the UK Child poverty costs the UK at least £ 25 billion a year, (equivalent to 2% of GDP) including £ 17 billion that could accrue to the Exchequer if child poverty were eradicated. Public spending to deal with the fallout of child poverty is about £ 12 billion a year, about 60 per cent of which goes on personal social services, school education and police and criminal justice. - The annual cost of below-average employment rates and earnings levels among adults who grew up in poverty is about £ 13 billion, of which £ 5 billion represents extra benefit payments and lower tax revenues; the remaining £ 8 billion is lost earnings to individuals, affecting gross domestic product (GDP).
Child Poverty in the UK The UK Government is committed to tackling the problem of child poverty. In March 1999, the Prime Minister Tony Blair set out a commitment to end child poverty forever: “And I will set our historic aim that ours is the first generation to end child poverty forever, and it will take a generation. It is a 20 -year mission but I believe it can be done. The Child Poverty Act has placed this policy commitment into UK law.
Child Poverty Act 2010 Places in legislation the commitment to eradicate child poverty by 2020, this means that UK Secretary of State will have a duty to meet the following child poverty targets: • Relative poverty: Less than 10% of children living in relative low income poverty by 2020. • Material Deprivation: Less than 5% of children living in combined material deprivation and low income. • Absolute low income: Reduce the proportion of children who live in absolute low income to less than 5%. • Persistent Poverty: percentage of children living in relative poverty for three out of four years (target level to be set by the end of 2014 as data are currently unavailable) Requires the UK Secretary of State to publish a UK child poverty strategy, which must be revised every three years.
Definition and Measurement
Scientific Definitions of Poverty can be defined as; Command over insufficient resources over time The result of poverty is deprivation
Peter Townsend’s concept of relative deprivation Argues that poverty can only be measured: “objectively and applied consistently only in terms of the concept of relative deprivation. …. The term is understood objectively rather than subjectively. Individuals, families and groups in the population can be said to be in poverty when they lack the resources to obtain the types of diet, participate in the activities and have the living conditions and amenities which are customary, or at least widely encouraged or approved, in the society to which they belong” (1979, p 31)
Peter Townsend’s concept of dynamic poverty “poverty is a dynamic, not a static concept…Our general theory, then, should be that individuals and families whose resources over time fall seriously short of the resources commanded by the average individual or family in the community in which they live. . . are in poverty. ” Townsend (1962, p 219)
Indirect Vs Direct Definitions of ‘Poverty Process Lack of Resources Townsend (1954, Poverty 1962) Interpretation Ringen (1988) Interpretation Exclusion for Minimum Way of Life Outcome of Poverty Cause of Poverty
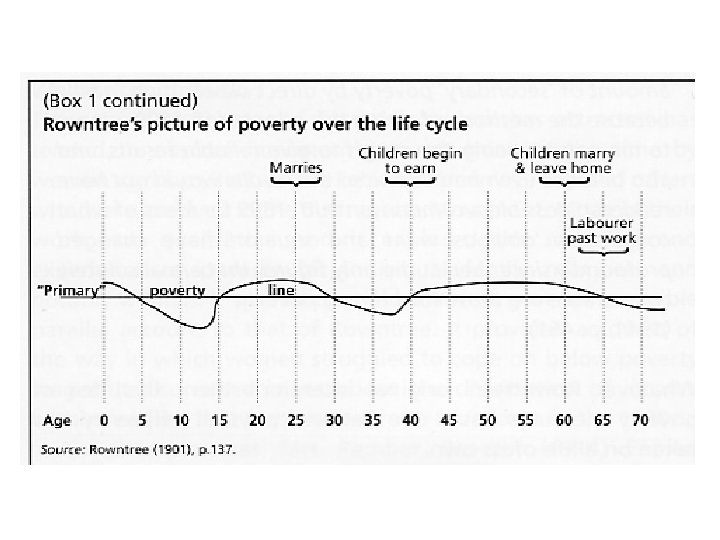
Seebohm Rowntree and Poverty in York - 1899
Uni-dimensional Poverty Measurement Low Income in Britain 1961 -2003
Foster, Greer and Thorbecke (FGT) index where: Pα is the level of poverty n is the population size Q is the number of poor z is the poverty line yi is the per capita household income and α has a normative value that can be set at different levels according to the importance one attaches to the lowest living standards.
Modal Deprivation by Logarithm of Income as a Percentage of Supplementary Benefit Scale Rates (Townsend, 1979)
Definition of poverty
Dynamics of poverty
Lotka-Volterra (Predator-Prey) Model If we let R(t) and L(t) represent the number of rabbits and Canadian Lynx, respectively, that are alive at time t, then the Lotka-Volterra model is: d. R/dt = a*R - b*R*L d. L/dt = e*b*R*L - c*L where the parameters are defined by: a is the natural growth rate of Rabbits in the absence of predation, c is the natural death rate of Lynx in the absence of food (Rabbits), b is the death rate per encounter of Rabbits due to predation, e is the efficiency of turning predated Rabbits into Lynx. This is a simple first order non-linear differential model – when extended to multiple species it exhibits chaotic dynamic behaviour Key ref: May, R. (1974) Stability and Complexity in Model Ecosystems, Princeton U. Press, NJ.
Poverty Groups
Constructing a Deprivation Index
Validity of ECHP Deprivation Items. % Viewing item as necessity ONS Omnibus Odds ratio % Cannot afford Reporting chronic illness Difficult to make ends meet ECHP Wave 3 (UK sample) Unable to keep home adequately warm 94 2. 6 1. 60 2. 47 Have damp walls/floors 93 5. 6 1. 75 1. 50 Meat, chicken or fish every second day 79 1. 7 1. 43 2. 52 Possess telephone 72 1. 2 [1. 24] 2. 37 Money left to save 66 43. 8 1. 33 5. 10 Having friends/family for a meal monthly 65 5. 8 1. 50 2. 72 Possess colour TV 58 0. 1 1. 51 2. 48 A week's annual holiday away from home 55 17. 5 1. 40 3. 63 Replacing worn out furniture 54 22. 0 1. 36 3. 62
Reliability of PSE-Derived ECHP Deprivation Scale. Item-Total Correlation Alpha if Item Deleted Keep home adequately warm . 3826 . 7026 Have damp walls/floors . 1878 . 7352 Afford eat meat every 2 nd day . 3867 . 7015 Possess colour TV . 1661 . 7272 Possess telephone . 1686 . 7280 Afford have guests over for dinner once . 4795 . 6819 Afford 1 week annual holiday . 6650 . 6306 Afford replace worn-out furniture . 6427 . 6370 Money left to save . 5208 . 6736 Cronbach’s Alpha =. 7112
Additivity of a Deprivation Index
Example of a Combined Low Income and Deprivation Poverty Line in Mexico
Reasons why people do not participate in socially necessary activities (%) Can t afford to 47 Not interested 44 Lack of time due to childcare responsibilities 18 Too old, ill, sick or disabled 14 Lack of time due to paid work 14 No one to go out with (social) 6 No vehicle poor public transport 5 Lack of time due to other caring responsibilities 4 Fear of burglary or vandalism 3 Fear of personal attack 3 Can t go out due to other caring responsibilities 2 Problems with physical access 1 Feel unwelcome (e. g. due to disability ethnicity, gender, age, etc) 1 None of these 8 Source: PSE 1999, Multiple responses allowed
The Bristol Social Exclusion Matrix (B-SEM)