Potentially Avoidable Deaths What Could Neonatologists Do Better

Potentially Avoidable Deaths – What Could Neonatologists Do Better ? Malcolm Battin Chair NE Working Group

Neonatologist’s role

Neonatologist’s role Might include : • Clinical Practice Advocacy Research or clinical review Education • Aim to improve mortality • • •
 2009 Top 3 causes account for 77 % of")
Primary Neonatal Death Classification (PSANZ-NDC) 2009 Top 3 causes account for 77 % of neonatal deaths
 Extreme prematurity 31. 3% • • 1. 5 % births")
NND classification (Page 32) Extreme prematurity 31. 3% • • 1. 5 % births < 32 wks GA 0. 4% births 24 -27 wks GA • Lower range GA 20 wks (T. 17) • 114/165 (87%) deaths <24/40 (T. 21) 20/165 deaths (12. 1%) 24 -27/40 (T. 21) • Plus respiratory, neurological, gastro (NEC) •

Survival of NW inborn babies by BW

Survival of NW inborn babies by BW Liggins & Howie 1 st surfactant OSIRIS in NZ HFOV/CPAP/Trigger report
")
A progressive ceiling on potential developmental outcomes ? Wolke (Lagercrantz 2008)

When Does Neonatal Death Occur ? Data from Table 6

Prematurity • Concept of borderline in viability • Individualised approach < 24 weeks • Audit of neurodevelopmental outcomes • Publication of results for scrutiny ! • Spontaneous preterm birth & APH as antecedent causes associated with deprivation Prematurity associated neonatal death risk highest in teenage mothers •

Teenage mothers • Half of teenage mothers whose babies died were Maori • • risk increased across ethnicities Half of teenage mothers whose babies died in highest deprivation quintile. 45 % of teenage mothers whose babies died were smokers More contact health system after birth • NICU nurses support
")
Maternal age (Figure 18)
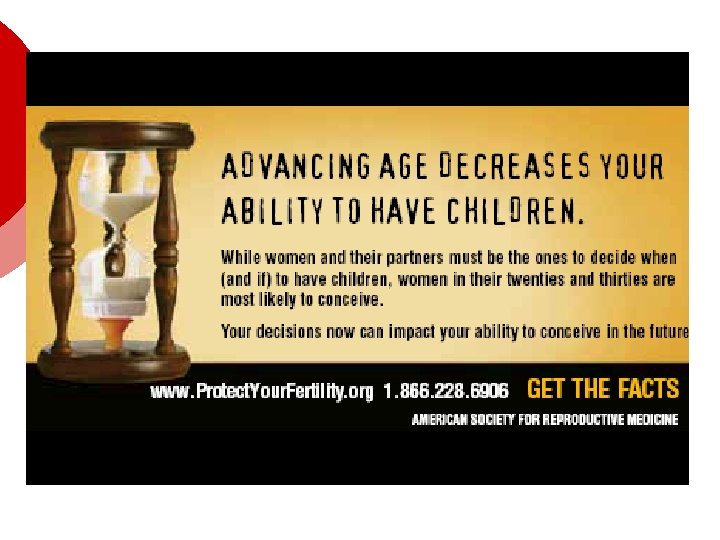

Canadian studies what people know about risk associated with maternal age • 1, 044 women, after first live-born, aware link with conception difficulties – 85. % • * Multiple birth 24%, c. section 18. 8%, preterm delivery 22% and LBW 11% • Further survey 20 -45 yrs without children • > 70% recognized link to conception • < 50 % knew that advanced maternal age increased the risk of stillbirth, c. section, *multiple birth and preterm delivery Tough 2002 and 2007

NND classification Page 32 • Congenital abnormality 23. 6% • • • Neurological 22% • • Potentially avoidable – complex issue Some benefit scale or special service NE Working Group Infection 6. 6% Cardio-respiratory 6% Gastrointestinal 4. 4%

Neonatal Encephalopathy or Hypoxic Ischemic Death 2010 data collection • • Thank you for completing forms Please keep it up for 2011 5 % of babies had 1 min Apgar ≥ 9 23 % of babies had 5 min Apgar ≥ 7 15 % either no resus or oxygen only Cooling – not all babies Investigation, counseling for family
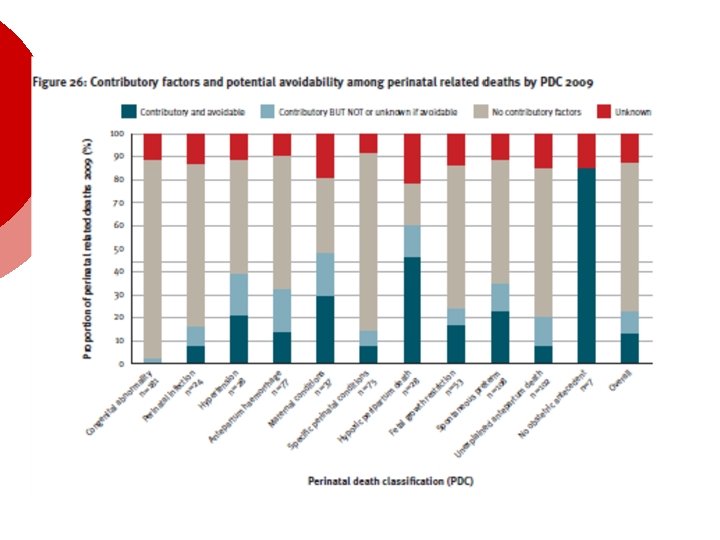
 Neonatal deaths n=182 Contributory factors n % Yes 61 34")
Contributory Factors (T 33) Neonatal deaths n=182 Contributory factors n % Yes 61 34 No 103 57 Not stated 18 10 Potentially avoidable 35 19

Organisation/people/skills

Perinatal Mortality 2009 • Neonatal deaths with no obstetric antecedent are considerably more frequent in babies of Maori mothers • Seven cases of SUDI deaths • • • Four had a mother who smoked 6 were co-sleeping 10 cases in 2008

Conclusion ¡ ¡ ¡ Some contribution clinical practice Major benefit is working across disciplines Communication, best practice, lack of skills and knowledge
- Slides: 21