
Potential activity of methanogens Karoline W Noer Master
- Slides: 10
Potential activity of methanogens Karoline W. Noer Master student Supervisors: Niels Peter Revsbech and Lars D. M. Ottosen
Goals • Estimate the potential activity of methanogens from anaerobic digesters – Methane production with and without hydrogen addition • Develop a method to compare the upgrading potential of different anaerobic digesters
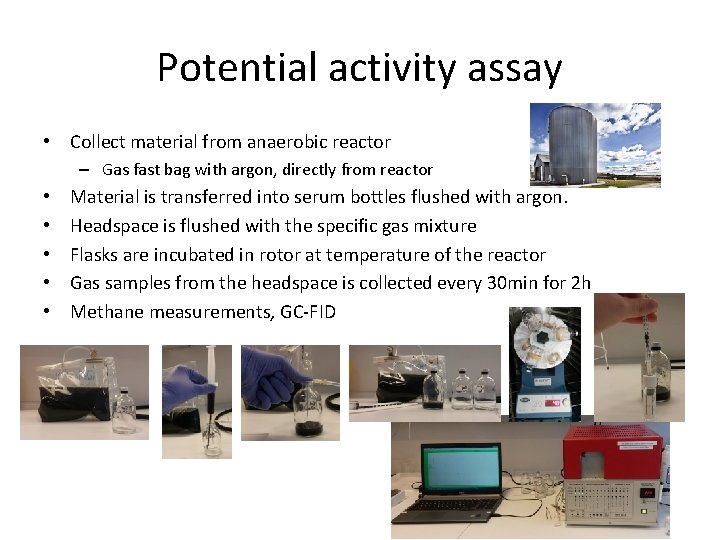
Potential activity assay • Collect material from anaerobic reactor – Gas fast bag with argon, directly from reactor • • • Material is transferred into serum bottles flushed with argon. Headspace is flushed with the specific gas mixture Flasks are incubated in rotor at temperature of the reactor Gas samples from the headspace is collected every 30 min for 2 h Methane measurements, GC-FID
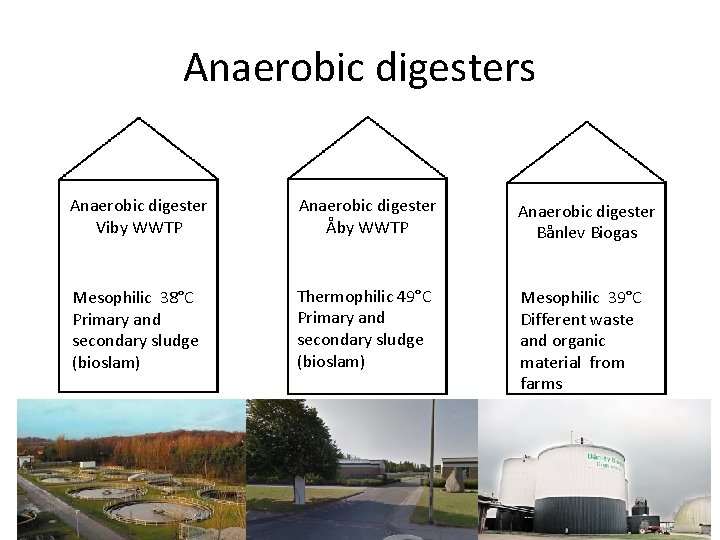
Anaerobic digesters Anaerobic digester Viby WWTP Anaerobic digester Åby WWTP Anaerobic digester Bånlev Biogas Mesophilic 38°C Primary and secondary sludge (bioslam) Thermophilic 49°C Primary and secondary sludge (bioslam) Mesophilic 39°C Different waste and organic material from farms
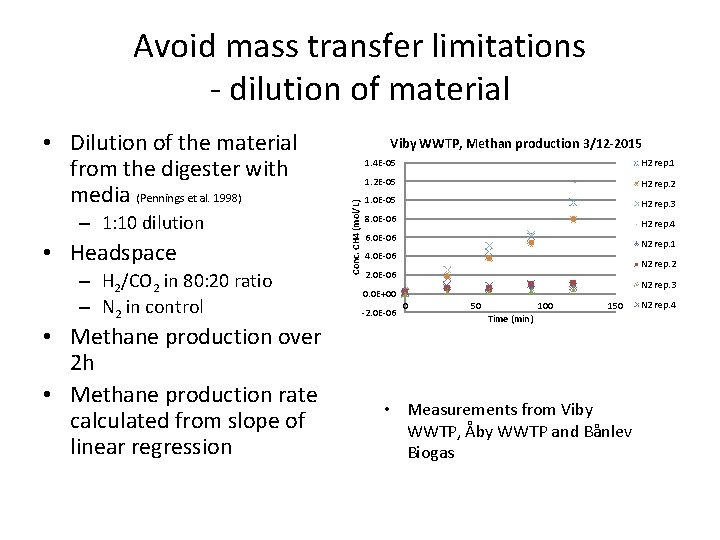
Avoid mass transfer limitations - dilution of material – 1: 10 dilution • Headspace – H 2/CO 2 in 80: 20 ratio – N 2 in control • Methane production over 2 h • Methane production rate calculated from slope of linear regression Viby WWTP, Methan production 3/12 -2015 Conc. CH 4 (mol/L) • Dilution of the material from the digester with media (Pennings et al. 1998) 1. 4 E-05 H 2 rep. 1 1. 2 E-05 H 2 rep. 2 1. 0 E-05 H 2 rep. 3 8. 0 E-06 H 2 rep. 4 6. 0 E-06 N 2 rep. 1 4. 0 E-06 N 2 rep. 2 2. 0 E-06 N 2 rep. 3 0. 0 E+00 -2. 0 E-06 0 50 100 150 Time (min) • Measurements from Viby WWTP, Åby WWTP and Bånlev Biogas N 2 rep. 4
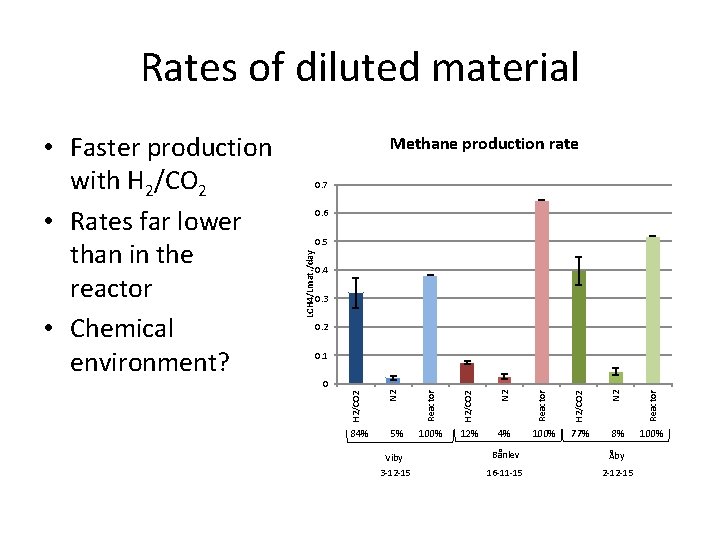
Rates of diluted material Methane production rate 0. 7 0. 6 0. 5 0. 4 0. 3 0. 2 0. 1 H 2/CO 2 N 2 Reactor 5% Reactor 84% N 2 0 H 2/CO 2 LCH 4/Lmat. /day • Faster production with H 2/CO 2 • Rates far lower than in the reactor • Chemical environment? 100% 12% 4% 100% 77% 8% 100% Viby Bånlev Åby 3 -12 -15 16 -11 -15 2 -12 -15
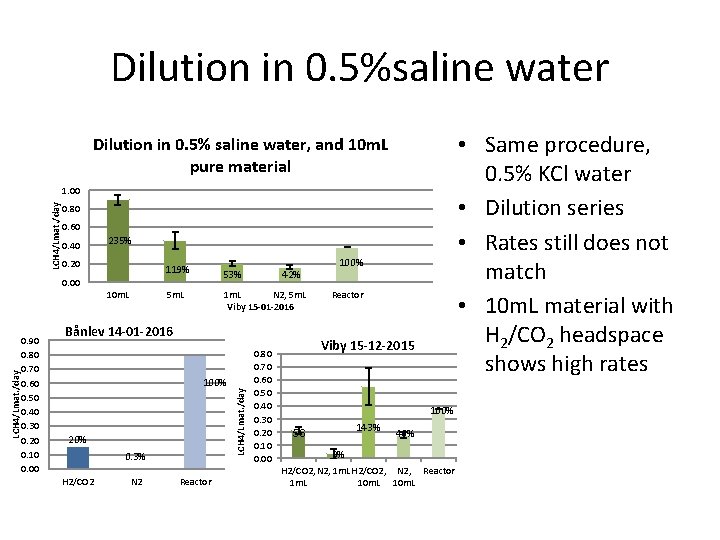
Dilution in 0. 5%saline water • Same procedure, 0. 5% KCl water • Dilution series • Rates still does not match • 10 m. L material with H 2/CO 2 headspace shows high rates Dilution in 0. 5% saline water, and 10 m. L pure material LCH 4/Lmat. /day 1. 00 0. 80 0. 60 0. 40 235% 0. 20 119% 53% 0. 00 0. 90 0. 80 0. 70 0. 60 0. 50 0. 40 0. 30 0. 20 0. 10 0. 00 5 m. L 1 m. L N 2, 5 m. L Viby 15 -01 -2016 Bånlev 14 -01 -2016 100% 20% 0. 3% H 2/CO 2 N 2 Reactor LCH 4/Lmat. /day 10 m. L 42% 0. 80 0. 70 0. 60 0. 50 0. 40 0. 30 0. 20 0. 10 0. 00 100% Reactor Viby 15 -12 -2015 100% 143% 56 46% 9% H 2/CO 2, N 2, 1 m. LH 2/CO 2, N 2, Reactor 1 m. L 10 m. L
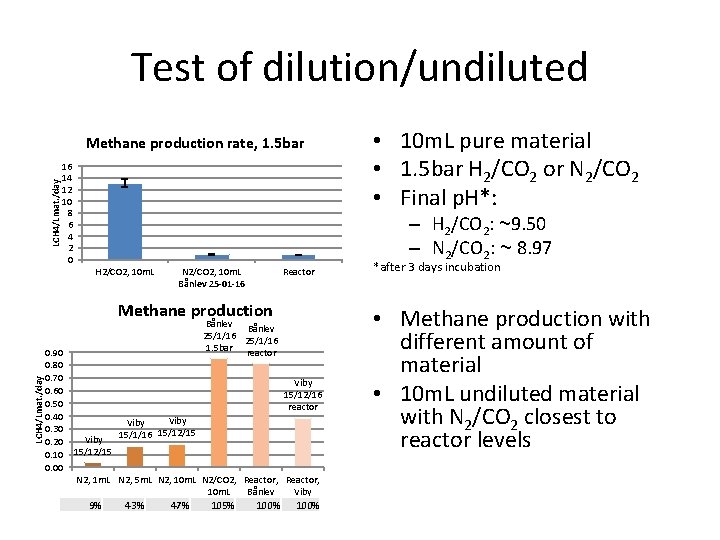
Test of dilution/undiluted LCH 4/Lmat. /day Methane production rate, 1. 5 bar 16 14 12 10 8 6 4 2 0 – H 2/CO 2: ~9. 50 – N 2/CO 2: ~ 8. 97 H 2/CO 2, 10 m. L N 2/CO 2, 10 m. L Bånlev 25 -01 -16 Reactor LCH 4/Lmat. /day Methane production 0. 90 0. 80 0. 70 0. 60 0. 50 0. 40 0. 30 0. 20 0. 10 0. 00 • 10 m. L pure material • 1. 5 bar H 2/CO 2 or N 2/CO 2 • Final p. H*: Bånlev 25/1/16 1. 5 bar reactor Viby 15/12/16 reactor Viby 15/12/15 Viby 15/1/16 15/12/15 N 2, 1 m. L N 2, 5 m. L N 2, 10 m. L N 2/CO 2, Reactor, 10 m. L Bånlev Viby 9% 43% 47% 105% 100% *after 3 days incubation • Methane production with different amount of material • 10 m. L undiluted material with N 2/CO 2 closest to reactor levels
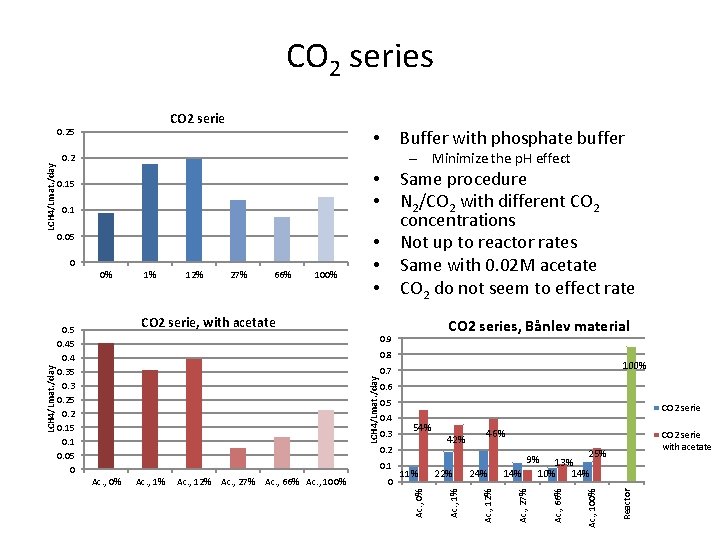
CO 2 series CO 2 serie – Minimize the p. H effect 0. 2 Same procedure N 2/CO 2 with different CO 2 concentrations Not up to reactor rates Same with 0. 02 M acetate CO 2 do not seem to effect rate • • 0. 1 0. 05 0% 1% 12% 27% 66% 100% • • • CO 2 serie, with acetate 0. 5 0. 4 0. 35 0. 3 0. 25 0. 2 0. 15 0. 1 0. 05 0 CO 2 series, Bånlev material 0. 9 0. 6 0. 5 Ac. , 12% Ac. , 27% Ac. , 66% Ac. , 100% 0 11% 22% 46% 24% CO 2 serie with acetate 25% 9% 13% 14% 10% 14% Ac. , 100% 0. 2 42% Ac. , 66% Ac. , 1% 54% Ac. , 27% 0. 3 CO 2 serie Ac. , 12% 0. 4 0. 1 Ac. , 0% 100% 0. 7 Ac. , 1% LCH 4/Lmat. /day 0. 8 Reactor 0. 15 0 LCH 4/Lmat. /day Buffer with phosphate buffer • Ac. , 0% LCH 4/Lmat. /day 0. 25
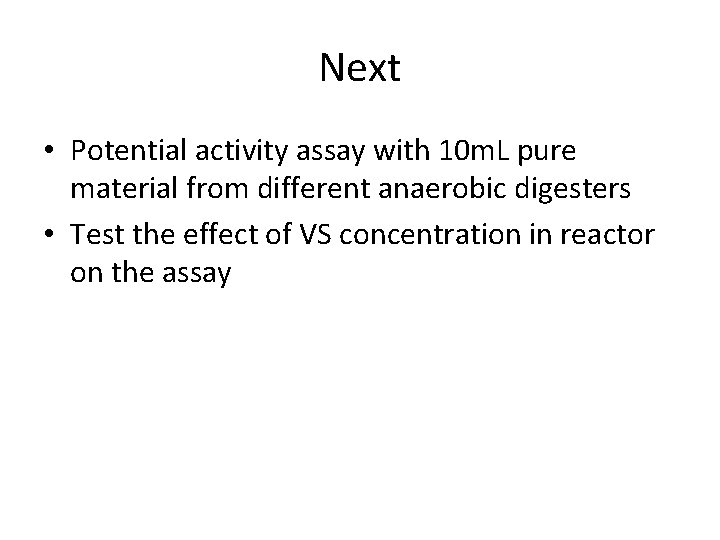
Next • Potential activity assay with 10 m. L pure material from different anaerobic digesters • Test the effect of VS concentration in reactor on the assay