PostSchool Education and traininguptake in labour market trends

Post-School Education and training-uptake in labour market trends. Risenga Maluleke Statistics South Africa

“The single most important investment any country can make is in its people. ” National Development Plan

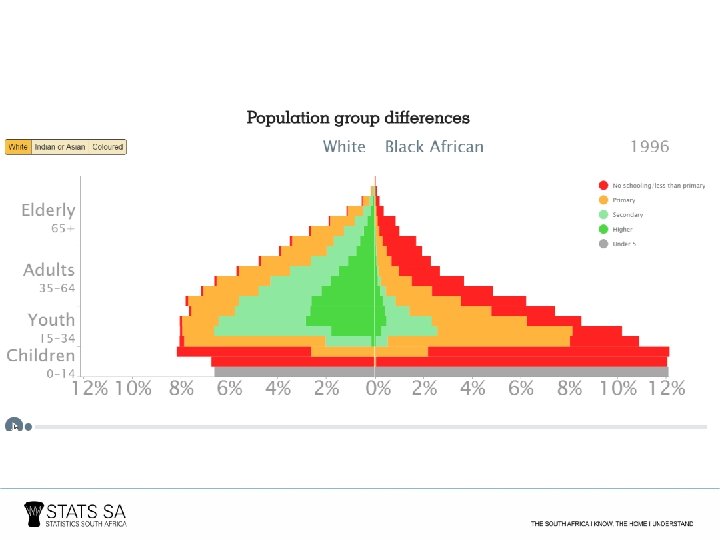
Between 1996 and 2016 we have seen significant changes in the education landscape

Source CS 2016

Enrolments at educational institutions, 2016 The gross enrolment rate for black Africans in primary school was 124, 3% showing the high number of enrolment of learners outside the school-age range 140. 0 120. 0 More white children enrol 124% in ECD institutions 100. 0 compared to the other population groups. 112% 115. 1% 99. 7% 115. 9% 116. 7% 80. 0 85. 9% 82. 8% 60. 0 55. 1% 40. 0 20. 0 39% 30. 9%28. 6% 4% 2. 4% 5. 6% 4. 5% 0. 0 ECD Black African Primary Coloured Secondary Indian/Asian Post-secondary White Source: Community Survey 2016

Mean years of schooling by population group, 2016 11. 7 10. 3 8. 3 11. 4 12. 0 10. 4 10. 2 8. 7 Black Africans spend on average the shortest time in schooling (8, 3 years) Whites spent the longest period at an educational institution, with an average of 11, 4 years of schooling Black African Coloured Indian/Asian 7 years and older White South Africa 15 -34 years old Source: Community Survey 2016

However the Apartheid legacy continues to reflect in current statistics for post school education
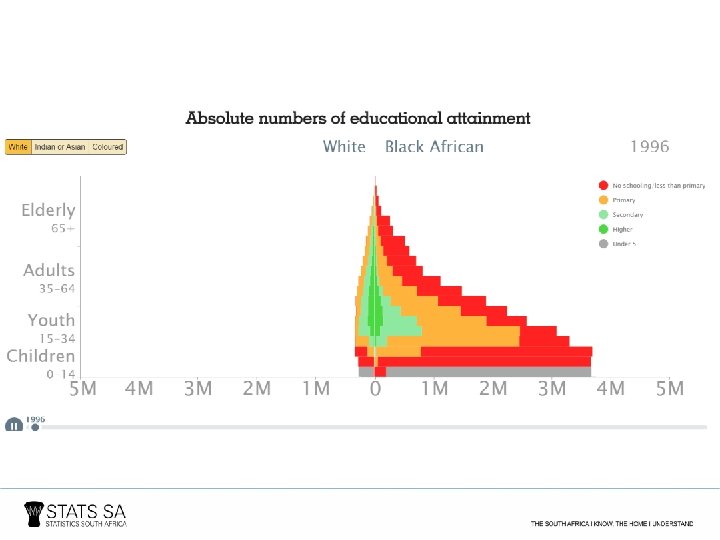

There have been large increases in absolute numbers of higher education participants

Growth in student numbers: 2006– 2015 North West 65. 5% Zululand 59. 5% Fort Hare 57. 8% Unisa 48. 5% Wits 39. 6% Western Cape 37. 4% Central 35. 7% Rhodes 35. 2% All institutions 32. 8% Stellenbosch 31. 2% Cape Town 31. 0% Venda 26. 6% Free State 26. 0% Pretoria 21. 4% Kwa. Zulu-Natal 21. 1% Durban 18. 7% Johannesburg 15. 3% Limpopo 14. 2% Mangosuthu 14. 1% Cape Peninsula 12. 1% Tshwane 32, 8% from 2006 to 2015 11. 3% Nelson Mandela 8. 5% Walter Sisulu Vaal The number of students in higher education grew by 7. 9% 2. 9% Source: Department of Higher Education

However the gap between different population groups is still very evident

Absolute vs Proportions Graduate rates per 1000 of Total Population Group* Absolute numbers of Graduates* 50000 Black 48686 45000 35000 White 4. 50 5. 00 4. 50 Black White Indian Coloured 40000 Graduate rates per 1000 of Total Population Group* 4. 00 3. 53 Indian/Asian 4. 12 1. 71 Coloured 1. 18 3. 50 30000 White 20510 25000 20000 3. 00 2. 50 2. 00 15000 1. 50 Coloured 5622 10000 5000 Indian 5529 0 1986 1996 2006 2014 Source: Adapted from HE Broekhuizen (Hemis Aggregate Figures) Excludes undergraduate diplomas and certificates 1. 00 0. 45 Black African 1. 12 0. 50 0. 00 0. 14 1986 1996 2006 Source: Adapted from HE Broekhuizen (Hemis Aggregate Figures ) with addition of population estimates for time points Excludes undergraduate diplomas and certificates 2014

25% Source CS 2016

Educational attainment among individuals aged 25 -64 by population group, 2016 Whites and Indians have the highest proportion of post-secondary graduates 100. 0 9. 1 8. 1 90. 0 12. 1 21. 0 38. 3 80. 0 Secondary 70. 0 Percentage 60. 0 Post Secondary 68. 7 71. 9 68. 2 50. 0 Primary 71. 1 40. 0 59. 1 30. 0 20. 0 10. 0 15. 1 7. 1 Black African 17. 1 2. 8 Coloured Majority (13, 4 million) reached secondary education 13. 6 5. 5 2. 5 Indian/Asian 1. 6 White No Schooling 6. 0 RSA Large number of black Africans who dropped out of school with some primary education level (3 million)

The Current Labour Market

The labour market Q 4: 2016 36, 9 million people of working age in South Africa (15 – 64 year olds) 21, 8 million Labour force 16, 1 million 5, 8 million Employed Unemployed NDP target 2030 Employment: 24 million 15, 1 million Not economically active* *Of which 2, 3 million were discouraged work seekers ILO hierarchy – Employed first then unemployed and the remainder is NEA (including discouraged job-seekers). 3 mutually exclusive groups. Cannot be in two groups at the same time Source: QLFS, Q 4: 2016

Within the labour market The benefits of further education are clear

Source CS 2016

Graduate unemployment for selected age groups Unemployment Rate for Graduates by Age Groups 35% 30% Graduate Unemployment falls rapidly after age 25 25% 20% 15% 12% 10% 7% 5% 10% 4% 0% 20 -24 25 -29 30 -34 35 -39 Source Nesstar Data Retrieval: Quarterly Labour Force Survey (3 rd Quarter 2016) 40 -44 6% 45 -49 3% 50 -54

Blockages within Tertiary Education
 30% graduated within regulation")
Of the 2008 cohort of first-time entering students (excluding UNISA) 30% graduated within regulation time for a 3 year degree Source: Vital. Stats Public Higher Education 2014 from Council for Higher Education Adapted from http: //www. che. ac. za/focus_areas/higher_education_data/2013/overview

How has the South African workforce shifted in terms of skill levels since 1994?
 1994")
Percentage of workers in each age group who are skilled (managers, professionals, technicians) 1994 2014 The percentage of workers in skilled occupations increased in all age and all race groups, except for black Africans aged 25 -34, which decreased There were much weaker gains in the black African group for all ages

The challenges to achieving the demographic dividend are also seen in the drivers of poverty

CS 2016
 Educational attainment Adult unemployment 35. 5")
Main contributors to poverty amongst Youth (15 -24) Educational attainment Adult unemployment 35. 5 16. 4 NEET 14. 6 General health and functioning 8. 0 Sanitation 5. 1 Energy for heating The major contributor to the poverty situation of the youth in South Africa is educational attainment. 4. 7 Water 3. 9 Energy for cooking 3. 6 Assets 3. 2 Dwelling type 2. 9 Energy for lighting 2. 3 0. 0 5. 0 10. 0 15. 0 20. 0 25. 0 30. 0 35. 0 40. 0 % Source CS 2016

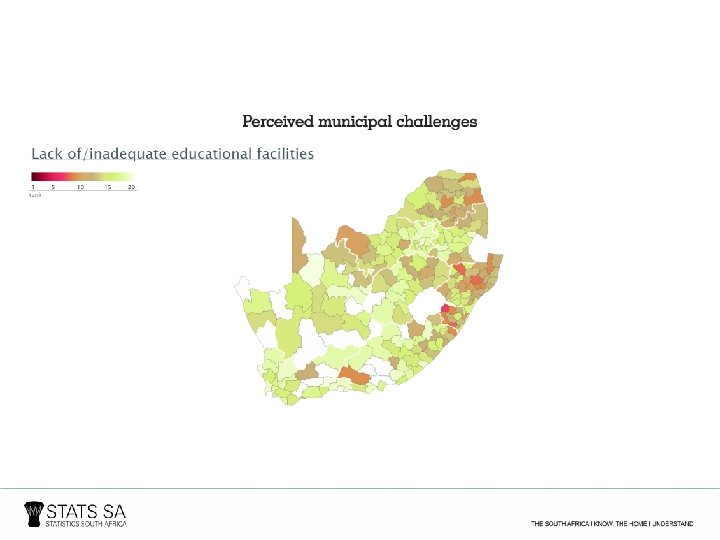
Does the nation see education as a challenge?

for more information Visit statssa. gov. za Thank You
- Slides: 30