
Post Acute Care Collaboration Network Development Andy Page

Post Acute Care Collaboration & Network Development Andy Page, Partner DHG LLP DHG Healthcare

Session Overview - Introduction - Significance of Post‐Acute Care - Impacts of Post‐Acute Care Performance - Mandatory Elements of Reform - Understanding PAC Performance - Managing a Post‐Acute Care Network

Basic Concept Building an effective post-acute network is essential to success under the rapidly accelerating shift from traditional fee-forservice to value-based reimbursement.

Impacts of PAC Networks – 2 Way Street Acute care providers are significantly impacted by the performance of its post-acute care partners • Readmission Volumes • Clinical Outcomes & Patient Satisfaction • Mortality Rates • Financial Performance with Bundled Payments /CJR Post-acute care providers are significantly impacted by Reform Elements and Referral Source • Revenue Cycle – Compressed Length of Stay – Referral Volumes & Backfill Admissions • Patient Acuity / Diagnoses

Significance of Post‐Acute Care
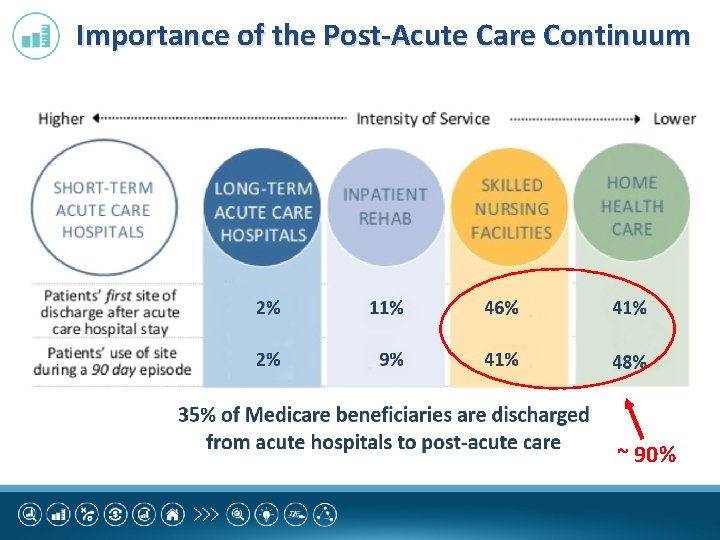
Importance of the Post-Acute Care Continuum ~ 90%
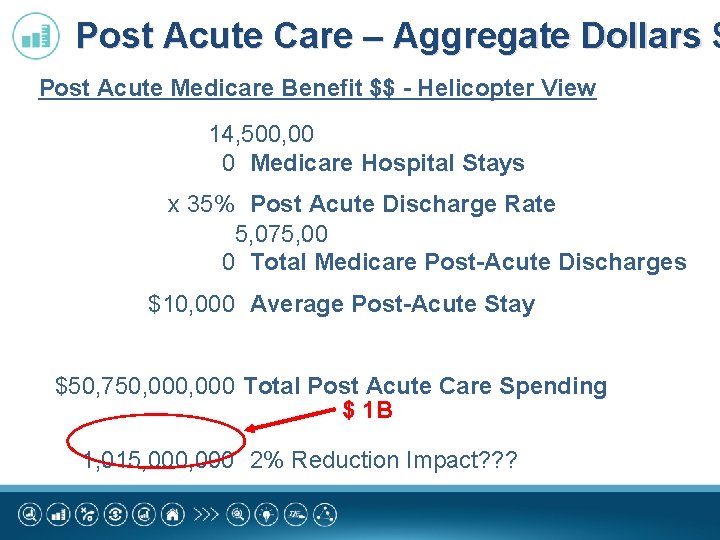
Post Acute Care – Aggregate Dollars $ Post Acute Medicare Benefit $$ - Helicopter View 14, 500, 00 0 Medicare Hospital Stays x 35% Post Acute Discharge Rate 5, 075, 00 0 Total Medicare Post-Acute Discharges $10, 000 Average Post-Acute Stay $50, 750, 000 Total Post Acute Care Spending $ 1 B 1, 015, 000 2% Reduction Impact? ? ?
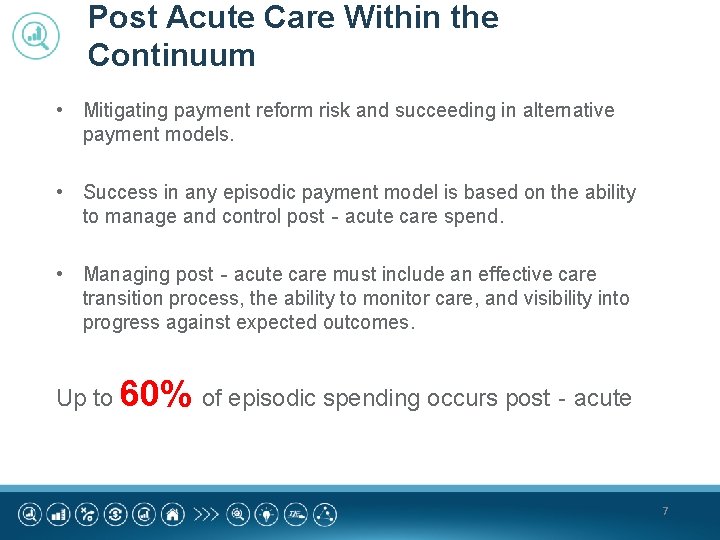
Post Acute Care Within the Continuum • Mitigating payment reform risk and succeeding in alternative payment models. • Success in any episodic payment model is based on the ability to manage and control post‐acute care spend. • Managing post‐acute care must include an effective care transition process, the ability to monitor care, and visibility into progress against expected outcomes. Up to 60% of episodic spending occurs post‐acute 7

Impacts of Post‐Acute Care Performance & Mandatory Elements of Reform
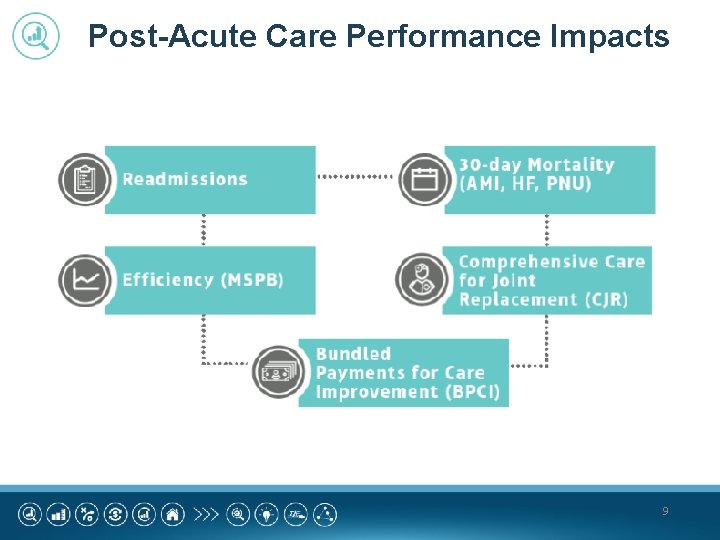
Post-Acute Care Performance Impacts 9
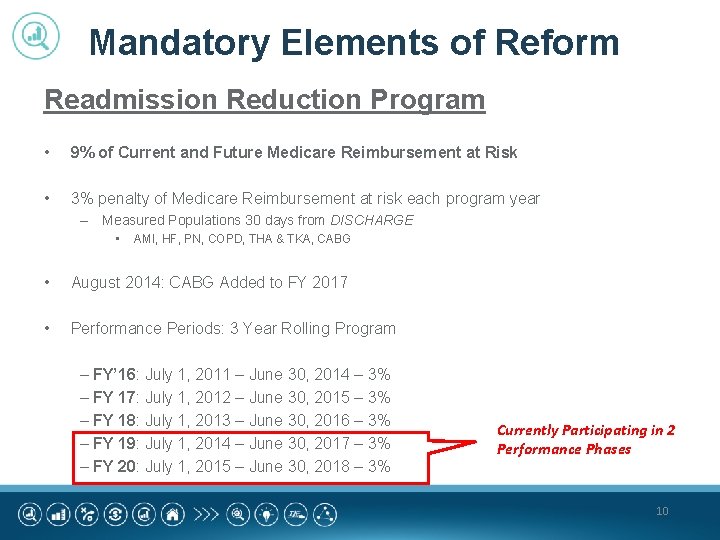
Mandatory Elements of Reform Readmission Reduction Program • 9% of Current and Future Medicare Reimbursement at Risk • 3% penalty of Medicare Reimbursement at risk each program year – Measured Populations 30 days from DISCHARGE • AMI, HF, PN, COPD, THA & TKA, CABG • August 2014: CABG Added to FY 2017 • Performance Periods: 3 Year Rolling Program – FY’ 16: July 1, 2011 – June 30, 2014 – 3% – FY 17: July 1, 2012 – June 30, 2015 – 3% – FY 18: July 1, 2013 – June 30, 2016 – 3% – FY 19: July 1, 2014 – June 30, 2017 – 3% – FY 20: July 1, 2015 – June 30, 2018 – 3% Currently Participating in 2 Performance Phases 10
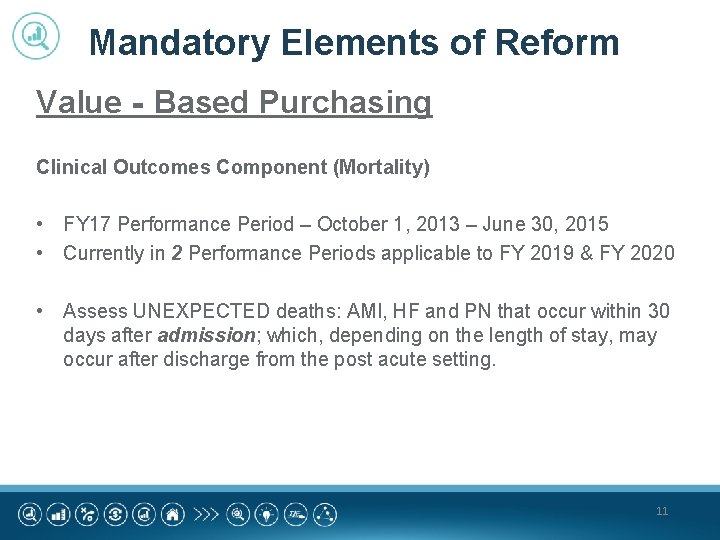
Mandatory Elements of Reform Value‐Based Purchasing Clinical Outcomes Component (Mortality) • FY 17 Performance Period – October 1, 2013 – June 30, 2015 • Currently in 2 Performance Periods applicable to FY 2019 & FY 2020 • Assess UNEXPECTED deaths: AMI, HF and PN that occur within 30 days after admission; which, depending on the length of stay, may occur after discharge from the post acute setting. 11
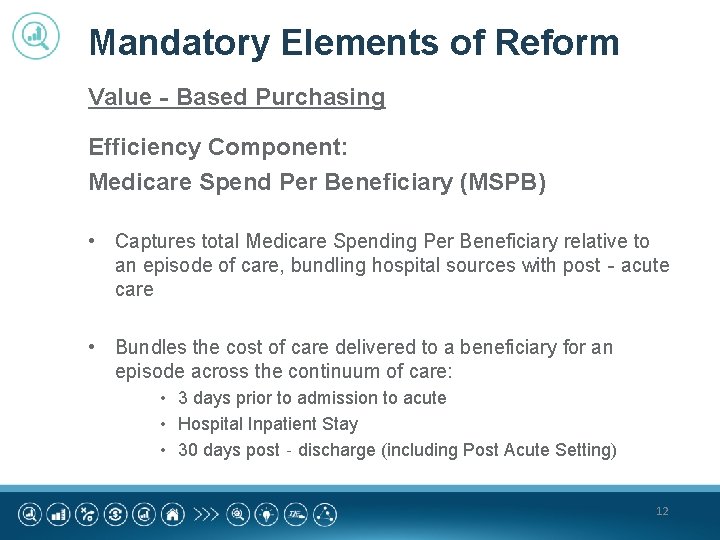
Mandatory Elements of Reform Value‐Based Purchasing Efficiency Component: Medicare Spend Per Beneficiary (MSPB) • Captures total Medicare Spending Per Beneficiary relative to an episode of care, bundling hospital sources with post‐acute care • Bundles the cost of care delivered to a beneficiary for an episode across the continuum of care: • 3 days prior to admission to acute • Hospital Inpatient Stay • 30 days post‐discharge (including Post Acute Setting) 12
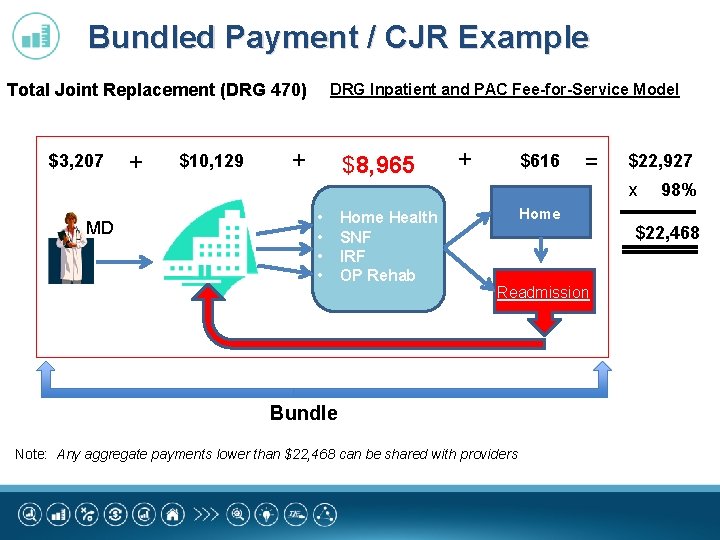
Bundled Payment / CJR Example Total Joint Replacement (DRG 470) $3, 207 + $10, 129 DRG Inpatient and PAC Fee-for-Service Model + $8, 965 + $616 = $22, 927 x MD • • Home Health SNF IRF OP Rehab 98% Home $22, 468 Readmission Bundle Note: Any aggregate payments lower than $22, 468 can be shared with providers
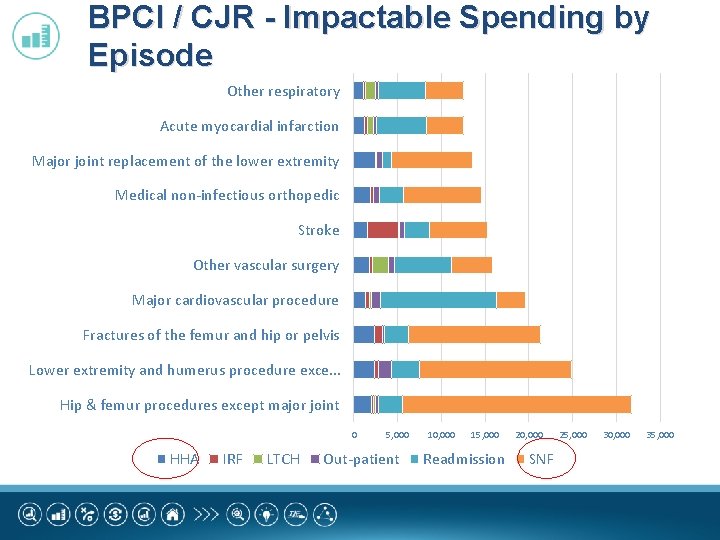
BPCI / CJR - Impactable Spending by Episode Other respiratory Acute myocardial infarction Major joint replacement of the lower extremity Medical non-infectious orthopedic Stroke Other vascular surgery Major cardiovascular procedure Fractures of the femur and hip or pelvis Lower extremity and humerus procedure exce. . . Hip & femur procedures except major joint 0 HHA IRF LTCH 5, 000 Out-patient 10, 000 15, 000 Readmission 20, 000 SNF 25, 000 30, 000 35, 000

Understanding PAC Performance
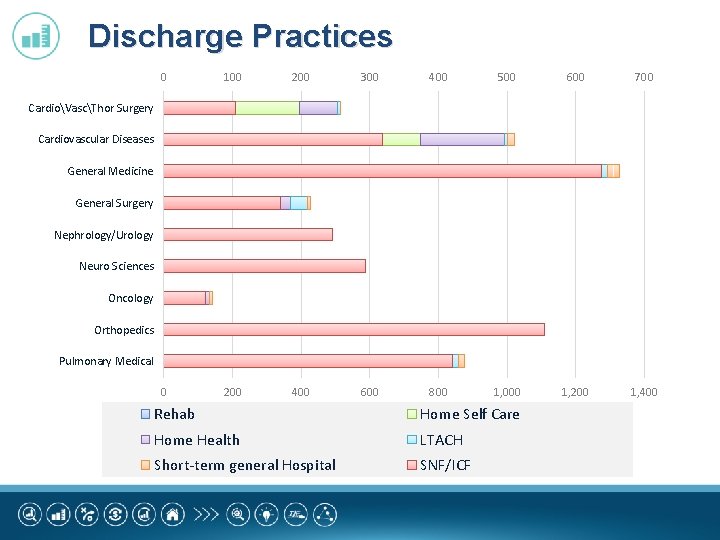
Discharge Practices 0 100 200 300 400 500 600 700 0 200 400 600 800 1, 000 1, 200 1, 400 CardioVascThor Surgery Cardiovascular Diseases General Medicine General Surgery Nephrology/Urology Neuro Sciences Oncology Orthopedics Pulmonary Medical Rehab Home Self Care Home Health LTACH Short-term general Hospital SNF/ICF
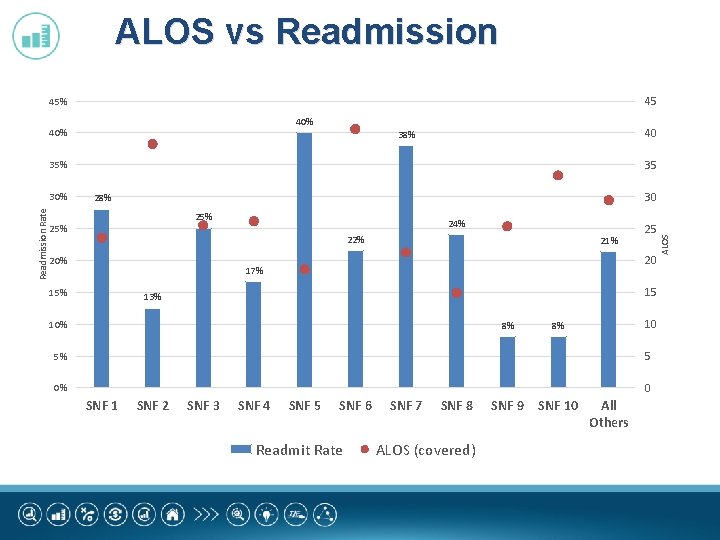
ALOS vs Readmission 45 45% 40% 40 38% 35 35% 30 28% 25% 24% 22% 20% 21% 20 17% 15% 25 15 13% 10% 8% 10 8% 5% 5 0% 0 SNF 1 SNF 2 SNF 3 SNF 4 SNF 5 SNF 6 Readmit Rate SNF 7 SNF 8 ALOS (covered) SNF 9 SNF 10 All Others ALOS Readmission Rate 30%
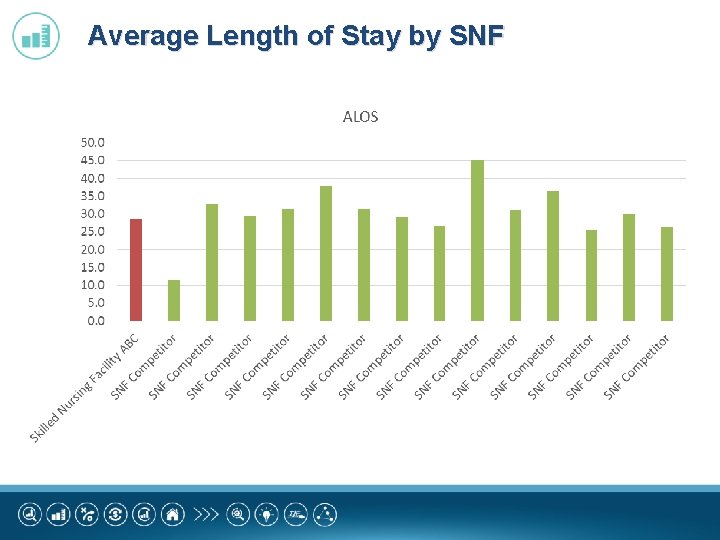
Average Length of Stay by SNF
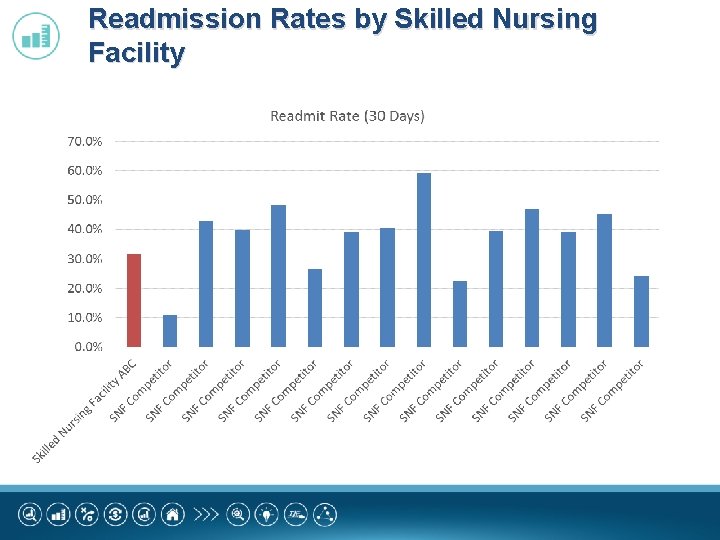
Readmission Rates by Skilled Nursing Facility
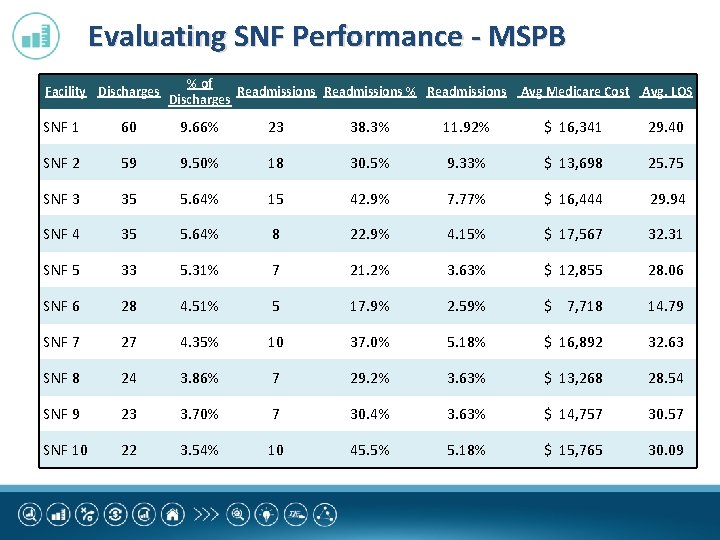
Evaluating SNF Performance - MSPB Facility Discharges % of Readmissions % Readmissions Discharges Avg Medicare Cost Avg. LOS SNF 1 60 9. 66% 23 38. 3% 11. 92% $ 16, 341 29. 40 SNF 2 59 9. 50% 18 30. 5% 9. 33% $ 13, 698 25. 75 SNF 3 35 5. 64% 15 42. 9% 7. 77% $ 16, 444 29. 94 SNF 4 35 5. 64% 8 22. 9% 4. 15% $ 17, 567 32. 31 SNF 5 33 5. 31% 7 21. 2% 3. 63% $ 12, 855 28. 06 SNF 6 28 4. 51% 5 17. 9% 2. 59% $ 7, 718 14. 79 SNF 7 27 4. 35% 10 37. 0% 5. 18% $ 16, 892 32. 63 SNF 8 24 3. 86% 7 29. 2% 3. 63% $ 13, 268 28. 54 SNF 9 23 3. 70% 7 30. 4% 3. 63% $ 14, 757 30. 57 SNF 10 22 3. 54% 10 45. 5% 5. 18% $ 15, 765 30. 09

Developing and Managing a Post‐Acute Care Network
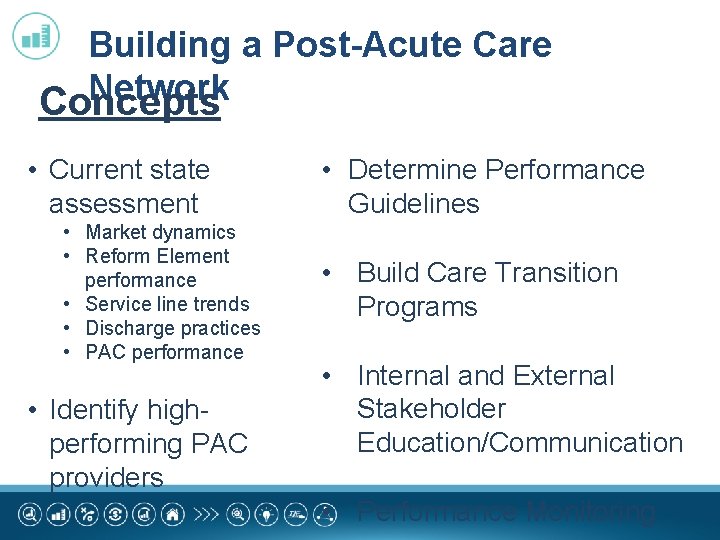
Building a Post-Acute Care Network Concepts • Current state assessment • Market dynamics • Reform Element performance • Service line trends • Discharge practices • PAC performance • Identify highperforming PAC providers • Determine Performance Guidelines • Build Care Transition Programs • Internal and External Stakeholder Education/Communication • Performance Monitoring
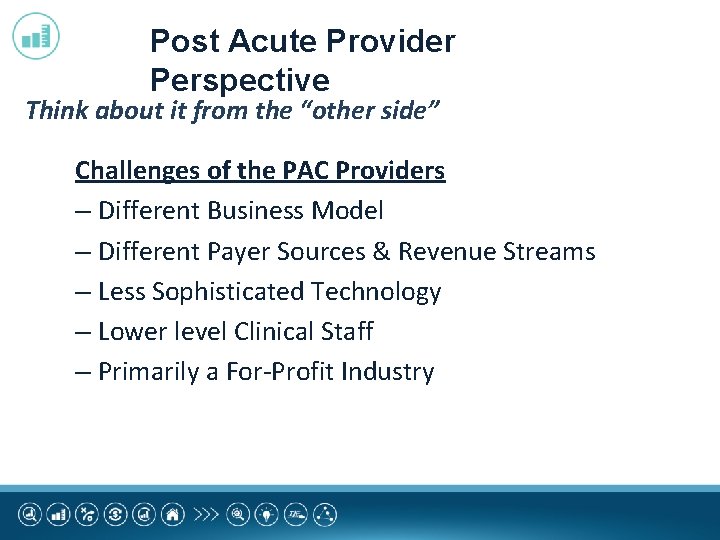
Post Acute Provider Perspective Think about it from the “other side” Challenges of the PAC Providers – Different Business Model – Different Payer Sources & Revenue Streams – Less Sophisticated Technology – Lower level Clinical Staff – Primarily a For-Profit Industry
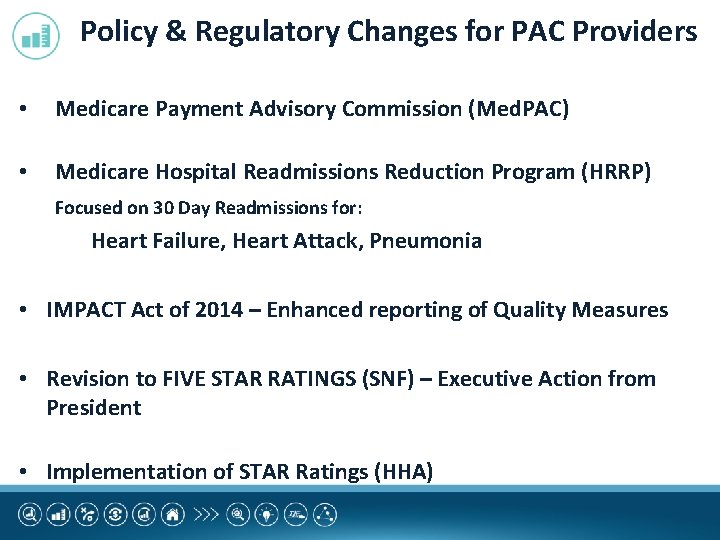
Policy & Regulatory Changes for PAC Providers • Medicare Payment Advisory Commission (Med. PAC) • Medicare Hospital Readmissions Reduction Program (HRRP) Focused on 30 Day Readmissions for: Heart Failure, Heart Attack, Pneumonia • IMPACT Act of 2014 – Enhanced reporting of Quality Measures • Revision to FIVE STAR RATINGS (SNF) – Executive Action from President • Implementation of STAR Ratings (HHA)

Hallmarks of an Effective Post-Acute Care Network High-Quality Partners Standardized Transfer Protocols IT Connectivity Empowered Patients and Staff • Rigorous selection process • Clear expectations for discharges • Real-time market availability • Compliant patient education • Quality transparency • Resources for case management and physicians • Staff support & buy- • Objective rotation & in at affiliates measurement system for rejected cases • Performance monitoring of network partners • Electronic patient information transfer • Staff education
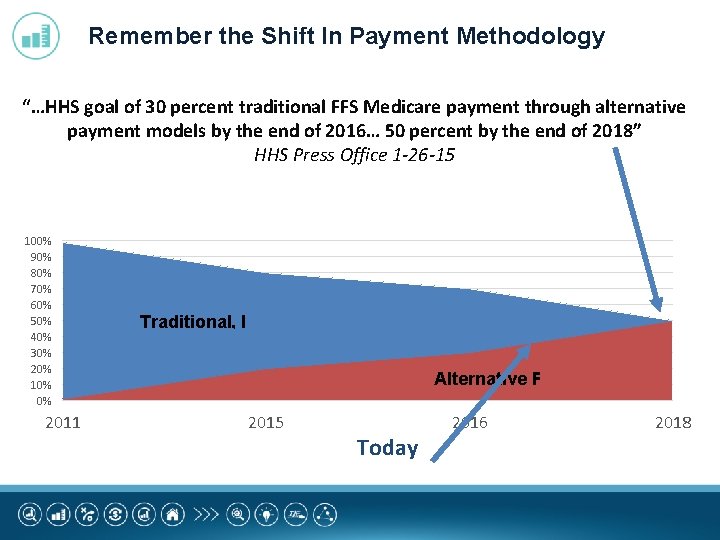
Remember the Shift In Payment Methodology “…HHS goal of 30 percent traditional FFS Medicare payment through alternative payment models by the end of 2016… 50 percent by the end of 2018” HHS Press Office 1 -26 -15 100% 90% 80% 70% 60% 50% 40% 30% 20% 10% 0% 2011 Traditional, Fee for Service Alternative Payment Models 2015 Today 2016 2018
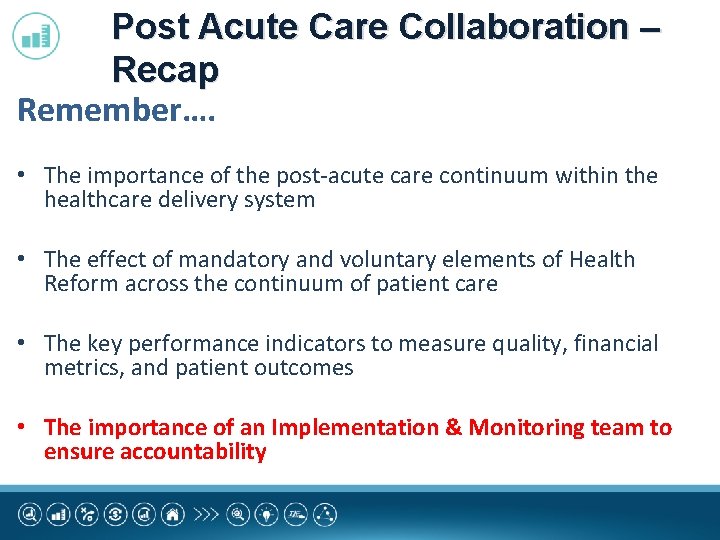
Post Acute Care Collaboration – Recap Remember…. • The importance of the post-acute care continuum within the healthcare delivery system • The effect of mandatory and voluntary elements of Health Reform across the continuum of patient care • The key performance indicators to measure quality, financial metrics, and patient outcomes • The importance of an Implementation & Monitoring team to ensure accountability

? ? Questions… ? ? Andy Page, CPA Partner – DHG LLP DHG Healthcare 919. 526. 1836 andy. page@dhgllp. com Thank You!
- Slides: 29