
Possible Research Interests Kyu Won Choi Econ 201

+ Possible Research Interests Kyu Won Choi Econ 201 FS February 16, 2011
+ GARCH model + Realized Variation Measures n Combining realized variation measures based on high-frequency data with more traditional GARCH type models n Some Examples n Realized GARCH Models n HEAVY models n Multiplicative Error Model n HYBRID GARCH Models n Generalized Expected RV (GERV) models n HARG-RV models n Other multi-period forecasts joint models
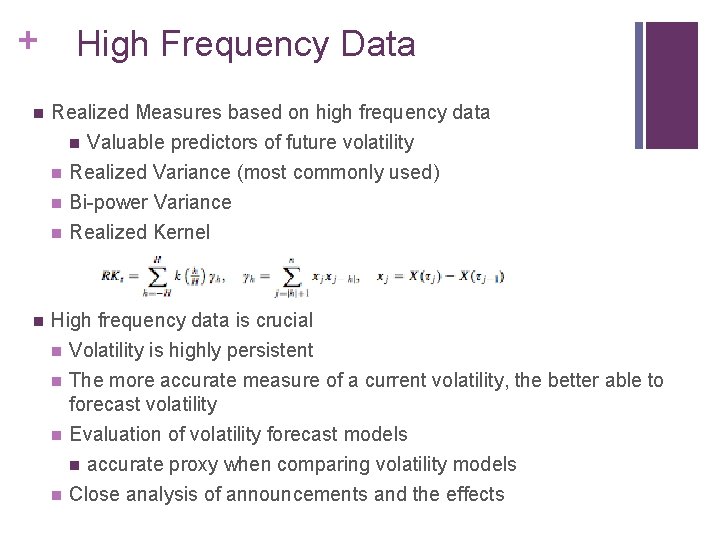
+ n High Frequency Data Realized Measures based on high frequency data n Valuable predictors of future volatility n n Realized Variance (most commonly used) Bi-power Variance Realized Kernel High frequency data is crucial n n Volatility is highly persistent The more accurate measure of a current volatility, the better able to forecast volatility Evaluation of volatility forecast models n accurate proxy when comparing volatility models Close analysis of announcements and the effects
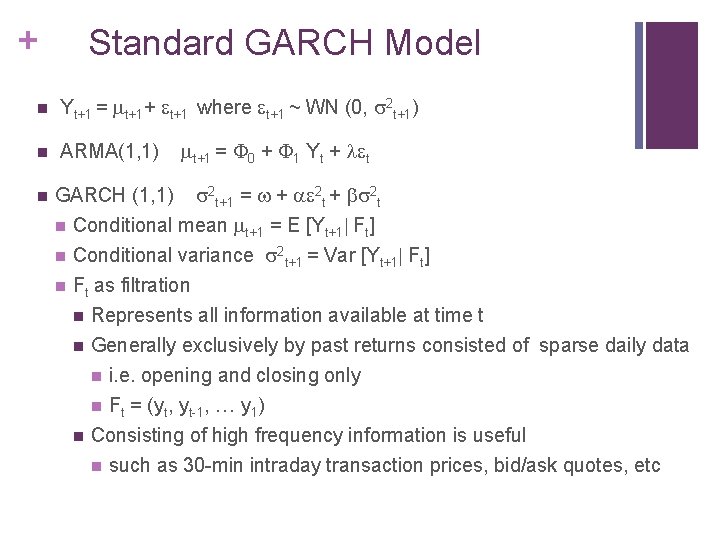
+ Standard GARCH Model n Yt+1 = t+1+ t+1 where t+1 ~ WN (0, 2 t+1) n ARMA(1, 1) n t+1 = 0 + 1 Yt + t GARCH (1, 1) 2 t+1 = + 2 t n Conditional mean t+1 = E [Yt+1 Ft] n Conditional variance 2 t+1 = Var [Yt+1 Ft] n Ft as filtration n Represents all information available at time t n n Generally exclusively by past returns consisted of sparse daily data n i. e. opening and closing only n Ft = (yt, yt-1, y 1) Consisting of high frequency information is useful n such as 30 -min intraday transaction prices, bid/ask quotes, etc
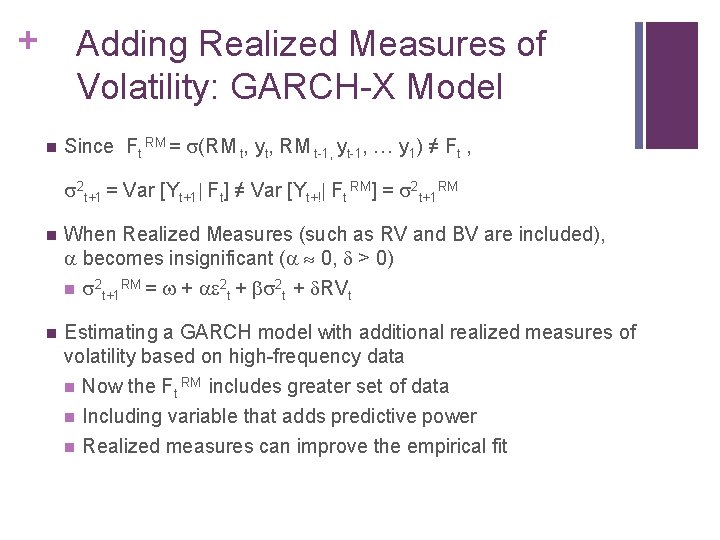
+ Adding Realized Measures of Volatility: GARCH-X Model n Since Ft RM = (RM t, yt, RM t-1, yt-1, y 1) ≠ Ft , 2 t+1 = Var [Yt+1 Ft] ≠ Var [Yt+! Ft RM] = 2 t+1 RM n When Realized Measures (such as RV and BV are included), becomes insignificant ( 0, > 0) n 2 t+1 RM = + 2 t + RVt n Estimating a GARCH model with additional realized measures of volatility based on high-frequency data n n n Now the Ft RM includes greater set of data Including variable that adds predictive power Realized measures can improve the empirical fit
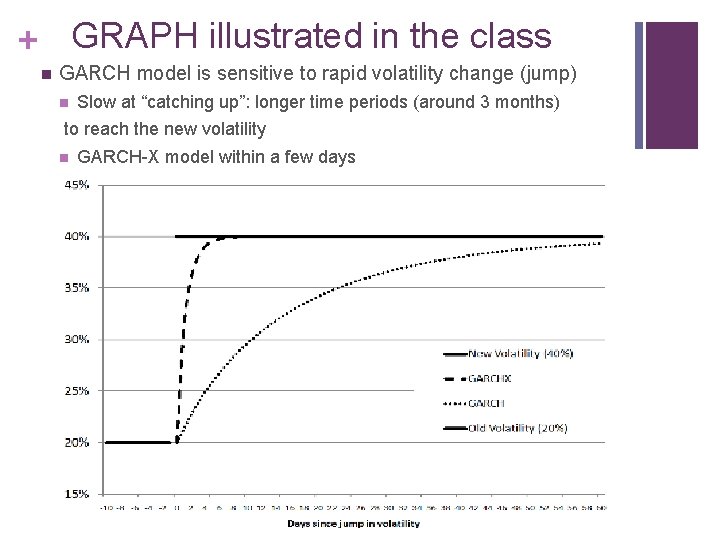
+ GRAPH illustrated in the class n GARCH model is sensitive to rapid volatility change (jump) n Slow at “catching up”: longer time periods (around 3 months) to reach the new volatility n GARCH-X model within a few days
+ GARCH-X Model n Two different methods n n Parallel GARCH structure n For each realized measure, additional GARCH-type model (latent volatility process) is introduced n Multiplicative Error Model (MEM) n n depending on the number of latent volatility variables High-frequency based Volatility Model (HEAVY) Realized Measures n Similar to the traditional GARCH n Realized GARCH model with a single latent volatility factor n Connected to conditional variance of returns
+ Parallel GARCH Structure n MEM and HEAVY models digress from the traditional GARCH n Which uses only a single latent volatility factor n HEAVY model by Shephard and Sheppard (2010) n Realized kernel (RK) n Multiplicative Error Model (MEM) by Engel (2002) n In addition to squared returns, n Two realized measures n Intraday range (high minus low) n Realized variance
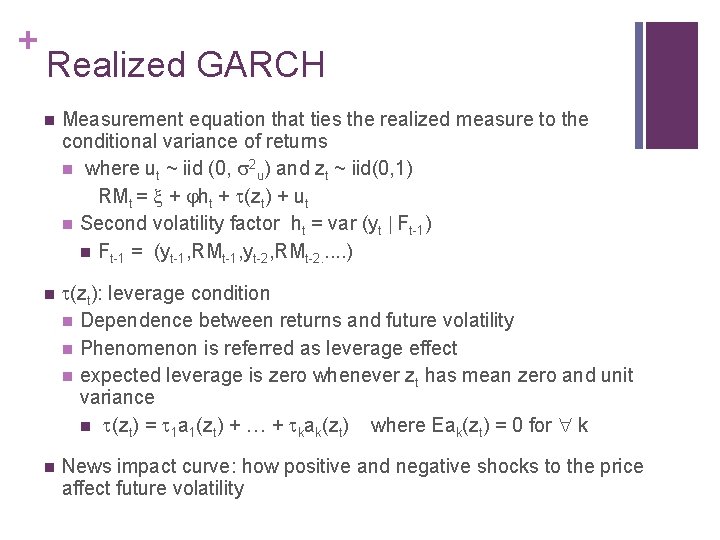
+ Realized GARCH n Measurement equation that ties the realized measure to the conditional variance of returns n where ut ~ iid (0, 2 u) and zt ~ iid(0, 1) RMt = + ht + (zt) + ut n Second volatility factor ht = var (yt Ft-1) n Ft-1 = (yt-1, RMt-1, yt-2, RMt-2. . . ) n (zt): leverage condition n Dependence between returns and future volatility n Phenomenon is referred as leverage effect n expected leverage is zero whenever zt has mean zero and unit variance n (zt) = 1 a 1(zt) + + kak(zt) where Eak(zt) = 0 for k n News impact curve: how positive and negative shocks to the price affect future volatility
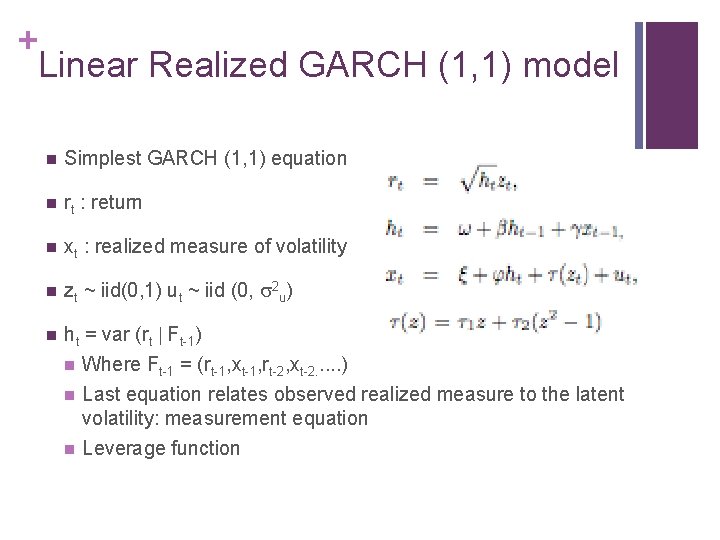
+ Linear Realized GARCH (1, 1) model n Simplest GARCH (1, 1) equation n rt : return n xt : realized measure of volatility n zt ~ iid(0, 1) ut ~ iid (0, 2 u) n ht = var (rt Ft-1) n Where Ft-1 = (rt-1, xt-1, rt-2, xt-2. . . ) n Last equation relates observed realized measure to the latent volatility: measurement equation n Leverage function
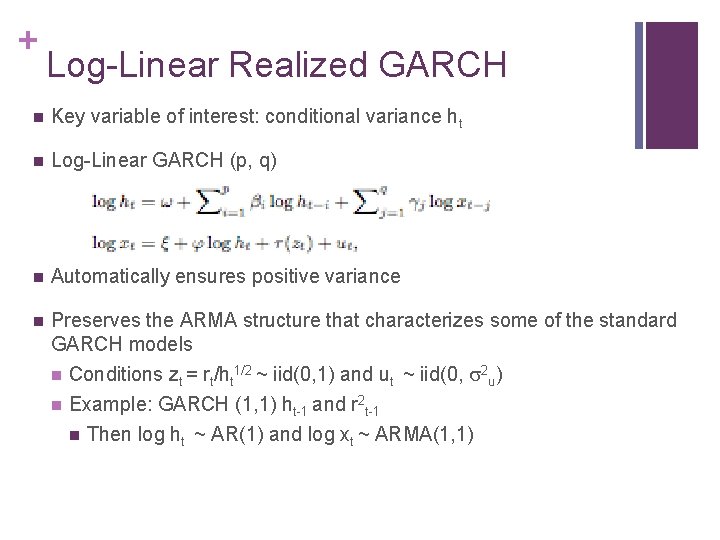
+ Log-Linear Realized GARCH n Key variable of interest: conditional variance ht n Log-Linear GARCH (p, q) n Automatically ensures positive variance n Preserves the ARMA structure that characterizes some of the standard GARCH models n Conditions zt = rt/ht 1/2 ~ iid(0, 1) and ut ~ iid(0, 2 u) n Example: GARCH (1, 1) ht-1 and r 2 t-1 n Then log ht ~ AR(1) and log xt ~ ARMA(1, 1)
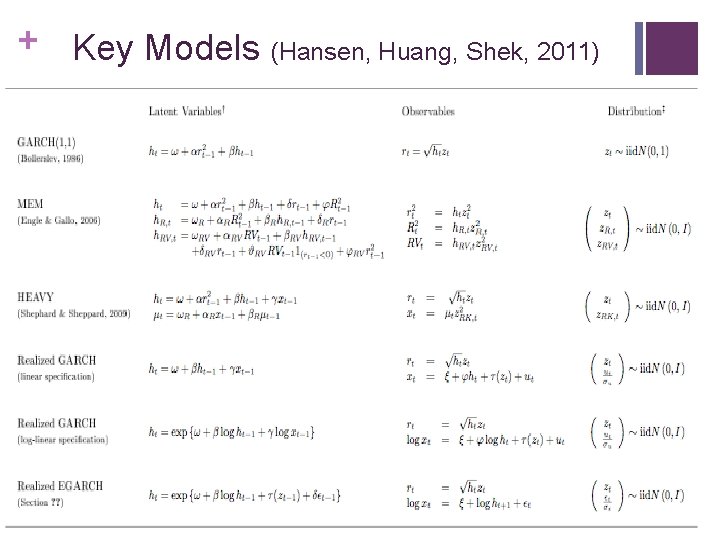
+ Key Models (Hansen, Huang, Shek, 2011)
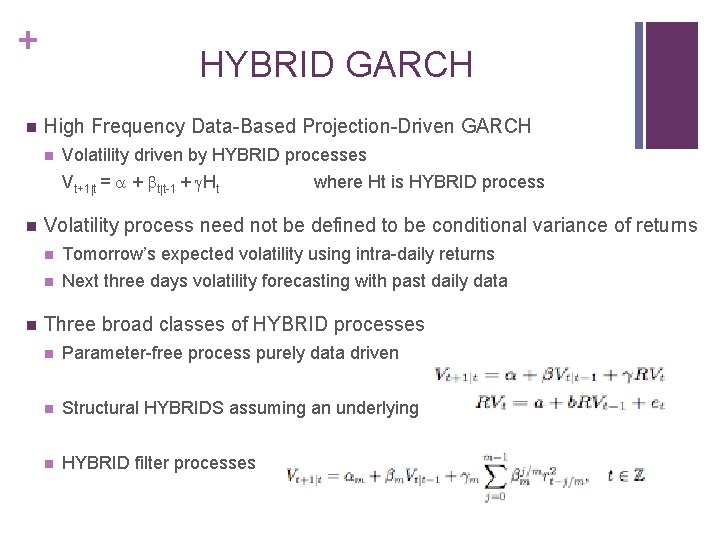
+ n HYBRID GARCH High Frequency Data-Based Projection-Driven GARCH n Volatility driven by HYBRID processes Vt+1 t = + t t-1 + Ht n n where Ht is HYBRID process Volatility process need not be defined to be conditional variance of returns n Tomorrow’s expected volatility using intra-daily returns n Next three days volatility forecasting with past daily data Three broad classes of HYBRID processes n Parameter-free process purely data driven n Structural HYBRIDS assuming an underlying high frequency data structure n HYBRID filter processes
+ The Practical Application n Out-of-sample forecasting n Risk Measurement & Management n Asset Pricing n Portfolio Allocation n Option Pricing
+ Work To Do & Further Interests n Use the data and compare various GARCH +RM n Observe the positive and negative sides of each n Multivariate GARCH models & Realized GARCH framework: multi-factor structure (multi-period forecasting) n m realized measures and k latent volatility variables n Presence of jumps in the price process n Information about forecasting volatility n Inclusion of a jump robust realized measure n Extent to which microstructure effects are relevant for the forecasting problem n using realized measures that are robust to microstructure effects
+ References n Realized GARCH: A Joint Model for Returns and Realized Measures of Volatility (Hansen, Huang, Shek, 2010) n Forecasting Volatility using High Frequency Data (Hansen, Lunde, 2011) n The Class of HYBRID-GARCH Models (Chen, Ghysels, Wang, 2011) n Exchange Rate Returns Standardized by Realized Volatility are (Nearly) Gaussian (Torben G. Andersen, Bollerslev, Diebold, Labys, 2000)
- Slides: 16