
Positron Emission Tomography Tool to Facilitate Drug Development





-PK 11195 IC 50 = 0. 8](https://slidetodoc.com/presentation_image_h/0eb751e1c3996af496afea1624f885aa/image-35.jpg "Old and New PBR PET Ligands [11 C](R)-PK 11195 IC 50 = 0. 8")


- Slides: 52
Positron Emission Tomography: Tool to Facilitate Drug Development and to Study Pharmacokinetics Robert B. Innis, MD, Ph. D Molecular Imaging Branch National Institute Mental Health
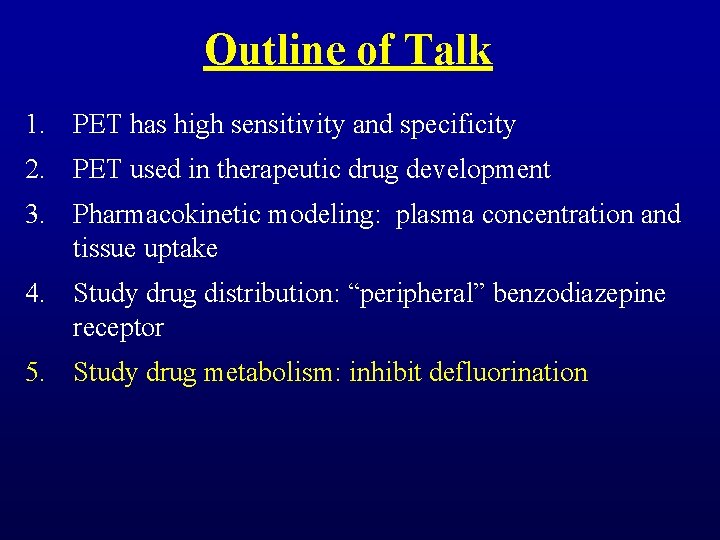
Outline of Talk 1. PET has high sensitivity and specificity 2. PET used in therapeutic drug development 3. Pharmacokinetic modeling of plasma concentration and tissue uptake can measure receptor density 4. Study drug distribution: “peripheral” benzodiazepine receptor 5. Study drug metabolism: inhibit defluorination
Positron Emission Tomography
PET vs. MRI PET MRI Spatial Resolution 2 – 6 mm << 1 mm Sensitivity 10 -12 M 10 -4 M Temporal Resolution minutes <1 sec Radionuclide (11 C): high sensitivity Ligand (raclopride): high selectivity Radioligand [11 C]raclopride: high sensitivity & selectivity
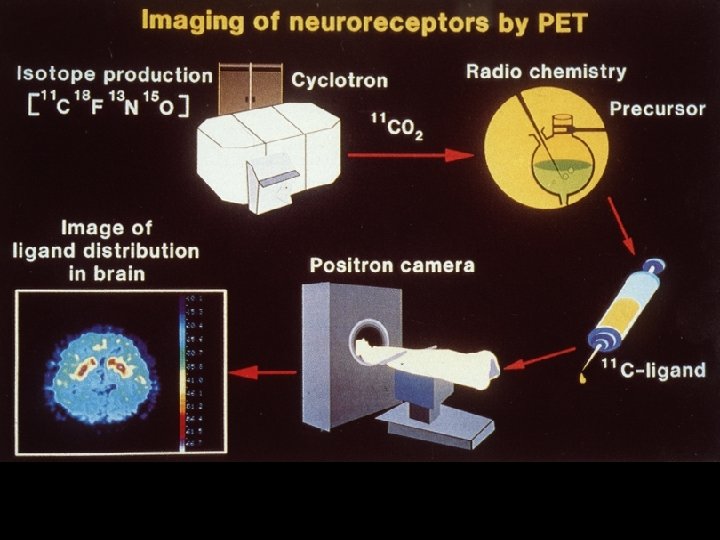
Radioligand = Drug + Radioactivity 1. Drug administered at tracer doses a) No pharm effects b) Labels <1% receptors c) Labeled subset reflects entire population 2. Radioligand disposed like all drugs a) Metabolism & distribution 3. Radiation exposure
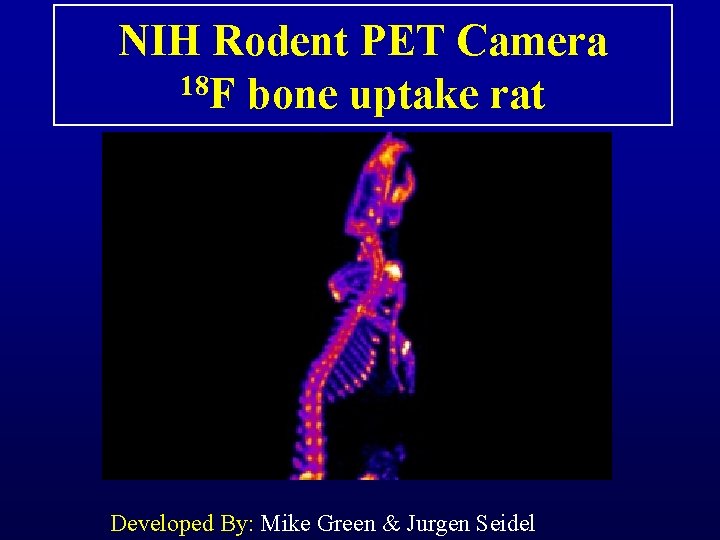
NIH Rodent PET Camera 18 F bone uptake rat Developed By: Mike Green & Jurgen Seidel
PET: Tool in Therapeutic Drug Development • Determine dose and dosing interval • Identify homogeneous group • Biomarker for drug efficacy • Monitor gene or stem cell therapy
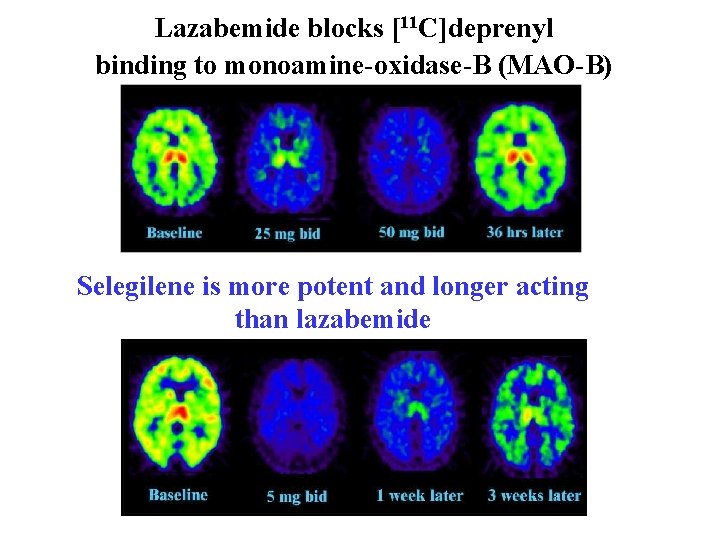
Lazabemide blocks [11 C]deprenyl binding to monoamine-oxidase-B (MAO-B) Selegilene is more potent and longer acting than lazabemide
PET: Tool in Therapeutic Drug Development • Determine dose and dosing interval • Identify homogeneous group • Biomarker for drug efficacy • Monitor gene or stem cell therapy
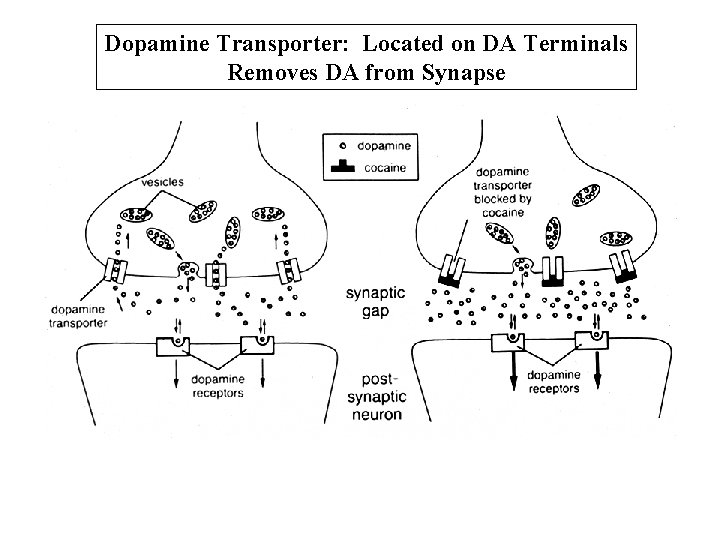
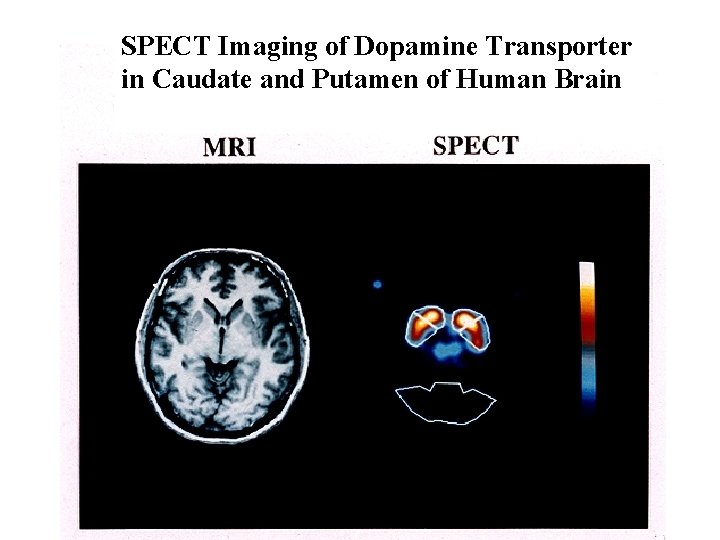
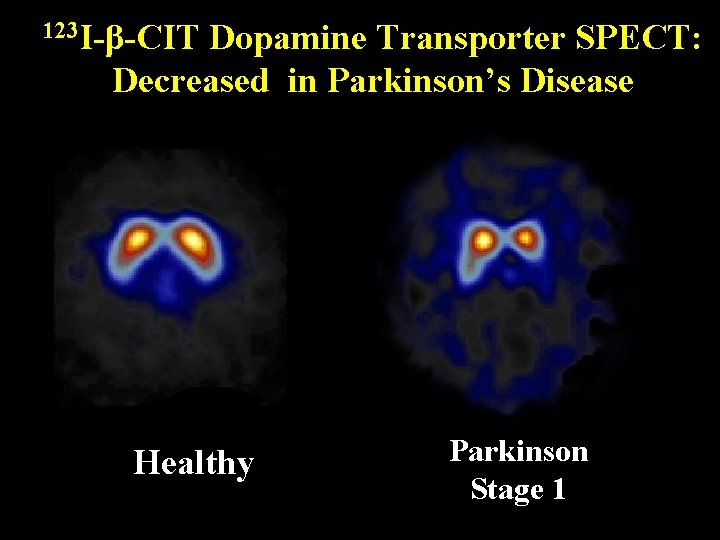
Dopamine Transporter: Located on DA Terminals Removes DA from Synapse
SPECT Imaging of Dopamine Transporter in Caudate and Putamen of Human Brain
123 I-β-CIT Dopamine Transporter SPECT: Decreased in Parkinson’s Disease Healthy Parkinson Stage 1
PET: Tool in Therapeutic Drug Development • Determine dose and dosing interval • Identify homogeneous group • Biomarker for drug efficacy • Monitor gene or stem cell therapy
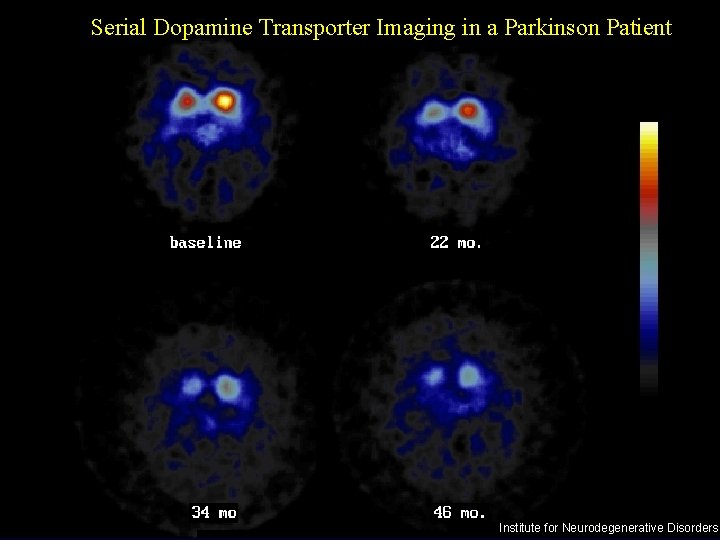
Serial Dopamine Transporter Imaging in a Parkinson Patient Institute for Neurodegenerative Disorders
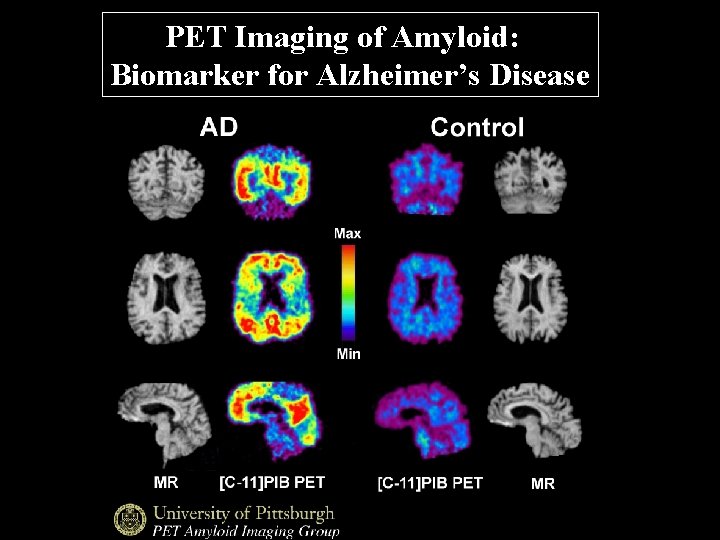
PET Imaging of Amyloid: Biomarker for Alzheimer’s Disease
PET: Tool in Therapeutic Drug Development • Determine dose and dosing interval • Identify homogeneous group • Biomarker for drug efficacy • Monitor gene or stem cell therapy
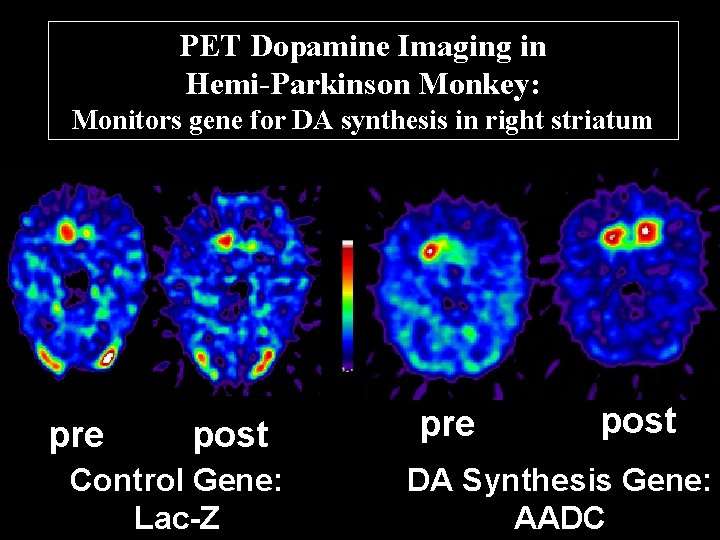
Gene Therapy Using Viral Vectors Viral vectors deliver gene that synthesizes dopamine (DA) Infuse virus into striatum (target cells) Target cells express the DA gene
PET Dopamine Imaging in Hemi-Parkinson Monkey: Monitors gene for DA synthesis in right striatum pre post Control Gene: Lac-Z pre post DA Synthesis Gene: AADC
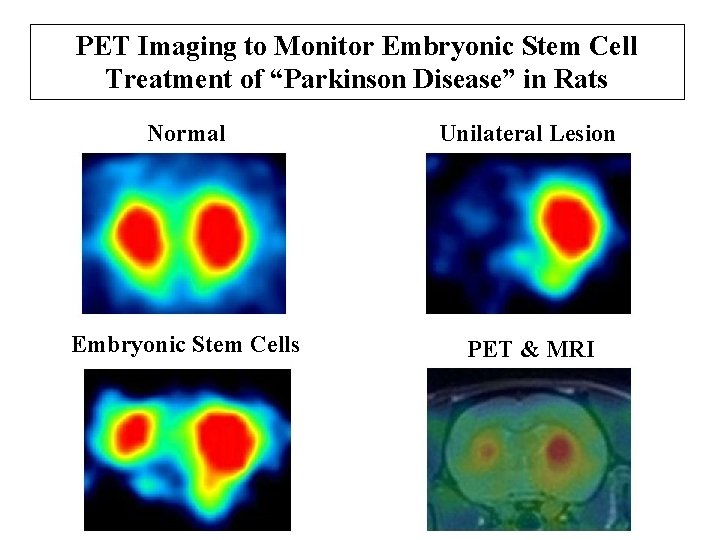
PET Imaging to Monitor Embryonic Stem Cell Treatment of “Parkinson Disease” in Rats Normal Unilateral Lesion Embryonic Stem Cells PET & MRI
Outline of Talk 1. PET has high sensitivity and specificity 2. PET used in therapeutic drug development 3. Pharmacokinetic modeling: plasma concentration and tissue uptake 4. Study drug distribution: “peripheral” benzodiazepine receptor 5. Study drug metabolism: inhibit defluorination
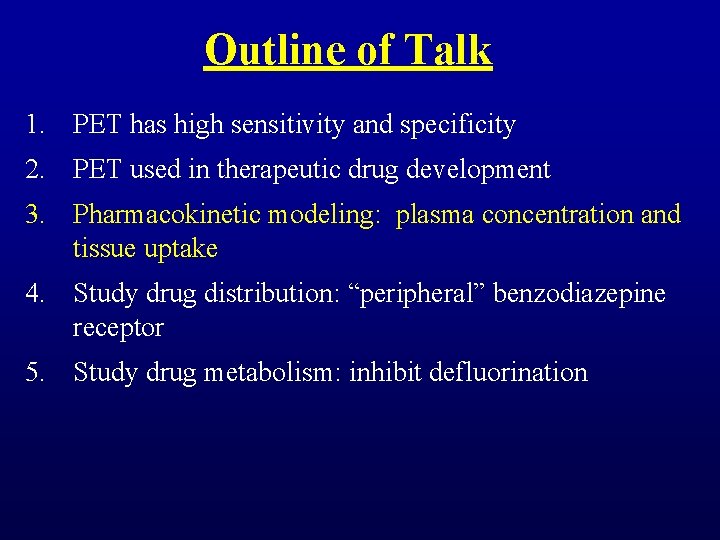
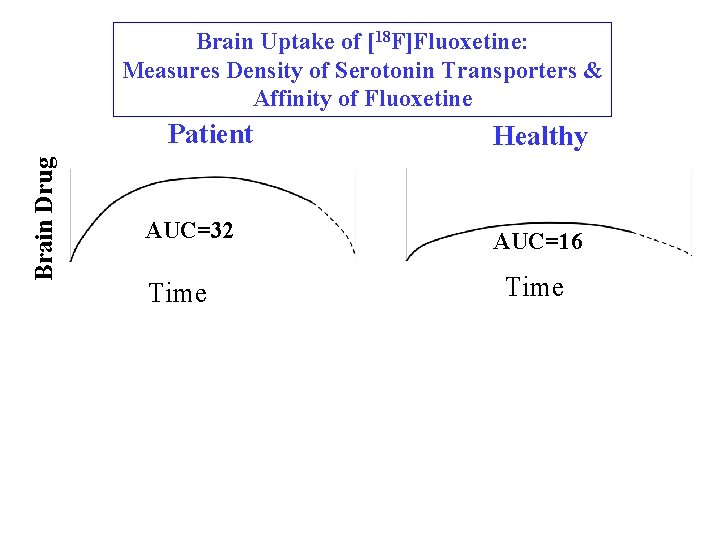
Brain Uptake of [18 F]Fluoxetine: Measures Density of Serotonin Transporters & Affinity of Fluoxetine Brain Drug Patient AUC=32 Time Healthy AUC=16 Time
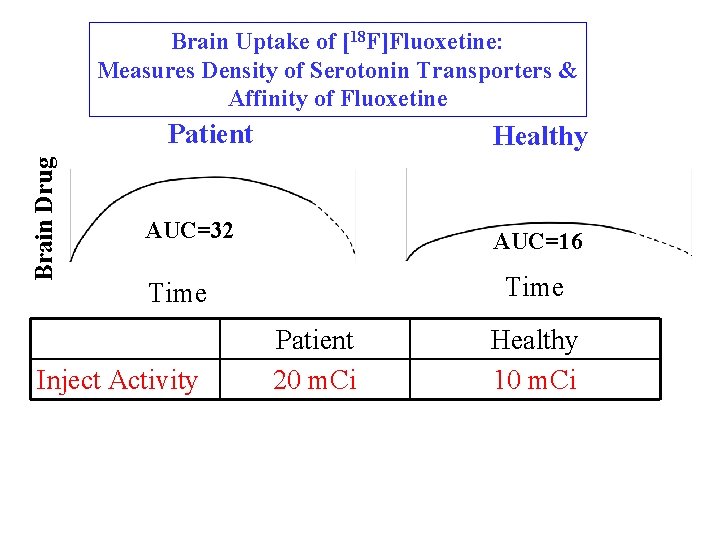
Brain Uptake of [18 F]Fluoxetine: Measures Density of Serotonin Transporters & Affinity of Fluoxetine Brain Drug Patient Healthy AUC=32 AUC=16 Time Inject Activity Patient 20 m. Ci Healthy 10 m. Ci
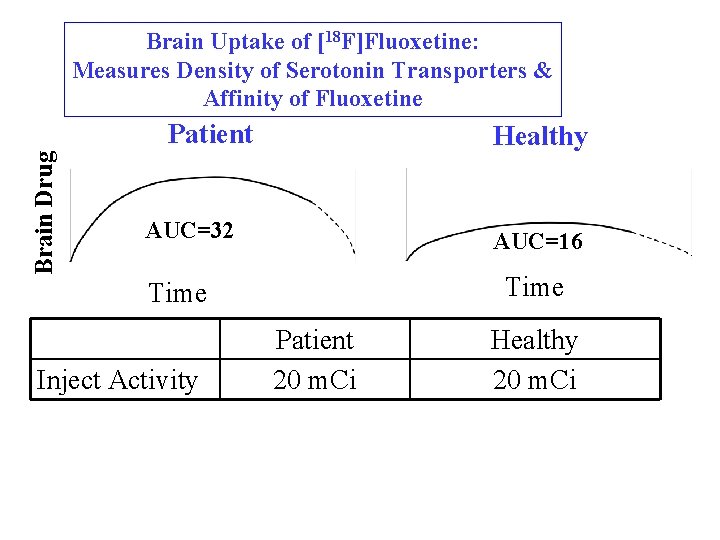
Brain Uptake of [18 F]Fluoxetine: Measures Density of Serotonin Transporters & Affinity of Fluoxetine Brain Drug Patient Healthy AUC=32 AUC=16 Time Inject Activity Patient 20 m. Ci Healthy 20 m. Ci
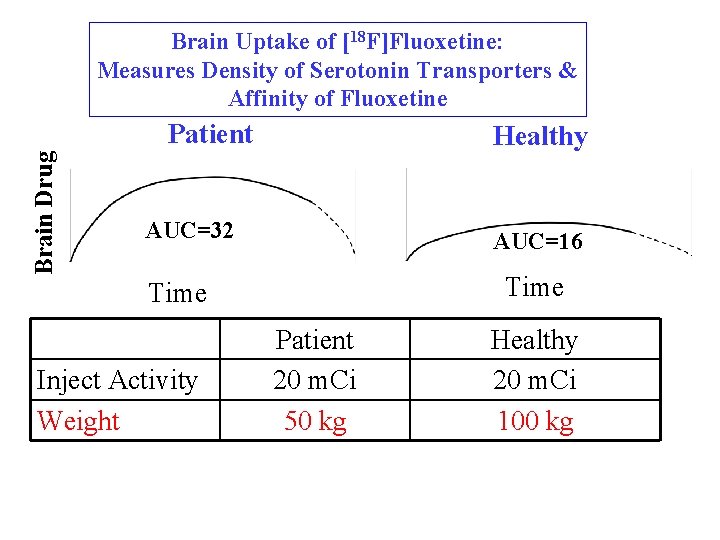
Brain Uptake of [18 F]Fluoxetine: Measures Density of Serotonin Transporters & Affinity of Fluoxetine Brain Drug Patient Healthy AUC=32 AUC=16 Time Inject Activity Weight Patient 20 m. Ci 50 kg Healthy 20 m. Ci 100 kg
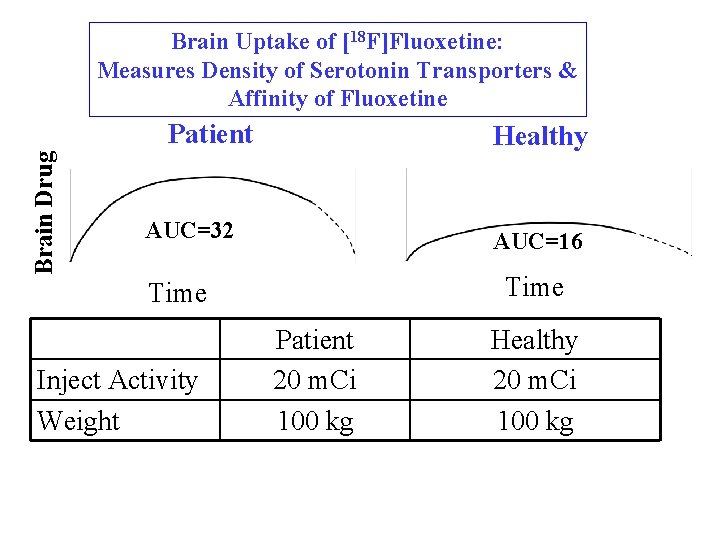
Brain Uptake of [18 F]Fluoxetine: Measures Density of Serotonin Transporters & Affinity of Fluoxetine Brain Drug Patient Healthy AUC=32 AUC=16 Time Inject Activity Weight Patient 20 m. Ci 100 kg Healthy 20 m. Ci 100 kg
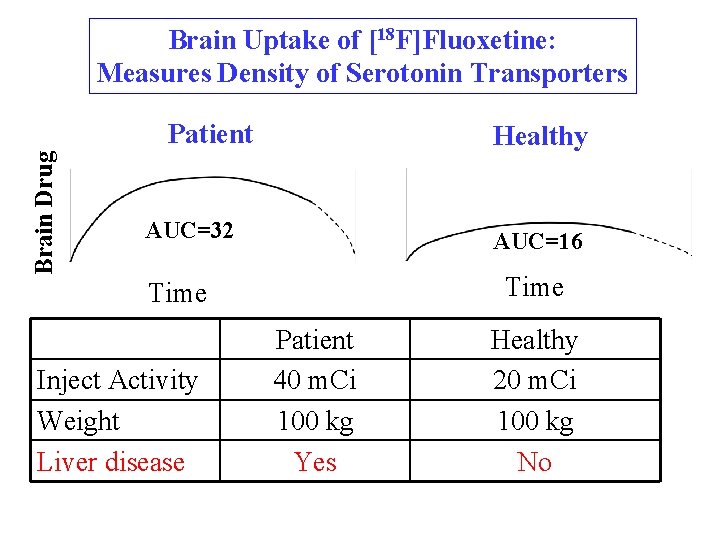
Brain Uptake of [18 F]Fluoxetine: Measures Density of Serotonin Transporters Brain Drug Patient Healthy AUC=32 AUC=16 Time Inject Activity Weight Liver disease Patient 40 m. Ci 100 kg Yes Healthy 20 m. Ci 100 kg No
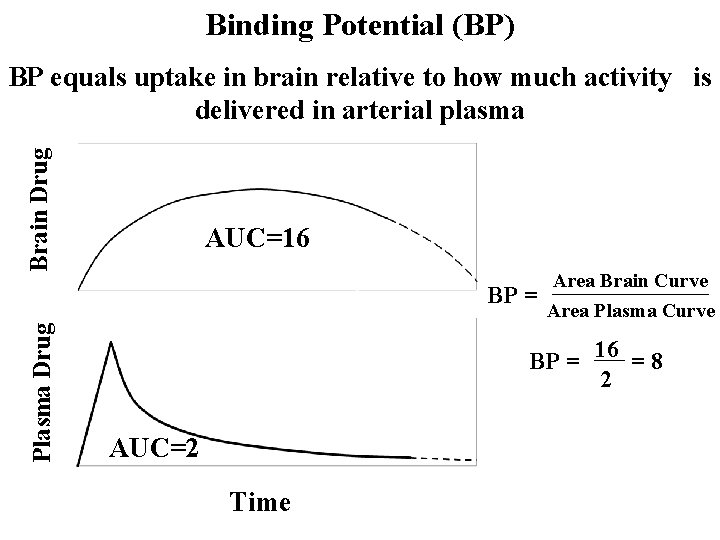
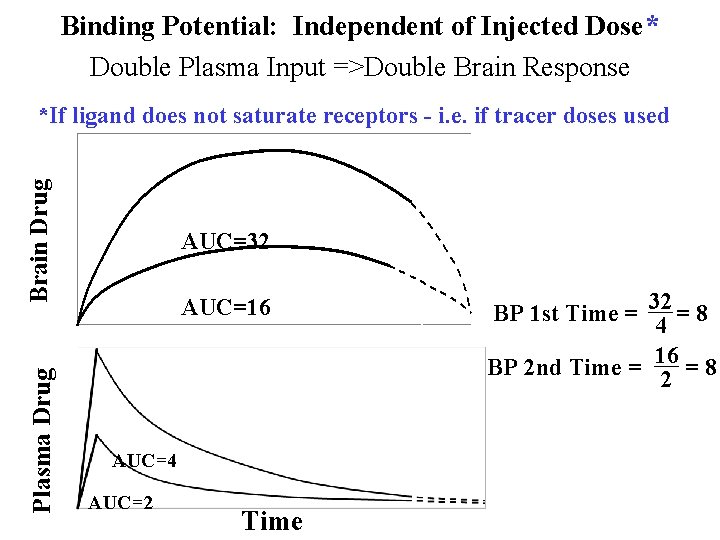
Binding Potential (BP) Brain Drug BP equals uptake in brain relative to how much activity is delivered in arterial plasma AUC=16 Plasma Drug BP = Area Brain Curve Area Plasma Curve BP = 16 = 8 2 AUC=2 Time
Binding Potential: Independent of Injected Dose* Double Plasma Input =>Double Brain Response Plasma Drug Brain Drug *If ligand does not saturate receptors - i. e. if tracer doses used AUC=32 AUC=16 AUC=4 AUC=2 Time BP 1 st Time = 32 4 =8 BP 2 nd Time = 16 2 =8
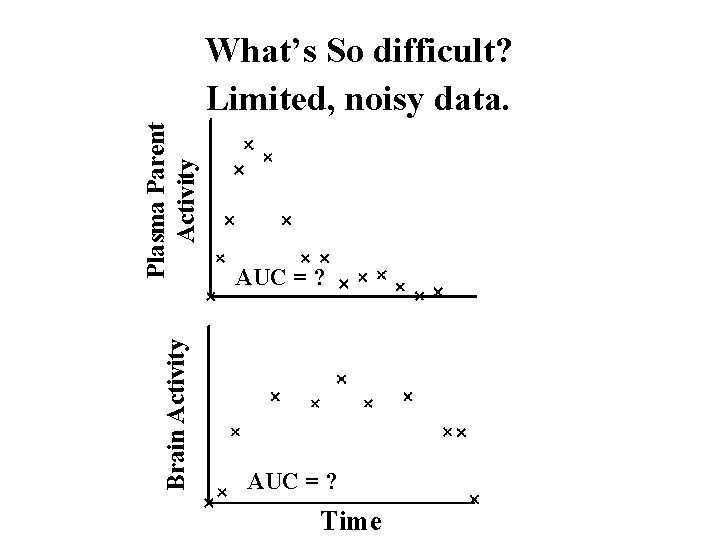
Brain Activity Plasma Parent Activity What’s So difficult? Limited, noisy data. AUC = ? Time
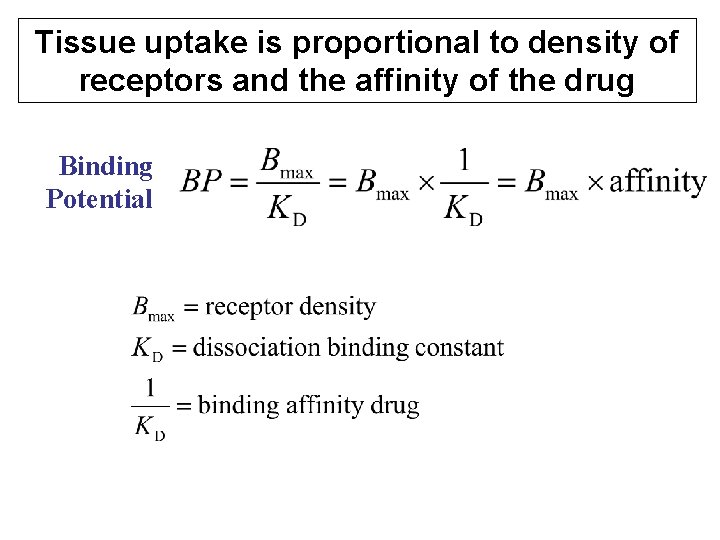
Tissue uptake is proportional to density of receptors and the affinity of the drug Binding Potential
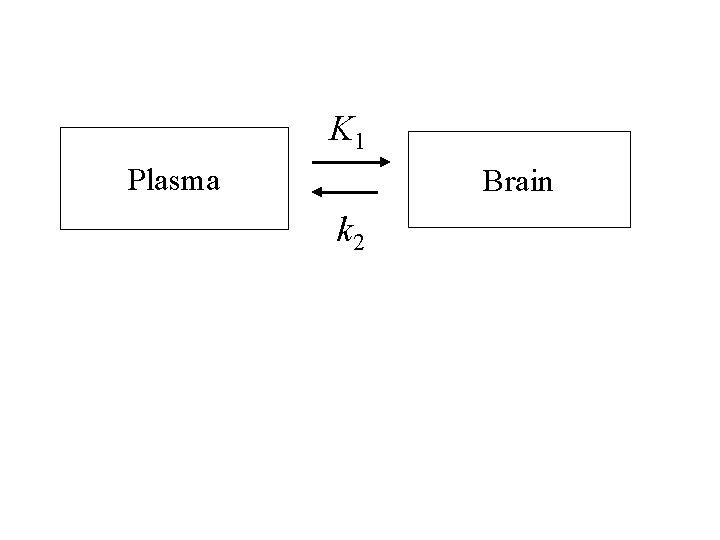
K 1 Plasma Brain k 2
Outline of Talk 1. PET has high sensitivity and specificity 2. PET used in therapeutic drug development 3. Pharmacokinetic modeling: plasma concentration and tissue uptake 4. Study drug distribution: “peripheral” benzodiazepine receptor 5. Study drug metabolism: inhibit defluorination
“Peripheral” Benzodiazepine Receptor 1. Mitochondrial protein highly expressed in macrophages and activated microglia 2. Exists in periphery and brain 3. Multiple potential functions: steroid synthesis, nucleotide transport 4. Distinct from typical benzodiazepine GABAA receptor in brain 5. Marker for cellular inflammation
Old and New PBR PET Ligands [11 C](R)-PK 11195 IC 50 = 0. 8 n. M* ; c. Log. P = 5. 3 [11 C]PBR 28 IC 50 = 0. 6 n. M* ; c. Log. P = 3. 0 New Ligand Aryloxyanilide Structure Higher specific receptor signal Lower lipophilicity
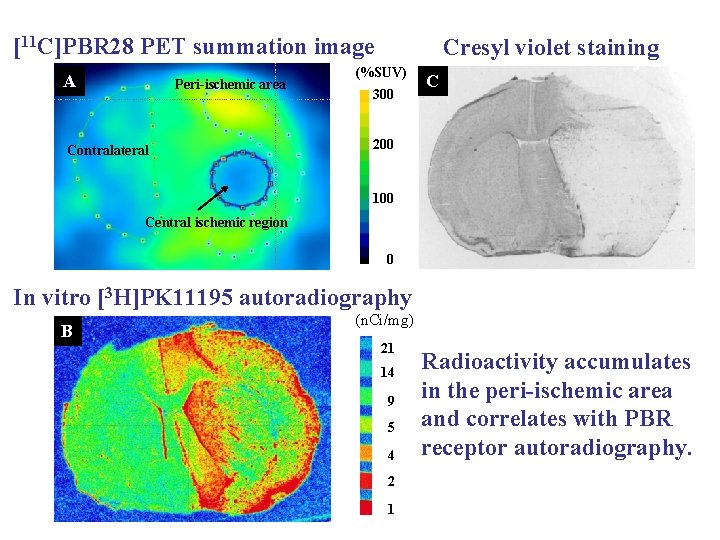
PBR Imaging in Cerebral Ischemia Cerebral ischemia (stroke) consists of a necrotic core surrounded by a penumbra with salvageable tissue. Penumbra accumulates a large number of activated microglia.
[11 C]PBR 28 PET summation image A Peri-ischemic area Contralateral Cresyl violet staining (%SUV) 300 C 200 100 Central ischemic region 0 In vitro [3 H]PK 11195 autoradiography B (n. Ci/mg) 21 14 9 5 4 2 1 Radioactivity accumulates in the peri-ischemic area and correlates with PBR receptor autoradiography.
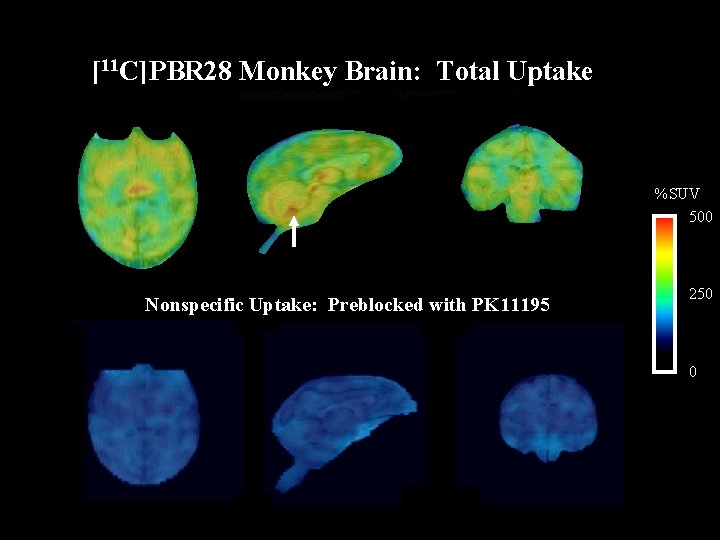
[11 C]PBR 28 Monkey Brain: Total Uptake %SUV 500 Nonspecific Uptake: Preblocked with PK 11195 250 0
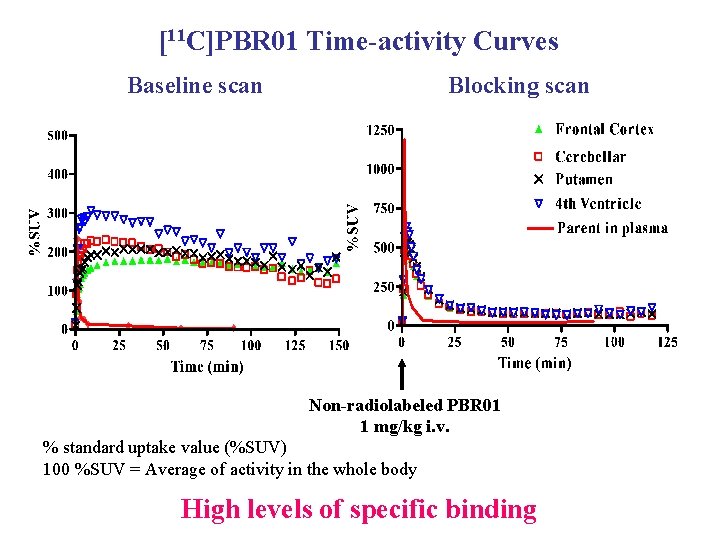
[11 C]PBR 01 Time-activity Curves Baseline scan Blocking scan Non-radiolabeled PBR 01 1 mg/kg i. v. % standard uptake value (%SUV) 100 %SUV = Average of activity in the whole body High levels of specific binding
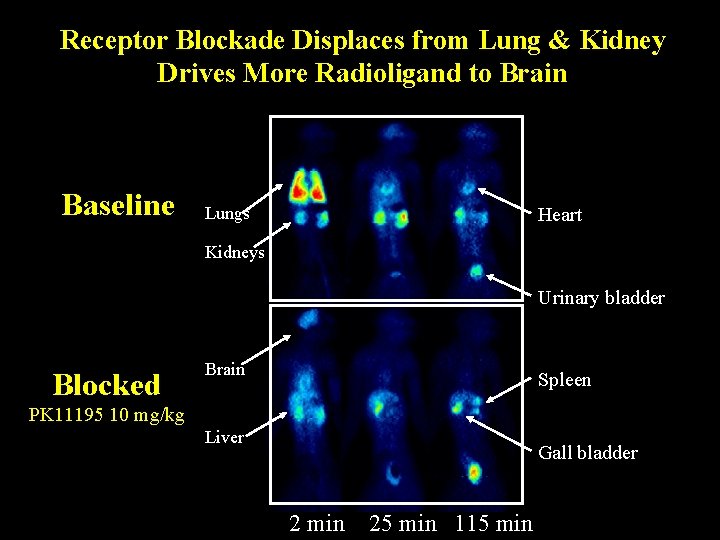
Receptor Blockade Displaces from Lung & Kidney Drives More Radioligand to Brain Baseline Lungs Heart Kidneys Urinary bladder Blocked Brain Spleen PK 11195 10 mg/kg Liver Gall bladder 2 min 25 min 115 min
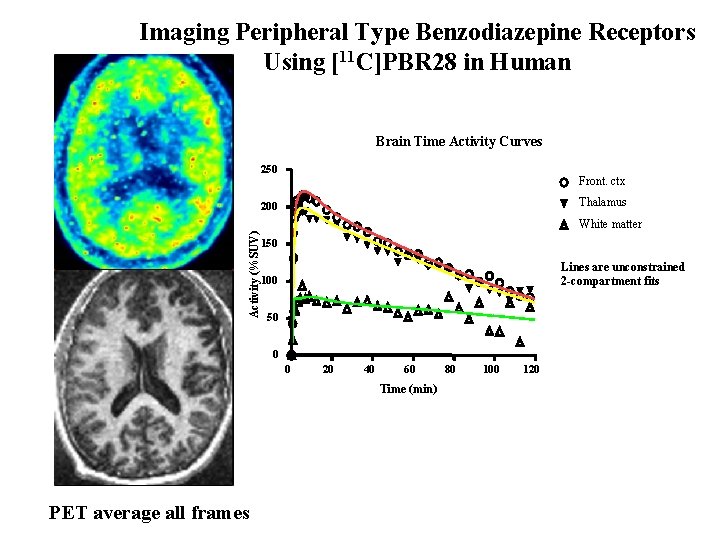
Imaging Peripheral Type Benzodiazepine Receptors Using [11 C]PBR 28 in Human Brain Time Activity Curves 250 Front. ctx Thalamus 200 Activity (%SUV) White matter 150 Lines are unconstrained 2 -compartment fits 100 50 0 0 20 40 60 Time (min) PET average all frames 80 100 120
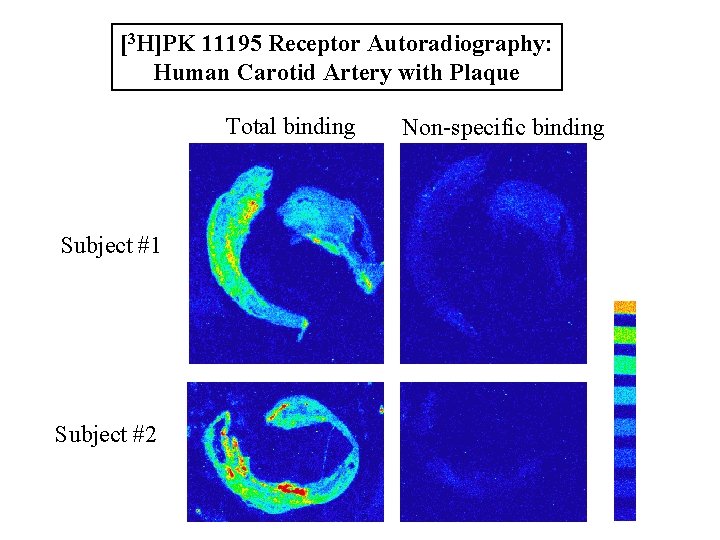
[3 H]PK 11195 Receptor Autoradiography: Human Carotid Artery with Plaque Total binding Subject #1 Subject #2 Non-specific binding
Outline of Talk 1. PET has high sensitivity and specificity 2. PET used in therapeutic drug development 3. Pharmacokinetic modeling: plasma concentration and tissue uptake 4. Study drug distribution: “peripheral” benzodiazepine receptor 5. Study drug metabolism: inhibit defluorination
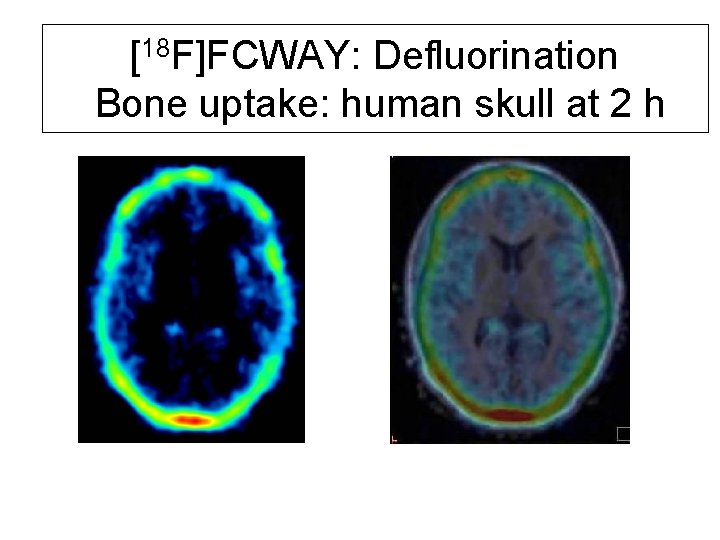
[18 F]FCWAY: Defluorination Bone uptake: human skull at 2 h
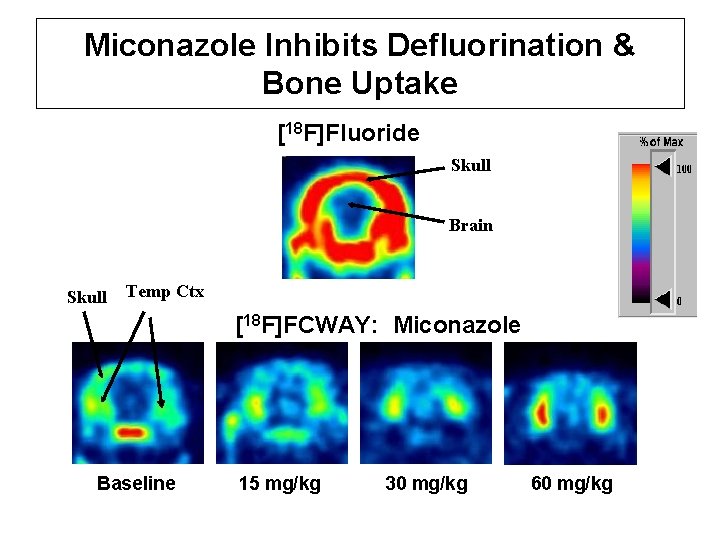
Miconazole Inhibits Defluorination & Bone Uptake [18 F]Fluoride Skull Brain Skull Temp Ctx [18 F]FCWAY: Miconazole Baseline 15 mg/kg 30 mg/kg 60 mg/kg
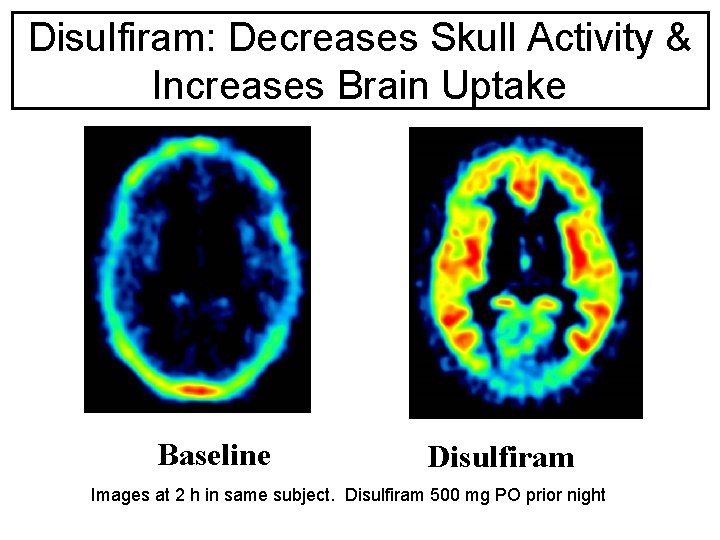
Disulfiram: Decreases Skull Activity & Increases Brain Uptake Baseline Disulfiram Images at 2 h in same subject. Disulfiram 500 mg PO prior night
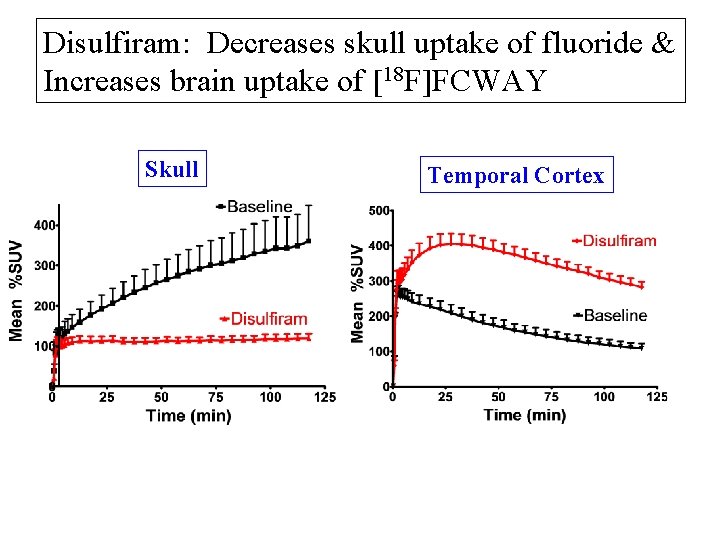
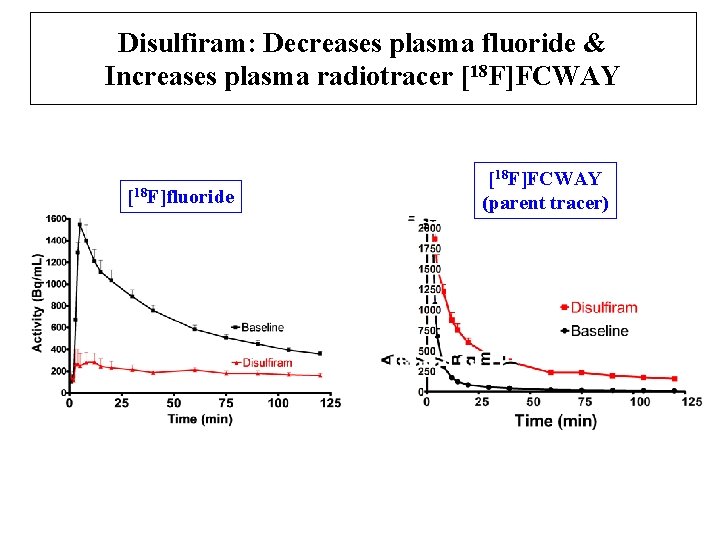
Disulfiram: Decreases skull uptake of fluoride & Increases brain uptake of [18 F]FCWAY Skull Temporal Cortex
Disulfiram: Decreases plasma fluoride & Increases plasma radiotracer [18 F]FCWAY [18 F]fluoride [18 F]FCWAY (parent tracer)
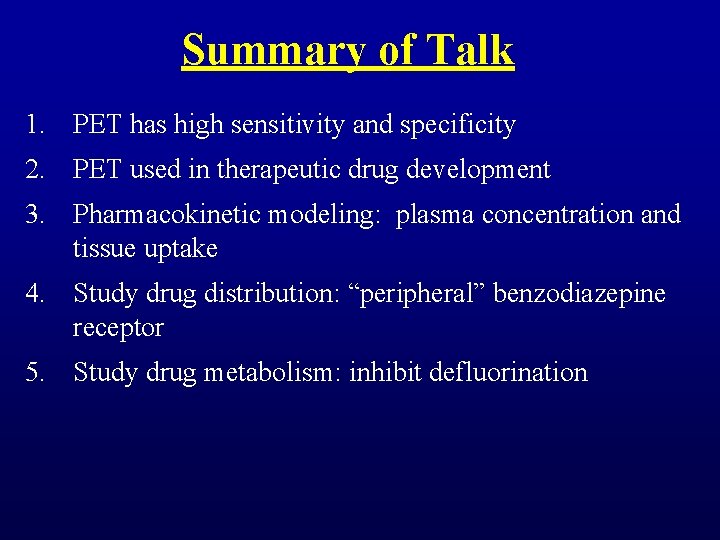
Summary of Talk 1. PET has high sensitivity and specificity 2. PET used in therapeutic drug development 3. Pharmacokinetic modeling: plasma concentration and tissue uptake 4. Study drug distribution: “peripheral” benzodiazepine receptor 5. Study drug metabolism: inhibit defluorination
Self-Assessment Quiz: True or False? • Positron emission tomography (PET) studies involve the injection of a radioactively labeled drug that emits a particle called a positron. • PET shows the location of radioactivity in a cross section (or tomograph) of the body. • PET can be used to quantify the density of specific proteins in the body. • Compartmental modeling of PET data typically uses measurements over time of 1) PET images of the target tissue and 2) concentrations of unchanged parent radioligand in plasma.