Position vs Time Graphs VS Velocity vs Time

 2) 3) 4) 5) 6) 7) 8) 9) 10) 3. 652 x 10")


")


 60")


- Slides: 18
Position vs Time Graphs VS Velocity vs Time Graphs
1) 2) 3) 4) 5) 6) 7) 8) 9) 10) 3. 652 x 10 -2 1. 472 x 107 3. 5 x 10 -5 1. 34 x 10 -4 2. 5 x 100 2. 5 x 10 -9 2. 43 x 102 4. 523 x 104 3. 5 x 10⁹ 2. 732 x 104 G Mg Dm Km Cm m. L n. L m. L c. L m Check RKS
Position vs. Time ANYTIME THE LINE IS HERE, Position vs. Time THE OBJECT IS ON THE POSITIVE SIDE OF THE ORIGIN 80 60 Position (m) 40 20 0 -60 ANYTIME THE LINE IS HERE, THE OBJECT IS ON THE NEGATIVE SIDE OF THE ORIGIN -80 Time (s) -20 -40 0 2 4 6 8 10 12 14 16 18
Position vs. Time 80 Line is approaching zero=position of object is approaching zero 60 Position (m) 40 20 0 0 2 4 6 8 10 -20 -40 -60 -80 Line is approaching zero=position of object is approaching zero Time (s) 12 14 16 18
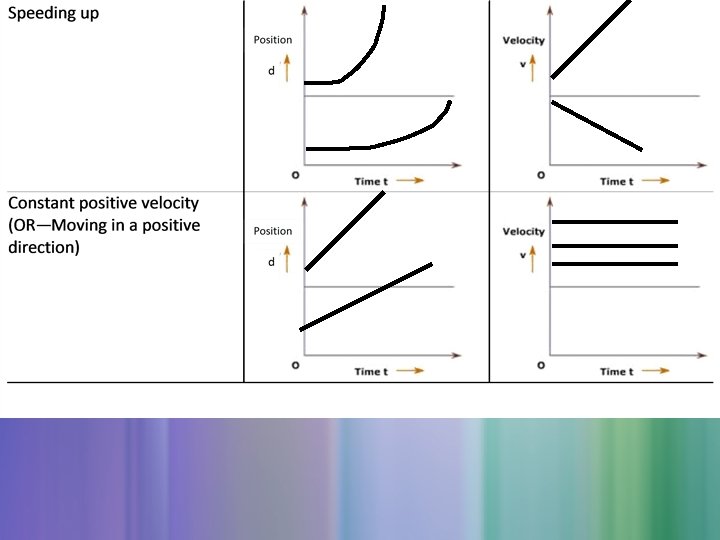
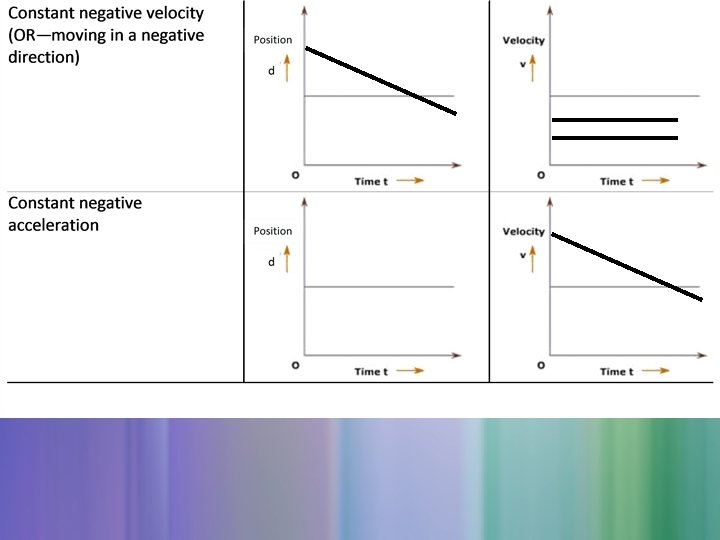
Position vs. Time 80 Velocity =∆d/∆t 60 Line is straight and negative =object is moving with constant velocity in negative direction Position (m) 40 20 0 0 2 4 6 8 10 -20 Velocity =∆d/∆t -40 Line is straight and positive =object is moving with constant velocity in positive direction Time (s) -60 -80 12 14 16 18
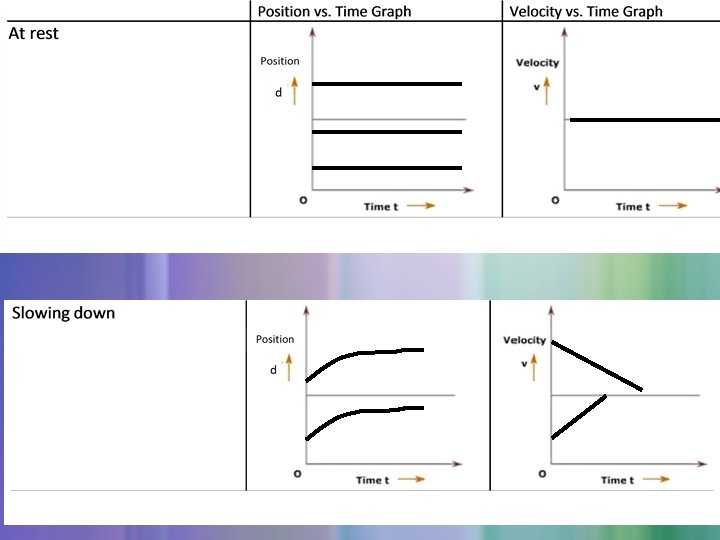
Position vs. Time 80 When line is horizontal= position isn’t changing (object at rest) 60 Position (m) 40 20 0 -20 -40 -60 -80 0 5 10 15 When line is horizontal= position isn’t changing (object at rest) Time (s)
Position vs. Time When line is curved= position isn’t changing at the same rate, so velocity is non-constant and object is accelerating 80 60 Position (m) 40 20 0 -20 -40 -60 -80 0 2 4 6 8 10 When line is curved= position isn’t changing at the same rate, so velocity is non-constant and Time (s) object is accelerating 12 14 16 18
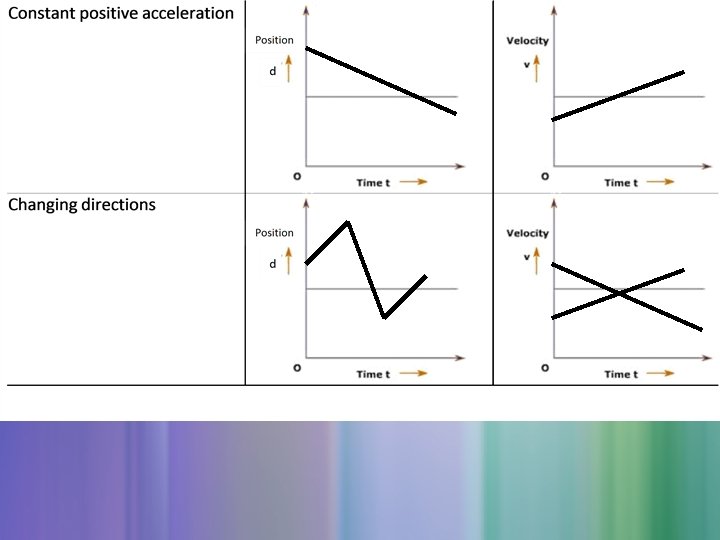
Pause: What should be in my notes now? • Position vs time graph: – Slope= velocity = ∆d/∆t • Positive slope=velocity is in the positive direction • Negative slope=velocity is in the negative direction – Position of line: • When line is in the positive part of the graph = object is on the positive side of the origin • When line is in the negative part of the graph = object is on the negative side of the origin • When line approaches zero = object is getting closer to origin • When line is at zero = object at origin – Straight line = constant velocity – Curved line = non-constant velocity and object is accelerating
Velocity vs. Time ANYTIME THE LINE IS HERE, THE Position vs. Time OBJECT HAS POSITIVE VELOCITY AND THE OBJECT IS MOVING IN A POSITIVE DIRECTION 80 60 Velocity (m/s) 40 20 0 -20 -40 -60 -80 0 ANYTIME THE LINE IS HERE, THE OBJECT HAS NEGATIVE VELOCITY AND THE OBJECT IS MOVING IN A NEGATIVE DIRECTION Time (s) 2 4 6 8 10 12 14 16 18
Velocity vs. Time 80 Line is approaching zero = Velocity of object is approaching zero (slowing down) 60 Velocity (m/s) 40 20 0 -20 -40 -60 -80 0 2 4 6 8 10 Line is approaching zero = Velocity of object is approaching zero (slowing down) Time (s) 12 14 16 18
Velocity vs. Time 80 acceleration=∆v/∆t 60 Line is straight and negative =velocity is changing at constant rate (acceleration is constant) Velocity (m/s) 40 20 0 -20 -40 -60 -80 0 2 4 6 8 10 12 acceleration=∆v/∆t Line is straight and positive =velocity is changing at constant rate (acceleration is constant) Time (s) 14 16 18
Velocity vs. Time 80 When line is horizontal= Velocity isn’t changing (no acceleration) 60 Velocity (m/s) 40 20 0 -20 -40 -60 -80 0 5 10 15 When line is horizontal= Velocity isn’t changing (no acceleration) Time (s)
Velocity vs. Time When line is curved= Velocity isn’t changing at the same rate, so acceleration is non-constant 80 60 Velocity (m/s) 40 20 0 -20 -40 -60 -80 0 2 4 6 8 10 When line is curved= Velocity isn’t changing at the same rate, so acceleration. Time is (s) non-constant 12 14 16 18
Pause: What should be in my notes now? • Velocity vs time graph: – Slope= acceleration= ∆v/∆t • Positive slope= acceleration is in the same direction as velocity • Negative slope= acceleration is in opposite direction as velocity – When line is in the positive part of the graph = object has positive velocity (moving in positive direction) – Position of line: • When line is in the negative part of the graph = object has negative velocity (moving in negative direction) • When line approaches zero = velocity is getting closer to origin (slowing down) • When line is at zero = velocity is 0, object at rest – Straight line = constant acceleration – Curved line = non-constant acceleration – Line is horizontal = velocity is constant