Position Speed and Velocity Position is a variable

Position, Speed and Velocity • Position is a variable that gives your location relative to an origin. • The origin is the place where position equals 0. The position of this car at 50 cm describes where the car is relative to the track.

• Position and distance are similar but not the same. Distance is the amount of space between two points. • If the car moves a distance of 20 cm to the right, its new position will be 70 cm from its origin. Distance = 20 cm New position

• The variable speed describes how quickly something moves. • To calculate the speed of a moving object divide the distance it moves by the time it takes to move.

Solving Problems How far do you go if you drive for two hours at a speed of 100 km/h? 1. Looking for: • …distance Given: 2. • …speed = 100 km/h time = 2 h Relationships: 3. • d = vt Solution: 4. • d = 100 km/h x 2 h =

PAGE 80 • Do YOUR TURN • Show your work

Average speed • When you divide the total distance of a trip by the time taken you get the average speed. • In this example, the car traveled and average of 100 km/h.

Velocity • Velocity is a The difference between variable that tells speed and velocity is that you both speed can only have a positive value or zero but and direction velocity can be shown as a positive or negative number. The positive or negative sign will indicate if the object is moving forward or backward.

Solving Problems A train travels at 100 km/h heading east to reach a town in four hours. The train then reverses and heads west at 50 km/h for 4 hours. What is the train’s position now? You are given two velocities and times 2. Change in position = velocity x time 3. First change in position (+100 km/h) x (4 h) = +400 km/h Second change in position (-50 km/h ) x (4 h) = -200 The final position is (+400 km/h) + (-200 km) = +200 km Thus the train is 200 km from where it started. 1.

PAGE 85 • Do Your Turn • Show your work

Page 86 • Answers only • Numbers 1, 3, 5 EXIT SLIP How do velocity and speed differ? • Answers only and on the same piece of paper – turn in when done

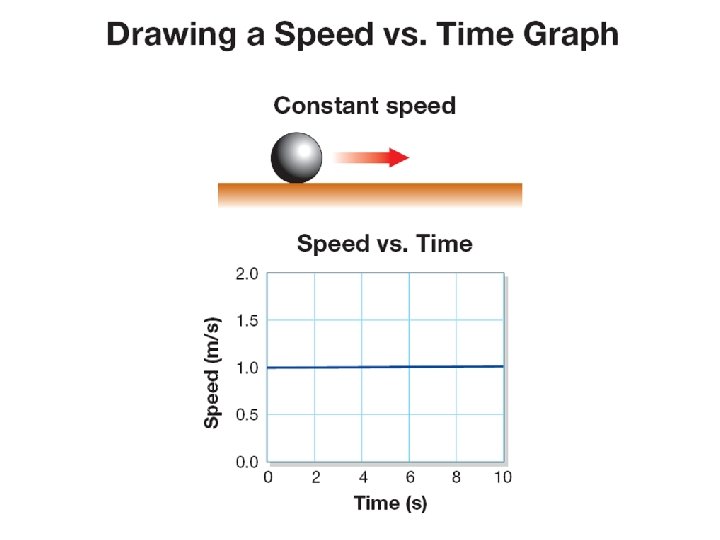
4. 2 Graphs of Motion • • • Constant speed means the speed stays the same. An object moving at a constant speed always creates a graph that is a straight line. On a graph TIME WILL ALWAYS GO ON THE X AXIS

4. 2 Graphs of Motion • • This data shows a runner took 10 seconds to run each 50 -meter segment. Because the time was the same for each segment, you know the speed was the same for each segment.

4. 2 Graphs of Motion • • You can use position vs. time graphs to compare the motion of different objects. The steeper line on a position vs. time graph means a faster speed.

4. 2 Graphs of changing motion • • Objects rarely move at the same speed for a long period of time. A speed vs. time graph is also useful for showing the motion of an object that is speeding up or slowing down.
")
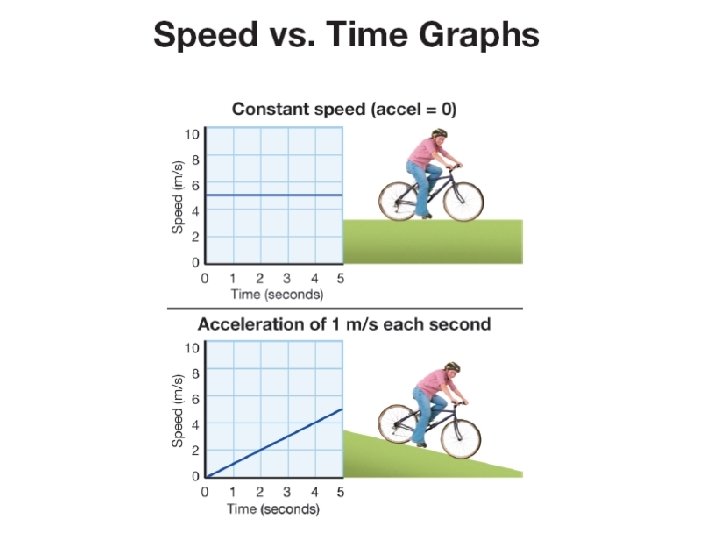
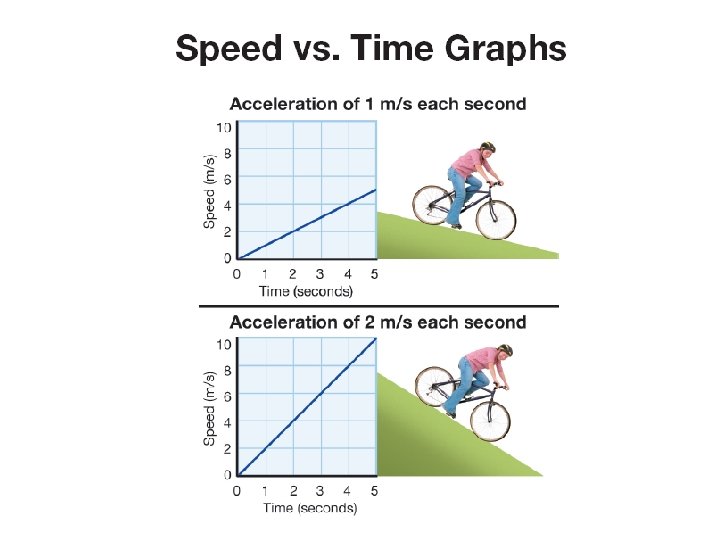
4. 3 Acceleration • Acceleration is the rate at which your speed (or velocity) changes; an object accelerates if its speed, DIRECTION or both changes. • The word “acceleration” is used for any change in speed, up or down. • Acceleration can be positive or negative.

Acceleration causes the line to slope up on a speed vs. time graph. There is zero acceleration at constant speed because the speed does not change.

4. 3 Acceleration • Speed and acceleration are not the same thing. • You can be moving (non-zero speed) and have no acceleration (think cruise control). • You can also be accelerating and not moving! • A falling object begins accelerating the instant it is released.

• Acceleration describes how quickly speed changes. • Acceleration is the change in speed divided by the change in time.

The units for time in acceleration are often expressed as “seconds squared” and written as s 2

Solving Problems • A sailboat moves at 1 m/s. • A strong wind increases its speed to 4 m/s in 3 s. • Calculate acceleration.

Solving Problems 1. • 2. • 3. • 4. • Looking for: …acceleration of sailboat Given: …v 1 = 1 m/s; v 2 = 4 m/s; time = 3 s Relationships: a = v 2 – v 1/t Solution: a = (4 m/s – 1 m/s)/ 3 s

4. 3 Acceleration on position-time graphs • The position vs. time graph is a curve when there is acceleration. • The car covers more distance each second, so the position vs. time graph gets steeper each second.

4. 3 Acceleration on position-time graphs • When a car is slowing down, the speed decreases so the car covers less distance each second. • The position vs. time graph gets shallower with time.

4. 3 Free fall • An object is in free fall if it is accelerating due to the force of gravity and no other forces are acting on it.

4. 3 Free fall • Falling objects increase their speed by 9. 8 m/s every second, or 9. 8 m/s 2 ØThe letter “g” is used for acceleration due to gravity.
- Slides: 28