Portfolio Management Performance Evaluation One period returns Gross


 Average mean • (Observed) Geometric mean")


 M M 2 P* P rf σP")


 TQ Q SML P E(r. M) rf M Slope(SML)=TM=E(r. M)-")


- Slides: 39
Portfolio Management Performance Evaluation
One period returns • Gross return • Net return
Average Returns • Arithmetic Mean • Geometric Mean
Example Period Price 0 1 2 50 53 54 Dividen d 2 2
Example • Arithmetic Mean • Geometric Mean
Arithmetic vs Geometric • Past Performance - generally the geometric mean is preferable to arithmetic • Predicting Future Returns- generally the arithmetic average is preferable to geometric
Example • A stock price doubles or halves • Same probability • We observe Period 0 1 2 Price 10 20 10
Example • (True) Average mean • (Observed) Geometric mean
Example Period 0 1 2 Price 10 20 10 Return 0 100% -50% Time weighted return = arithmetic average return (100 -50) = 25%
Example Period Price 0 1 2 10 20 10 Number of shares bought 100 -200 Dollar weighted return = Internal Rate of Return
Measuring Returns Dollar-weighted returns • Internal rate of return considering the cash flow from or to investment • Returns are weighted by the amount invested in each stock Time-weighted returns • Not weighted by investment amount • Equal weighting
Adjusting for risk • Mean returns are not enough and one must also adjust for risk • Find the appropriate comparison universe • Mean-variance risk adjustments
The Sharpe Ratio • Sharpe’s measure: expected excess return per unit of risk (measured as total volatility) • Apropriate scenario: Evaluate a portfolio which represents the entire investor’s initial wealth • Slope of the CAL
The Sharpe Ratio and M 2 • Equates the volatility of the managed portfolio with the market by creating a hypothetical portfolio made up of T-bills and the managed portfolio • If the risk is lower than the market, leverage is used and • The hypothetical portfolio is compared to the market
The Sharpe Ratio and M 2 • Find the value where a is the value for which • Then:
The Sharpe Ratio and M 2 E(r) M M 2 P* P rf σP σM
Jensen’s alpha & AP • Jensen’s measure: the expected return of the portfolio above its CAPM counterpart • The appraisal ratio: alpha divided by the portfolio’s nonsystematic risk
Jensen’s alpha & AP • The AP is used in situations where the portfolio to be evaluated will be mixed with the market • Why? For the optimal mix, the complete portfolio’s sharpe ratio is • It measures improvement in the Sharpe ratio
Treynor’s measure • Treynor’s measure: excess expected return per unit of systematic risk (measured as beta) • Appropriate when the portfolio is part of a large investment portfolio • The slope of the T-line
Treynor’s measure TP E(r) TQ Q SML P E(r. M) rf M Slope(SML)=TM=E(r. M)- rf b. P b. M= 1. 0 b
Some Issues • Assumptions underlying measures limit their usefulness – Constant distributions – Preferences • When the portfolio is being actively managed, basic stability requirements are not met – An example: market timing
Market Timing • Adjusting portfolio for up and down movements in the market – Low Market Return - low ßeta – High Market Return - high ßeta • Regression:
An Example of Market Timing rp - rf * * * * ** * * Steadily Increasing the Beta rm - rf
Market Timing • A simple alternative: – Beta is large if the market does well – Beta is small otherwise • Regression
Market timing rp - rf *** ** ***** * * * ** * * the Beta takes only two values rm - rf
Performance Attribution • Decomposing overall performance into components • Components are related to specific elements of performance • Example components – Broad Allocation – Industry – Security Choice
Performance Attribution • Set up a ‘Benchmark’ or ‘Bogey’ portfolio – Use indexes for each component: depends on the asset class – Use target weight structure: neutral, depend on preferences of the client • BKM give the example: – 10% cash, 15% bonds and 75% equity for risk -tolerant client. – 45% cash, 20% bonds and 35% equity for risk -averse.
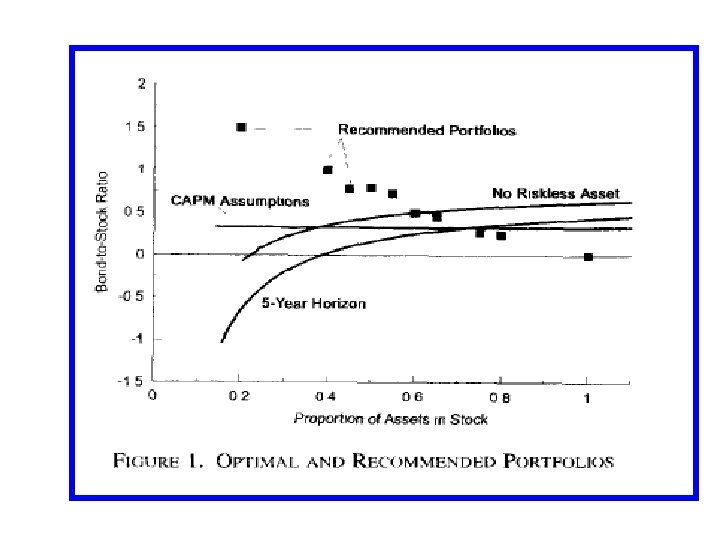
A question • The bond-to-equity ratio is – 15/75 = 0. 2 (low risk aversion) – 20/35 = 0. 57 (high risk aversion) • If cash is riskless, does it make sense according to standard assumptions?
Asset allocation puzzle • Canner, Mankiew and Weil: ”Popular financial advisors appear not to follow the mutual-fund separation theorem. When these advisors are asked to allocate portfolios among stocks, bonds, and cash, they recommend more complicated strategies than indicated by theorem” • And so do BKM!!!!
Performance Attribution • Calculate the return on the ‘Bogey’ and on the managed portfolio • Explain the difference in return based on component weights or selection • Summarize the performance differences into appropriate categories
Performance Attribution Asset Allocation Security Selection
Performance Attribution Contribution for asset allocation r. Bi + Contribution for security selection r. Bi) (wpi - w. Bi) wpi (rpi - = Total Contribution from asset class wpirpi w. Bir. Bi
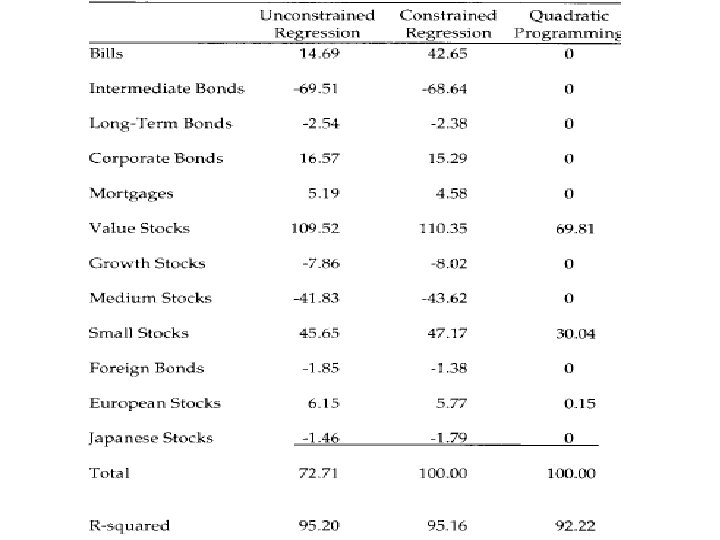
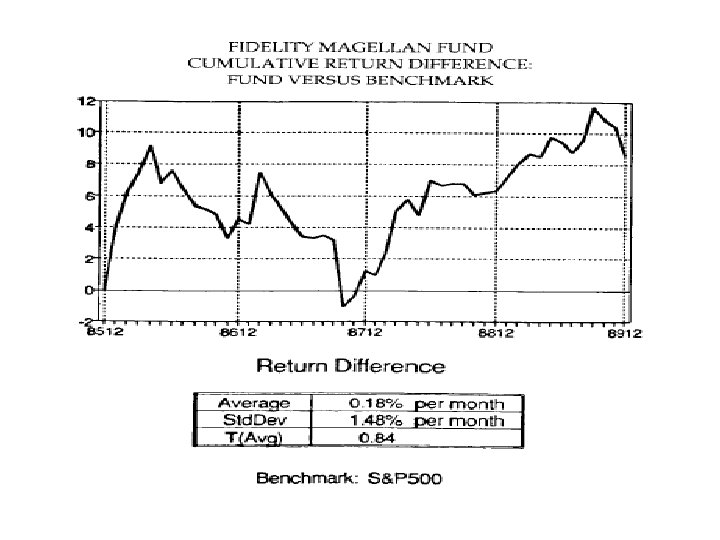
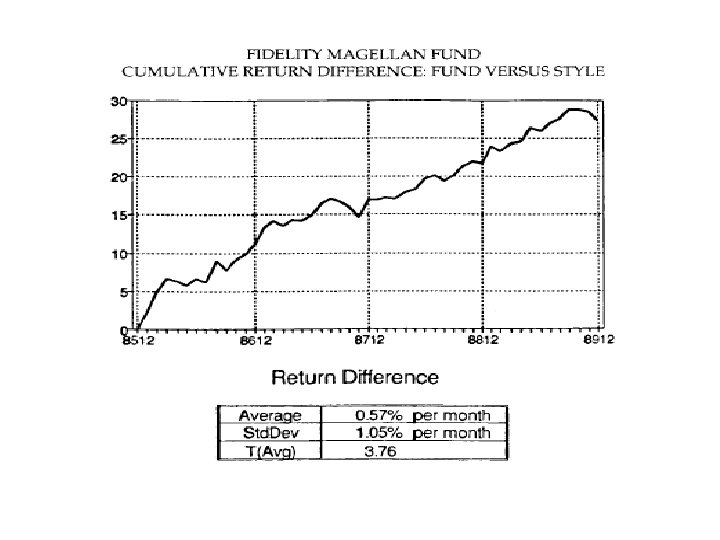
Style analysis • Regress the returns under evaluation on a sufficiently representative set of asset classes • This allows identification of the capital allocation decision • The proportion not explained: security selection
Style analysis • Magellan Fund – Growth stocks 47% – Medium cap 31% – Small stocks 18% – European stocks 4%
Some Complications • Two major problems – Need many observations even when portfolio mean and variance are constant – Active management leads to shifts in parameters making measurement more difficult • To measure well – You need a lot of short intervals – For each period you need to specify the makeup of the portfolio