
Portfolio Committee on Basic Education Meeting REPORT OF
Portfolio Committee on Basic Education Meeting REPORT OF THE HIGH LEVEL PANEL (HLP) ON THE ASSESSMENT OF KEY LEGISLATION AND THE ACCELERATION OF FUNDAMENTAL CHANGE 30 October 2018
PRESENTATION OUTLINE 1. 2. 3. 4. 5. 6. 7. 8. 9. 10. 11. Purpose A system on the rise National Assessments Skills Development Teaching of Reading E-Learning / Operation Phakisa/ Skills for a Changing world/ 4 IR Early Childhood Development Programmes (ECD) School Management and Governance Resourcing Returns on investments in education Recommendation 2
PURPOSE To present to the Portfolio Committee progress on the recommendations of the Report of the High Level Panel on the Assessment of Key Legislation and the Acceleration of Fundamental Change in respect of access to quality education. 3
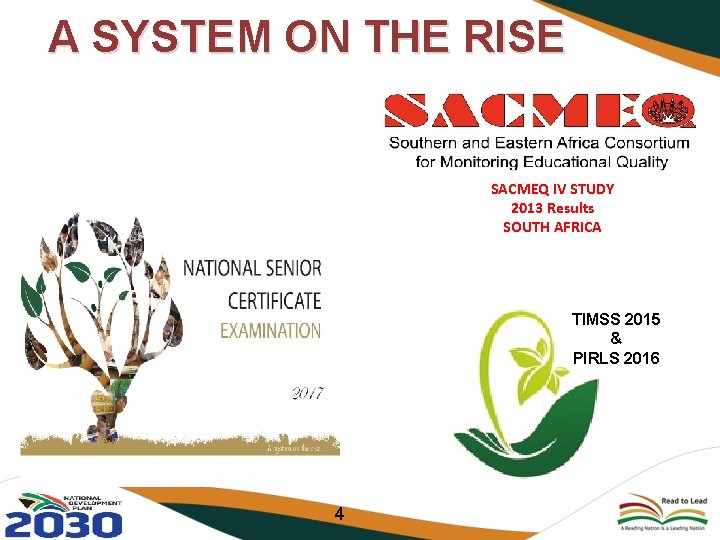
A SYSTEM ON THE RISE SACMEQ IV STUDY 2013 Results SOUTH AFRICA TIMSS 2015 & PIRLS 2016 4
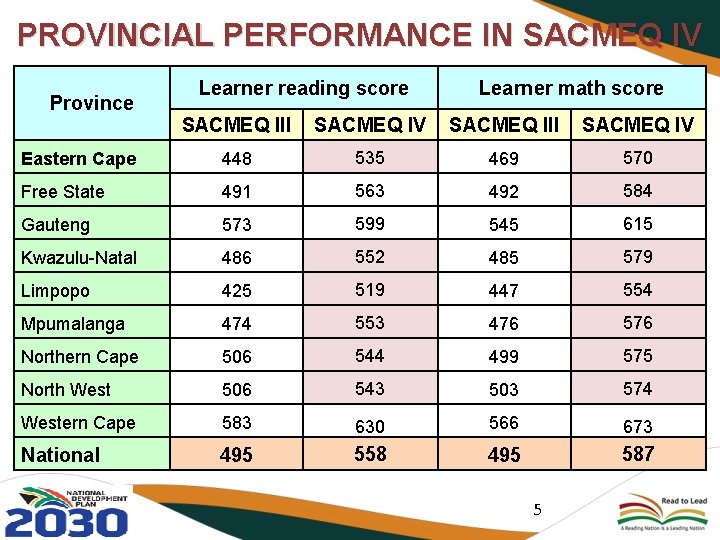
PROVINCIAL PERFORMANCE IN SACMEQ IV Province Learner reading score Learner math score SACMEQ III SACMEQ IV Eastern Cape 448 535 469 570 Free State 491 563 492 584 Gauteng 573 599 545 615 Kwazulu-Natal 486 552 485 579 Limpopo 425 519 447 554 Mpumalanga 474 553 476 576 Northern Cape 506 544 499 575 North West 506 543 503 574 Western Cape 583 630 566 673 National 495 558 495 587 5
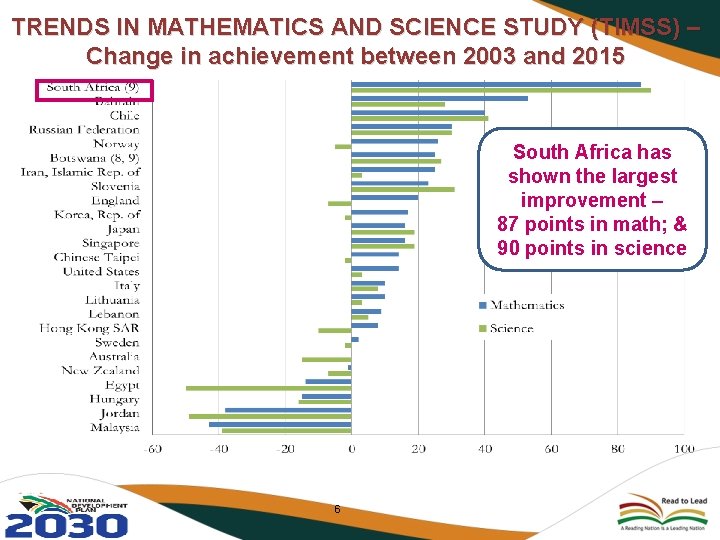
TRENDS IN MATHEMATICS AND SCIENCE STUDY (TIMSS) – Change in achievement between 2003 and 2015 South Africa has shown the largest improvement – 87 points in math; & 90 points in science 6
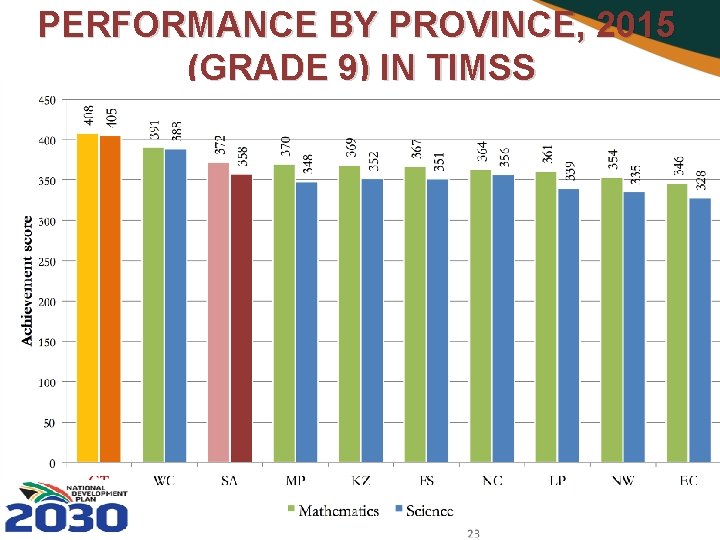
PERFORMANCE BY PROVINCE, 2015 (GRADE 9) IN TIMSS
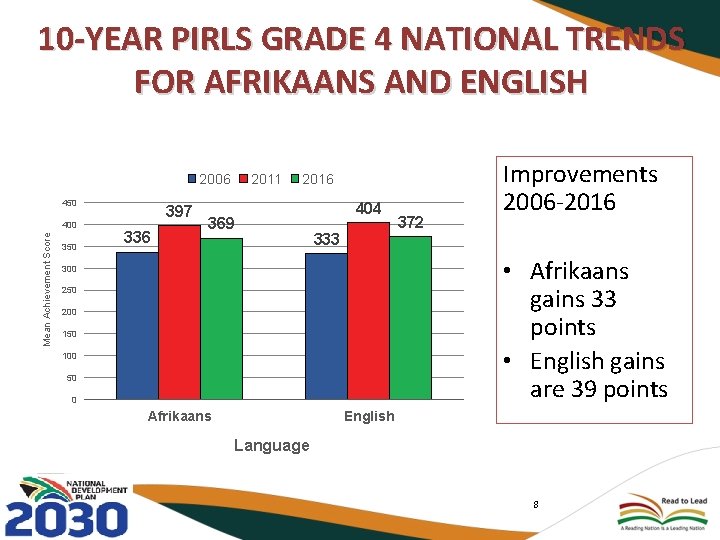
10 -YEAR PIRLS GRADE 4 NATIONAL TRENDS FOR AFRIKAANS AND ENGLISH 2006 450 Mean Achievement Score 400 350 397 336 2011 2016 369 404 333 372 Improvements 2006 -2016 • Afrikaans gains 33 points • English gains are 39 points 300 250 200 150 100 50 0 Afrikaans English Language 8
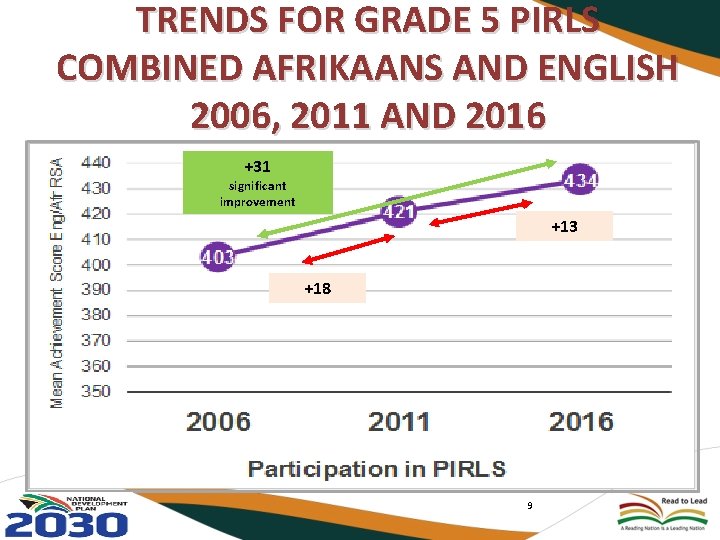
TRENDS FOR GRADE 5 PIRLS COMBINED AFRIKAANS AND ENGLISH 2006, 2011 AND 2016 +31 significant improvement +13 +18 9
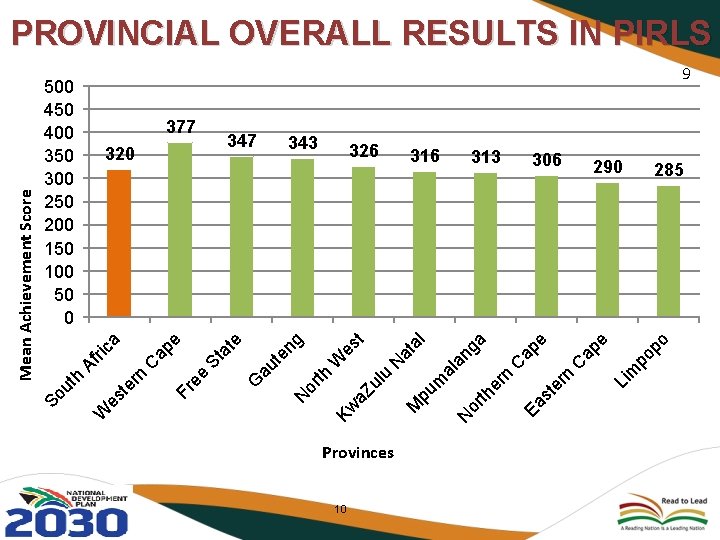
10 Provinces po po ap e C 306 Li m n te r C ap e 313 Ea s an ga 316 er n or th N 326 al pu m at al N es t W 343 M lu a. Z u Kw 347 or th ng 320 N at e St 377 G au te e C ap e ca Af ri 500 450 400 350 300 250 200 150 100 50 0 Fr e te rn es W ut h So Mean Achievement Score PROVINCIAL OVERALL RESULTS IN PIRLS 9 290 285 10
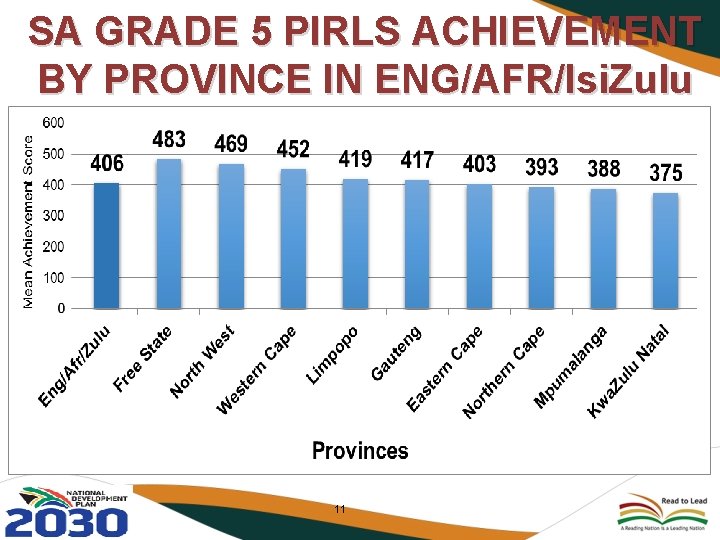
SA GRADE 5 PIRLS ACHIEVEMENT BY PROVINCE IN ENG/AFR/Isi. Zulu 11
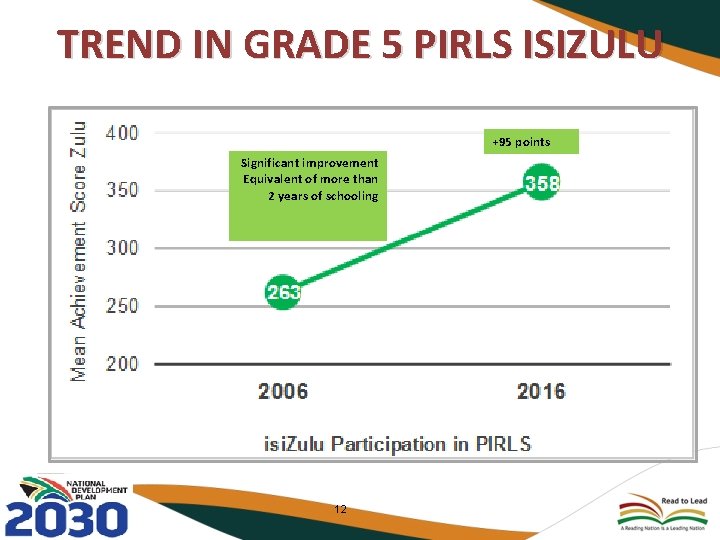
TREND IN GRADE 5 PIRLS ISIZULU +95 points Significant improvement Equivalent of more than 2 years of schooling 12
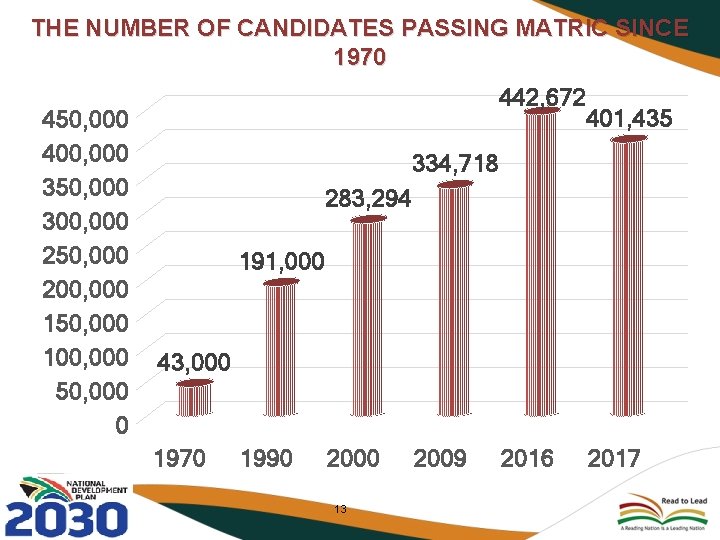
THE NUMBER OF CANDIDATES PASSING MATRIC SINCE 1970 450, 000 400, 000 350, 000 300, 000 250, 000 200, 000 150, 000 100, 000 50, 000 0 442, 672 401, 435 334, 718 283, 294 191, 000 43, 000 1970 1990 2000 13 2009 2016 2017
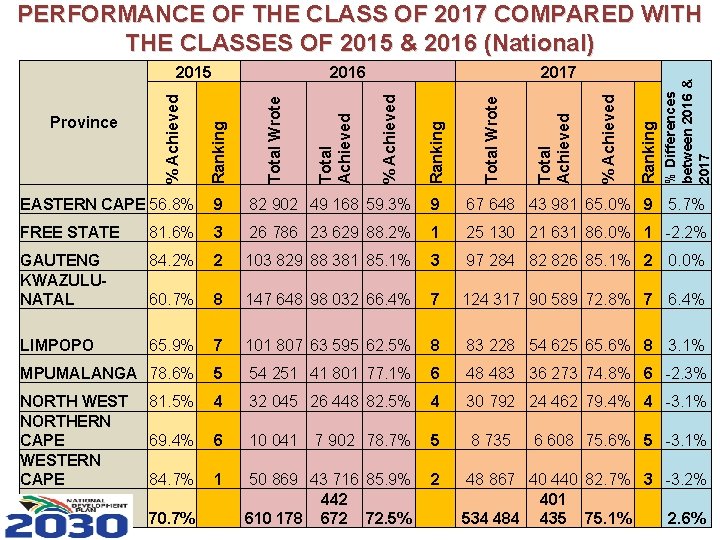
Ranking % Achieved Total Wrote Ranking 2017 % Achieved Total Wrote 2016 Ranking Province % Achieved 2015 % Differences between 2016 & 2017 PERFORMANCE OF THE CLASS OF 2017 COMPARED WITH THE CLASSES OF 2015 & 2016 (National) EASTERN CAPE 56. 8% 9 82 902 49 168 59. 3% 9 67 648 43 981 65. 0% 9 5. 7% FREE STATE 81. 6% 3 26 786 23 629 88. 2% 1 25 130 21 631 86. 0% 1 -2. 2% GAUTENG KWAZULUNATAL 84. 2% 2 103 829 88 381 85. 1% 3 97 284 82 826 85. 1% 2 0. 0% 60. 7% 8 147 648 98 032 66. 4% 7 124 317 90 589 72. 8% 7 6. 4% LIMPOPO 65. 9% 7 101 807 63 595 62. 5% 8 83 228 54 625 65. 6% 8 3. 1% MPUMALANGA 78. 6% 5 54 251 41 801 77. 1% 6 48 483 36 273 74. 8% 6 -2. 3% NORTH WEST NORTHERN CAPE WESTERN CAPE 81. 5% 4 32 045 26 448 82. 5% 4 30 792 24 462 79. 4% 4 -3. 1% 69. 4% 6 10 041 7 902 78. 7% 5 8 735 84. 7% 1 2 NATIONAL 70. 7% 50 869 43 716 85. 9% 442 610 178 672 72. 5% 6 608 75. 6% 5 -3. 1% 48 867 40 440 82. 7% 3 -3. 2% 14 401 534 484 435 75. 1% 2. 6%
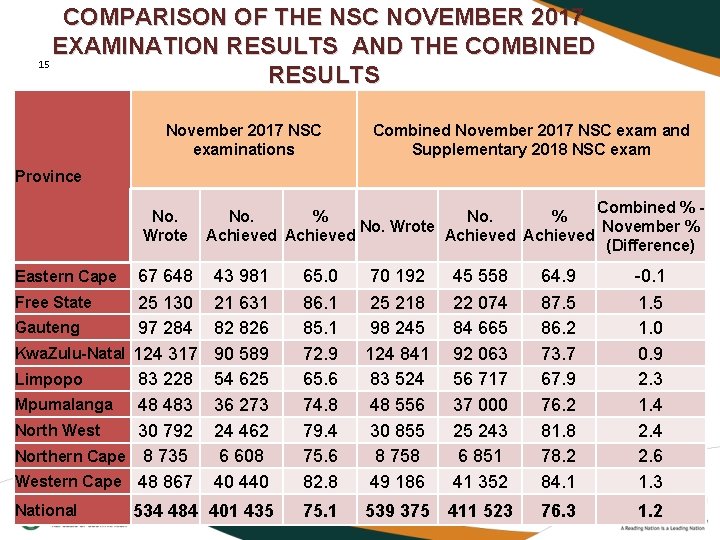
COMPARISON OF THE NSC NOVEMBER 2017 EXAMINATION RESULTS AND THE COMBINED 15 RESULTS November 2017 NSC examinations Combined November 2017 NSC exam and Supplementary 2018 NSC exam Province No. Wrote 67 648 Free State 25 130 Gauteng 97 284 Kwa. Zulu-Natal 124 317 Limpopo 83 228 Mpumalanga 48 483 North West 30 792 Northern Cape 8 735 Western Cape 48 867 Eastern Cape National Combined % - No. % November % No. Wrote Achieved (Difference) 43 981 21 631 82 826 90 589 54 625 36 273 24 462 6 608 40 440 65. 0 86. 1 85. 1 72. 9 65. 6 74. 8 79. 4 75. 6 82. 8 70 192 25 218 98 245 124 841 83 524 48 556 30 855 8 758 49 186 45 558 22 074 84 665 92 063 56 717 37 000 25 243 6 851 41 352 64. 9 87. 5 86. 2 73. 7 67. 9 76. 2 81. 8 78. 2 84. 1 -0. 1 1. 5 1. 0 0. 9 2. 3 1. 4 2. 6 1. 3 534 484 401 435 75. 1 539 375 411 523 76. 3 1. 2
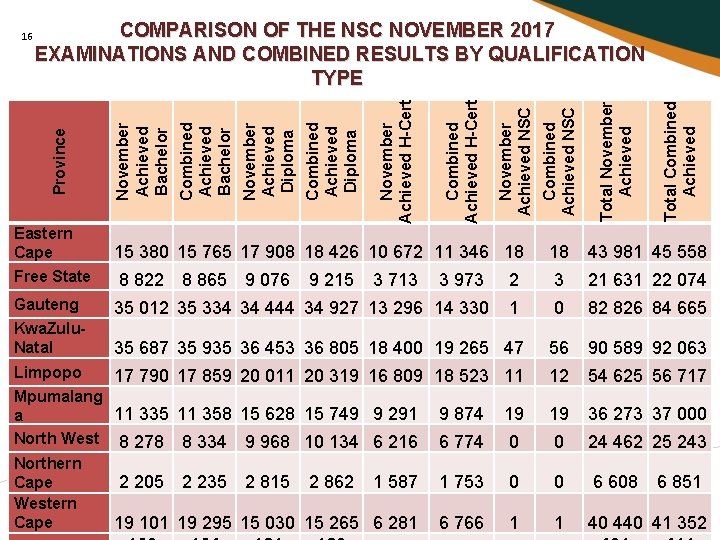
COMPARISON OF THE NSC NOVEMBER 2017 EXAMINATIONS AND COMBINED RESULTS BY QUALIFICATION TYPE Total Combined Achieved Total November Achieved Combined Achieved NSC November Achieved NSC Combined Achieved H-Cert November Achieved H-Cert Combined Achieved Diploma November Achieved Diploma Combined Achieved Bachelor November Achieved Bachelor Province 16 Eastern Cape Free State 15 380 15 765 17 908 18 426 10 672 11 346 18 18 43 981 45 558 8 822 3 973 2 3 21 631 22 074 Gauteng 35 012 35 334 34 444 34 927 13 296 14 330 1 0 82 826 84 665 Kwa. Zulu. Natal 35 687 35 935 36 453 36 805 18 400 19 265 47 56 90 589 92 063 20 011 20 319 16 809 18 523 11 12 54 625 56 717 15 628 15 749 9 291 9 874 19 19 36 273 37 000 9 968 10 134 6 216 6 774 0 0 24 462 25 243 2 815 1 587 1 753 0 0 6 608 15 030 15 265 6 281 6 766 1 1 40 41 352 8 865 Limpopo 17 790 17 859 Mpumalang 11 335 11 358 a North West 8 278 8 334 Northern Cape 2 205 2 235 Western Cape 19 101 19 295 9 076 9 215 2 862 3 713 6 851
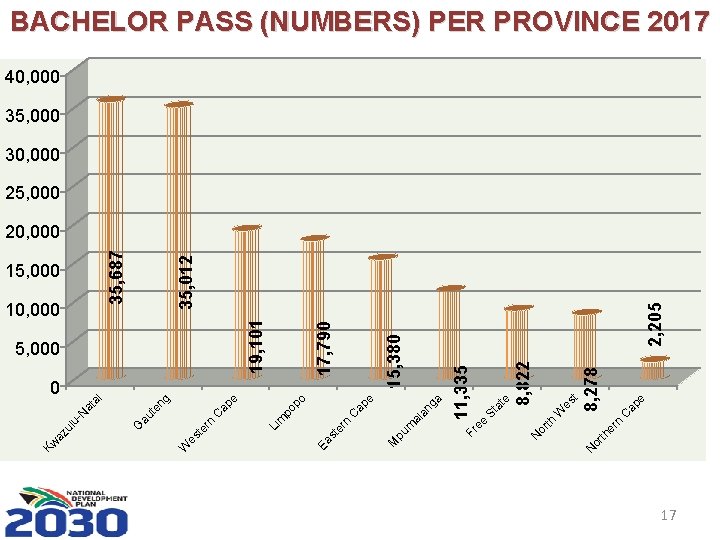
er n or th N ee Fr ap e C es t 8, 278 W 8, 822 at e St 35, 012 2, 205 15, 380 17, 790 19, 101 11, 335 ng a al a m pu e ap C 0 M n Ea st er po po ap e C 5, 000 Li m rn te es W ng au te 10, 000 35, 687 15, 000 G l at a -N az ul u Kw BACHELOR PASS (NUMBERS) PER PROVINCE 2017 40, 000 35, 000 30, 000 25, 000 20, 000 17
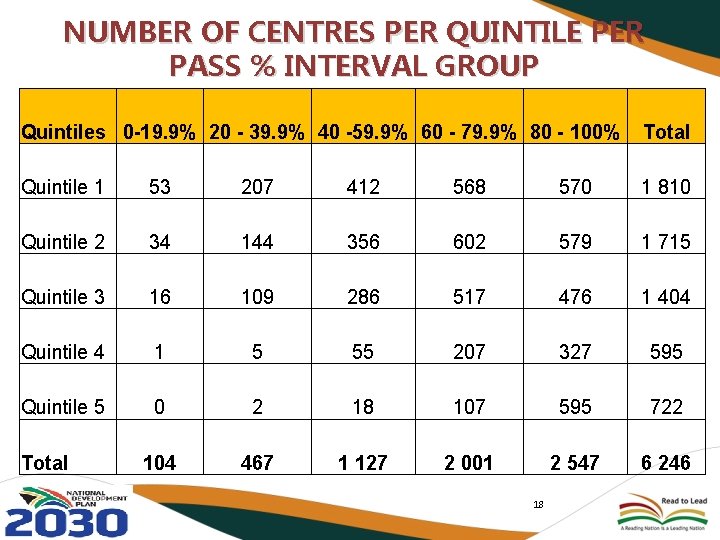
NUMBER OF CENTRES PER QUINTILE PER PASS % INTERVAL GROUP Quintiles 0 -19. 9% 20 - 39. 9% 40 -59. 9% 60 - 79. 9% 80 - 100% Total Quintile 1 53 207 412 568 570 1 810 Quintile 2 34 144 356 602 579 1 715 Quintile 3 16 109 286 517 476 1 404 Quintile 4 1 5 55 207 327 595 Quintile 5 0 2 18 107 595 722 104 467 1 127 2 001 2 547 6 246 Total 18
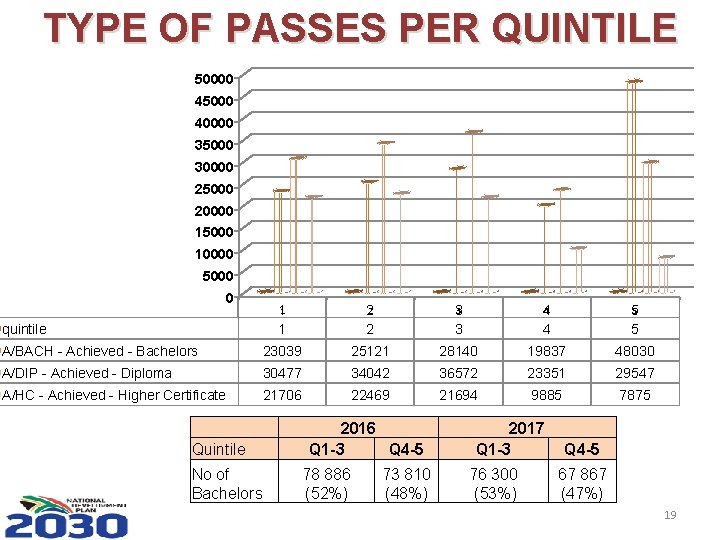
TYPE OF PASSES PER QUINTILE 50000 45000 40000 35000 30000 25000 20000 15000 10000 5000 0 11 1 22 2 33 3 44 4 55 5 A/BACH - Achieved - Bachelors 23039 25121 28140 19837 48030 A/DIP - Achieved - Diploma 30477 34042 36572 23351 29547 A/HC - Achieved - Higher Certificate 21706 22469 21694 9885 7875 quintile Quintile No of Bachelors 2016 Q 1 -3 Q 4 -5 78 886 (52%) 73 810 (48%) 2017 Q 1 -3 76 300 (53%) Q 4 -5 67 867 (47%) 19
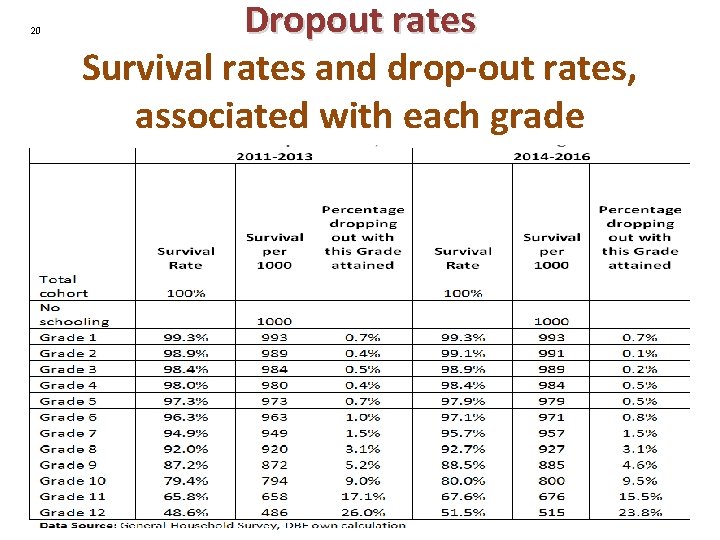
20 Dropout rates Survival rates and drop-out rates, associated with each grade
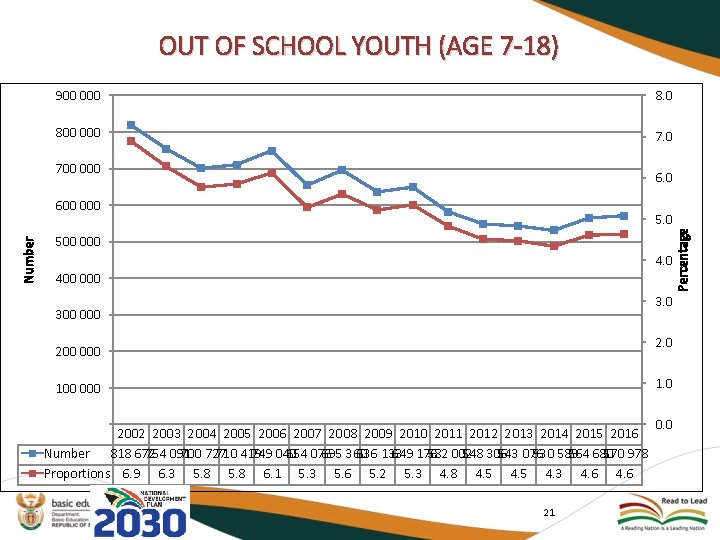
OUT OF SCHOOL YOUTH (AGE 7 -18) 900 000 8. 0 800 000 7. 0 700 000 6. 0 500 000 4. 0 400 000 3. 0 300 000 2. 0 200 000 1. 0 100 000 2002 2003 2004 2005 2006 2007 2008 2009 2010 2011 2012 2013 2014 2015 2016 Number 818 672 754 091 700 727 710 419 749 040 654 076 695 360 636 133 649 176 582 002 548 306 543 076 530 589 564 680 570 978 Proportions 6. 9 6. 3 5. 8 6. 1 5. 3 5. 6 5. 2 5. 3 4. 8 4. 5 4. 3 4. 6 21 0. 0 Percentage Number 600 000
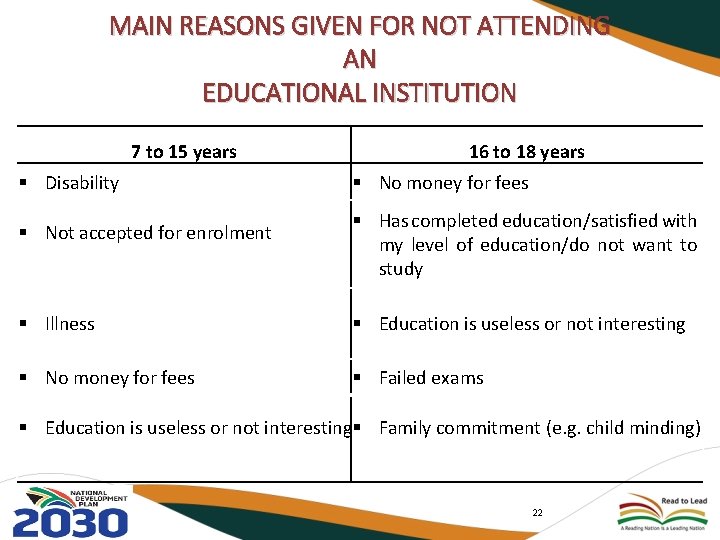
MAIN REASONS GIVEN FOR NOT ATTENDING AN EDUCATIONAL INSTITUTION 7 to 15 years § Disability § Not accepted for enrolment 16 to 18 years § No money for fees § Has completed education/satisfied with my level of education/do not want to study § Illness § Education is useless or not interesting § No money for fees § Failed exams § Education is useless or not interesting§ Family commitment (e. g. child minding) 22
NATIONAL ASSESSMENT 23
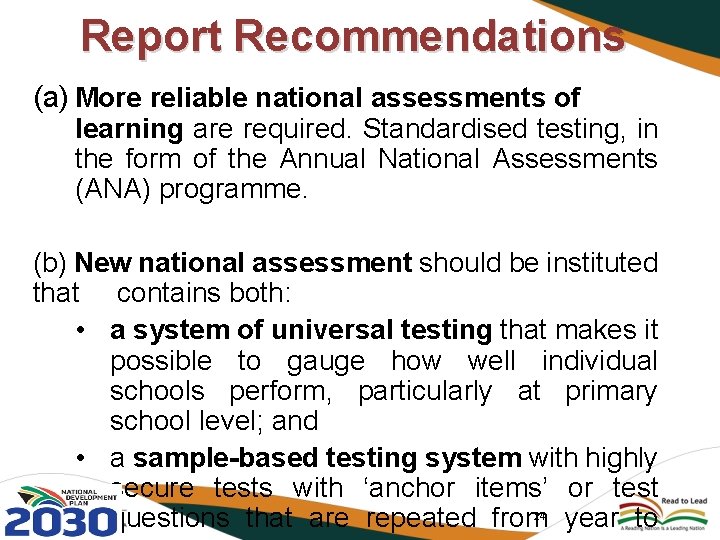
Report Recommendations (a) More reliable national assessments of learning are required. Standardised testing, in the form of the Annual National Assessments (ANA) programme. (b) New national assessment should be instituted that contains both: • a system of universal testing that makes it possible to gauge how well individual schools perform, particularly at primary school level; and • a sample-based testing system with highly secure tests with ‘anchor items’ or test 24 questions that are repeated from year to
Report Recommendations… (c) The model is perceived to be more comprehensive and purpose driven than the ANA. The (d) model evaluation anis schooling the of system comprising components: 3 inter-related I. Testing learners; II. Evaluating school functionality ; and III. Evaluating the level of system support and contextual factors. 25
Progress: National Assessment Systemic Evaluation a) A special task team comprising officials from the DBE, provincial education departments and teacher unions were tasked to finalise a redesign of the ANA. The task team favoured and recently adopted a broader based Systemic Evaluation (SE) model. b) In November 2017, Teacher Unions and the Department agreed that the first pilot cycle of the model should commence in 2018. 26
Progress: National Assessment… c) To enable the Department to more effectively monitor policy implementation and interventions, the key design features of the SE model include: • Conducting the evaluation every 3 years; • Testing a national sample of Grade 3, 6 and 9 learners from a sample of schools; • Conducting Whole-school evaluations and District evaluations. Vital contextual information on the conditions of learning and support will be informed by an analysis of in-school and out-of-school factors; and • Tests will be designed to monitor learner trends and will allow for international 27
d) Progress: National Assessment… 28
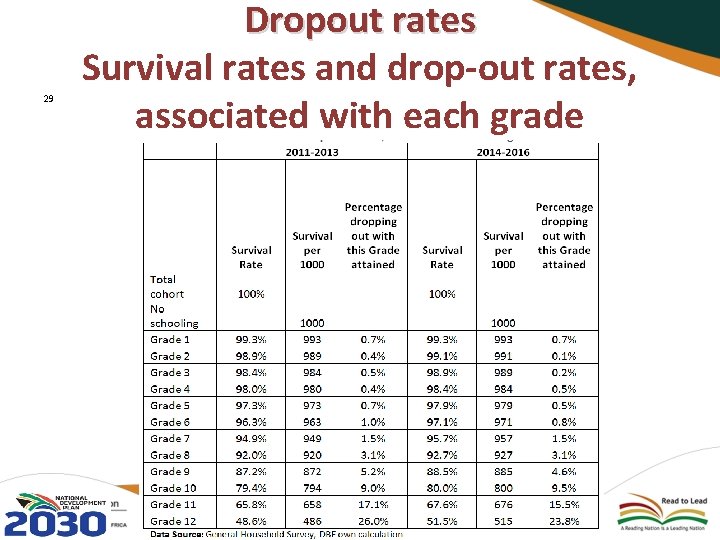
29 Dropout rates Survival rates and drop-out rates, associated with each grade
The National Senior Certificate 30
Report Recommendation Improve the extent of returns on our investments in education: • Only the completion of Matric seems to bear any noticeable return on investment in education in terms of labour market earnings and the probability of finding a job. • Unfortunately, due to high dropout rates, less than half of the children who enter Grade 1 will, on average, make it to Matric. 31
• The National Senior Certificate (NSC), more commonly known as Matric, embodies the key goals and objectives of the South African schooling system. • The National Senior Certificate (NSC) examinations written after 12 years of teaching and learning serves as the most reliable measure of the success of the education enterprise. • Given the currency and value of the matric, its credibility and the public confidence in the matric must be enhanced. 32
The National Senior Certificate Ø HLP report needs to be corrected in one respect: 55% of youths (not 30%) successfully complete Grade 12. This has recently been confirmed by Africa Check. Ø The value of 55% is calculated by comparing the numbers of NSC graduates with the population of 18 year-olds, according to STATS SA. 33
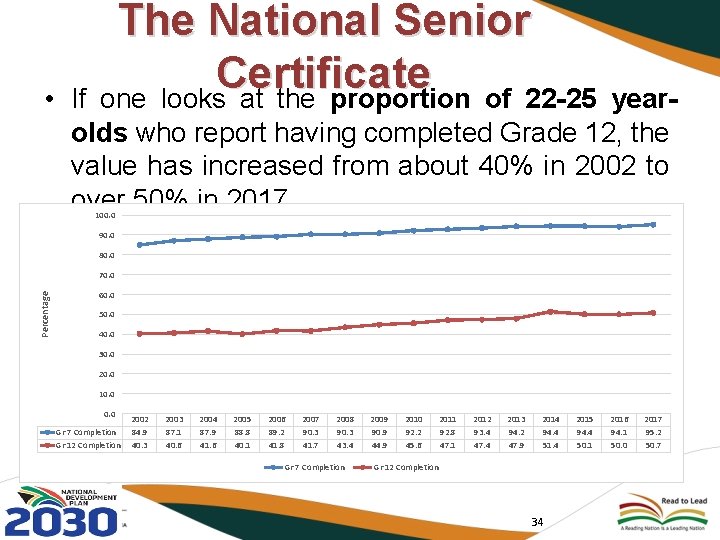
The National Senior Certificate one looks at the proportion of 22 -25 year- • If olds who report having completed Grade 12, the value has increased from about 40% in 2002 to over 50% in 2017. 100. 0 90. 0 80. 0 Percentage 70. 0 60. 0 50. 0 40. 0 30. 0 20. 0 10. 0 Gr 7 Completion Gr 12 Completion 2002 84. 9 40. 3 2003 87. 1 40. 6 2004 87. 9 41. 6 2005 88. 8 40. 1 2006 89. 2 41. 8 2007 90. 3 41. 7 2008 90. 3 43. 4 Gr 7 Completion 2009 90. 9 44. 9 2010 92. 2 45. 6 2011 92. 8 47. 1 2012 93. 4 47. 4 2013 94. 2 47. 9 2014 94. 4 51. 4 Gr 12 Completion 34 2015 94. 4 50. 1 2016 94. 1 50. 0 2017 95. 2 50. 7
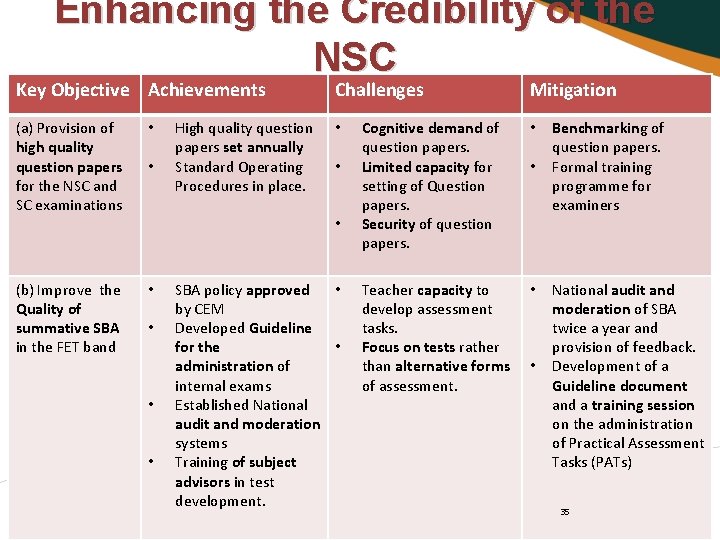
Enhancing the Credibility of the NSC Key Objective Achievements Challenges (a) Provision of high quality question papers for the NSC and SC examinations • • (b) Improve the Quality of summative SBA in the FET band • • High quality question papers set annually Standard Operating Procedures in place. • • • SBA policy approved • by CEM Developed Guideline for the • administration of internal exams Established National audit and moderation systems Training of subject advisors in test development. Cognitive demand of question papers. Limited capacity for setting of Question papers. Security of question papers. Mitigation • • Teacher capacity to • develop assessment tasks. Focus on tests rather than alternative forms • of assessment. Benchmarking of question papers. Formal training programme for examiners National audit and moderation of SBA twice a year and provision of feedback. Development of a Guideline document and a training session on the administration of Practical Assessment Tasks (PATs) 35
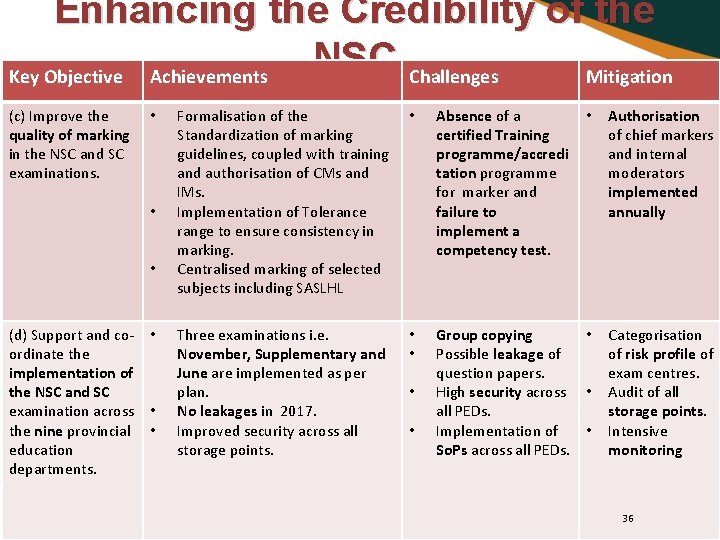
Enhancing the Credibility of the NSC Challenges Key Objective Achievements Mitigation (c) Improve the quality of marking in the NSC and SC examinations. • • • (d) Support and co- • ordinate the implementation of the NSC and SC examination across • the nine provincial • education departments. Formalisation of the Standardization of marking guidelines, coupled with training and authorisation of CMs and IMs. Implementation of Tolerance range to ensure consistency in marking. Centralised marking of selected subjects including SASLHL • Absence of a certified Training programme/accredi tation programme for marker and failure to implement a competency test. • Authorisation of chief markers and internal moderators implemented annually Three examinations i. e. November, Supplementary and June are implemented as per plan. No leakages in 2017. Improved security across all storage points. • • • Group copying Possible leakage of question papers. High security across • all PEDs. • Implementation of So. Ps across all PEDs. Categorisation of risk profile of exam centres. Audit of all storage points. Intensive monitoring • • 36
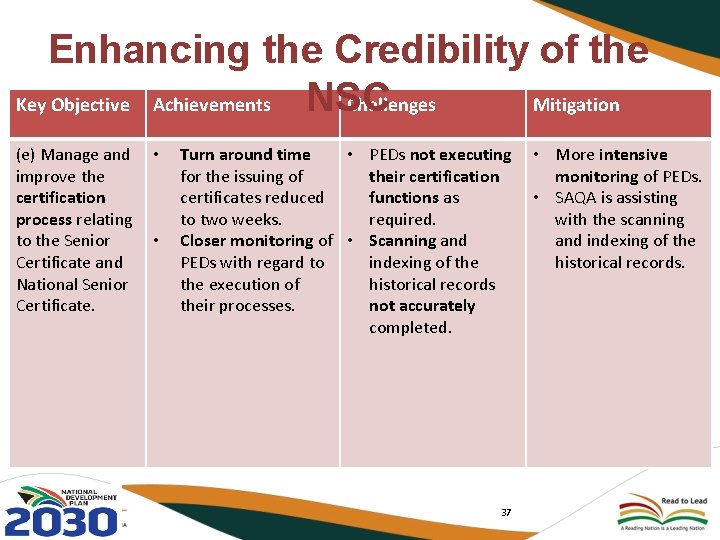
Enhancing the Credibility of the Key Objective Achievements Challenges Mitigation NSC (e) Manage and • improve the certification process relating to the Senior • Certificate and National Senior Certificate. Turn around time • PEDs not executing • More intensive for the issuing of their certification monitoring of PEDs. certificates reduced functions as • SAQA is assisting to two weeks. required. with the scanning Closer monitoring of • Scanning and indexing of the PEDs with regard to indexing of the historical records. the execution of historical records their processes. not accurately completed. 37
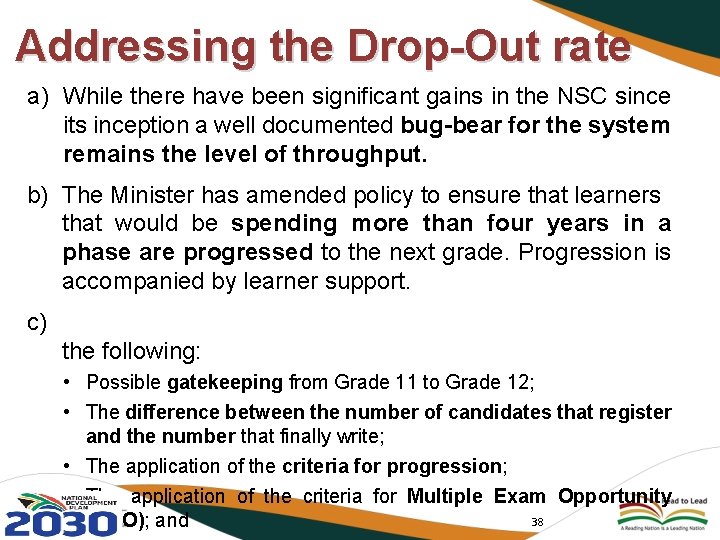
Addressing the Drop-Out rate a) While there have been significant gains in the NSC since its inception a well documented bug-bear for the system remains the level of throughput. b) The Minister has amended policy to ensure that learners that would be spending more than four years in a phase are progressed to the next grade. Progression is accompanied by learner support. c) the following: • Possible gatekeeping from Grade 11 to Grade 12; • The difference between the number of candidates that register and the number that finally write; • The application of the criteria for progression; • The application of the criteria for Multiple Exam Opportunity 38 (MEO); and
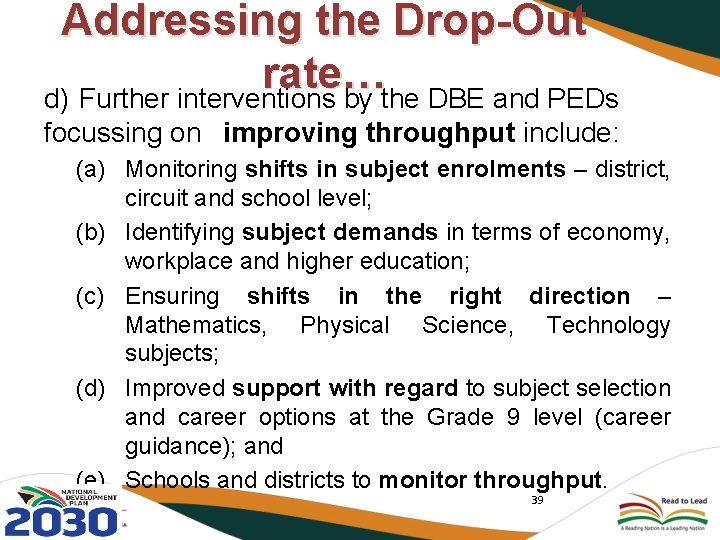
Addressing the Drop-Out rate… d) Further interventions by the DBE and PEDs focussing on improving throughput include: (a) Monitoring shifts in subject enrolments – district, circuit and school level; (b) Identifying subject demands in terms of economy, workplace and higher education; (c) Ensuring shifts in the right direction – Mathematics, Physical Science, Technology subjects; (d) Improved support with regard to subject selection and career options at the Grade 9 level (career guidance); and (e) Schools and districts to monitor throughput. 39
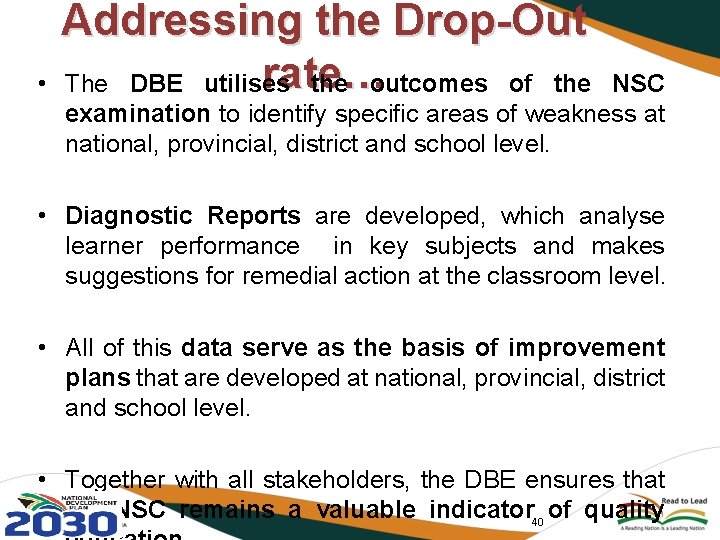
• Addressing the Drop-Out rate… The DBE utilises the outcomes of the NSC examination to identify specific areas of weakness at national, provincial, district and school level. • Diagnostic Reports are developed, which analyse learner performance in key subjects and makes suggestions for remedial action at the classroom level. • All of this data serve as the basis of improvement plans that are developed at national, provincial, district and school level. • Together with all stakeholders, the DBE ensures that the NSC remains a valuable indicator 40 of quality
SKILLS DEVELOPMENT 41
RECOMMENDATIONS ON SKILLS DEVELOPMENT • Skills development must respond – to two divergent dynamics: participating in a globally competitive environment that requires a high skills base including more skilled artisans and a local context that creates low-wage jobs to absorb the large numbers who are unemployed or in vulnerable jobs. 42
THREE STREAM MODEL “The different parts of the education system should work together allowing learners to take different pathways that offer high quality learning opportunities. ” (National Planning Commission: National Development Plan, November 2011) 43
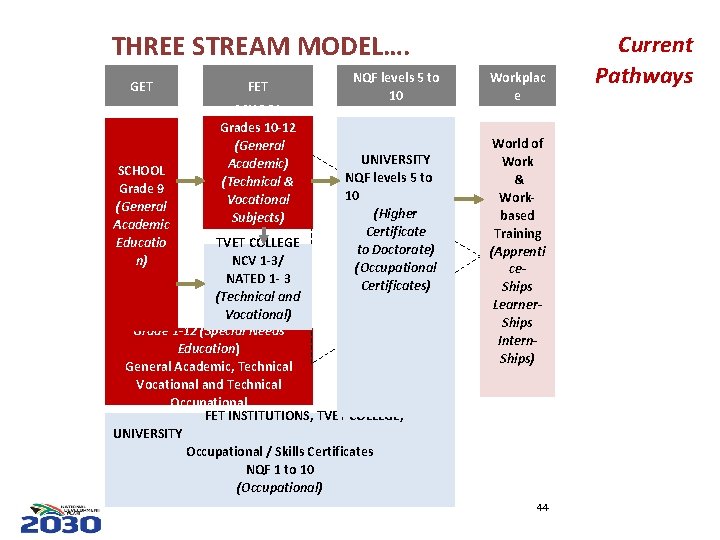
THREE STREAM MODEL…. GET SCHOOL Grade 9 (General Academic Educatio n) FET SCHOOL Grades 10 -12 (General Academic) (Technical & Vocational Subjects) TVET COLLEGE NQF levels 5 to 10 Workplac e UNIVERSITY NQF levels 5 to 10 (Higher Certificate to Doctorate) (Occupational Certificates) World of Work & Workbased Training (Apprenti ce. Ships Learner. Ships Intern. Ships) NCV 1 -3/ NATED 1 - 3 (Technical and Special Schools Vocational) Grade 1 -12 (Special Needs Education) General Academic, Technical Vocational and Technical Occupational FET INSTITUTIONS, TVET COLLEGE, UNIVERSITY Occupational / Skills Certificates NQF 1 to 10 (Occupational) 44 Current Pathways
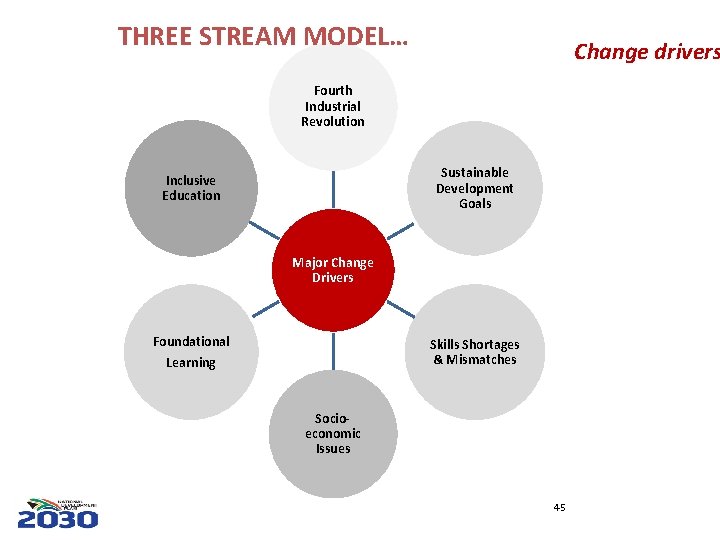
THREE STREAM MODEL… Change drivers Fourth Industrial Revolution Sustainable Development Goals Inclusive Education Major Change Drivers Foundational Learning Skills Shortages & Mismatches Socioeconomic Issues 45
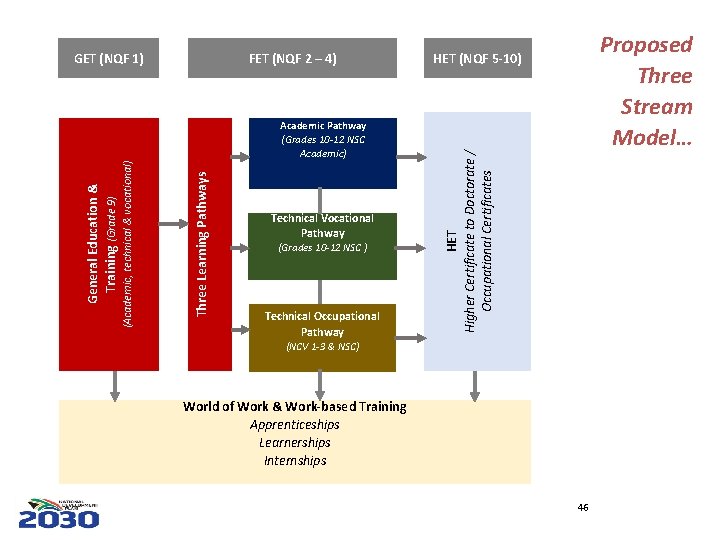
Academic Pathway (Grades 10 -12 NSC Academic) Technical Vocational Pathway (Grades 10 -12 NSC ) Technical Occupational Pathway Proposed Three Stream Model… HET (NQF 5 -10) HET Higher Certificate to Doctorate / Occupational Certificates FET (NQF 2 – 4) Three Learning Pathways (Academic, technical & vocational) General Education & Training (Grade 9) GET (NQF 1) (NCV 1 -3 & NSC) World of Work & Work-based Training Apprenticeships Learnerships Internships 46
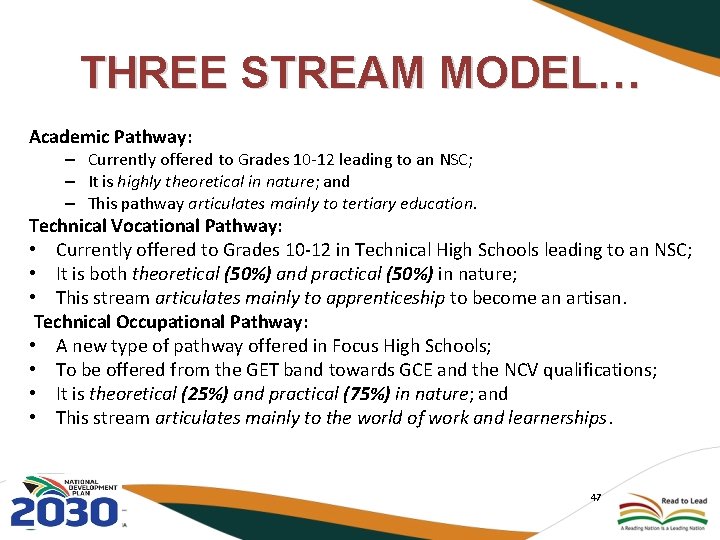
THREE STREAM MODEL… Academic Pathway: – Currently offered to Grades 10 -12 leading to an NSC; – It is highly theoretical in nature; and – This pathway articulates mainly to tertiary education. Technical Vocational Pathway: • Currently offered to Grades 10 -12 in Technical High Schools leading to an NSC; • It is both theoretical (50%) and practical (50%) in nature; • This stream articulates mainly to apprenticeship to become an artisan. Technical Occupational Pathway: • A new type of pathway offered in Focus High Schools; • To be offered from the GET band towards GCE and the NCV qualifications; • It is theoretical (25%) and practical (75%) in nature; and • This stream articulates mainly to the world of work and learnerships. 47
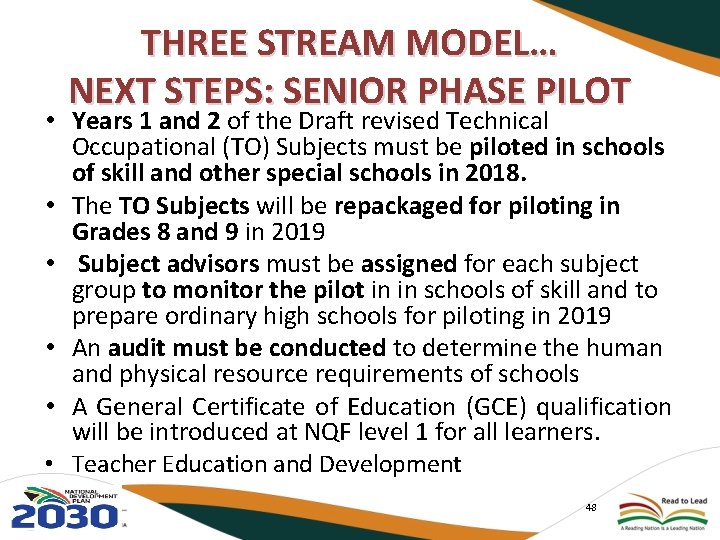
THREE STREAM MODEL… NEXT STEPS: SENIOR PHASE PILOT • Years 1 and 2 of the Draft revised Technical Occupational (TO) Subjects must be piloted in schools of skill and other special schools in 2018. • The TO Subjects will be repackaged for piloting in Grades 8 and 9 in 2019 • Subject advisors must be assigned for each subject group to monitor the pilot in in schools of skill and to prepare ordinary high schools for piloting in 2019 • An audit must be conducted to determine the human and physical resource requirements of schools • A General Certificate of Education (GCE) qualification will be introduced at NQF level 1 for all learners. • Teacher Education and Development 48
TEACHING OF READING 49
READING: REPORT RECOMMENDATIONS New ways of teaching basic reading skills should be implemented with urgency with special focus on: • Improving literacy and learning competency; • Improving reading and comprehension skills; • Strengthen pedagogy in the early grades, with particular focus on reading acquisition; • Develop norms and standards for reading and writing; and • Reduce the exceptionally large classes in lower grades as this limits innovative teaching practices. 50
RESPONSE TO THE RECOMMENDATIONS 51
Context: Reading results in International Studies • South Africa participated in the Progress in International literacy and Reading Study (PIRLS) 2006, 2011 & 2016 • 78% of grade 4 children could not read for meaning in Home Language in 2016 • Massive gender gap in favour of girls of about a grade level • South Africa improved in PIRLS between 2006 and 2011 but no change since 2011 • Importantly, TIMSS, SACMEQ and PIRLS data point in the same direction. Viewed jointly, they suggest that it is not that there was NO progress in reading 2011 to 2016 at the primary level (something PIRLS seems to suggest), but rather that steep pre-2011 improvements slowed down. Of course even a slowing down is cause for concern. 52
PRIMARY SCHOOL READING IMPROVEMENT PROJECT (PSRIP) IMPROVING LITERACY AND READING OUTCOMES Aims: • strengthening previous and current initiatives • building the capacity of the teachers in core methodologies and inculcating the necessary routines • providing extra resources (lesson plans, readers and posters - EFAL) • developing capacity in districts and circuits to support the teaching of literacy and reading 53
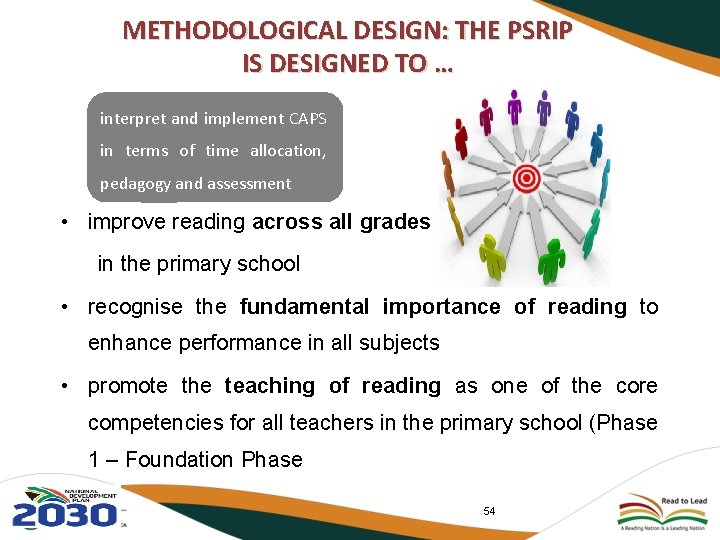
METHODOLOGICAL DESIGN: THE PSRIP IS DESIGNED TO … interpret and implement CAPS in terms of time allocation, pedagogy and assessment • improve reading across all grades in the primary school • recognise the fundamental importance of reading to enhance performance in all subjects • promote the teaching of reading as one of the core competencies for all teachers in the primary school (Phase 1 – Foundation Phase 54
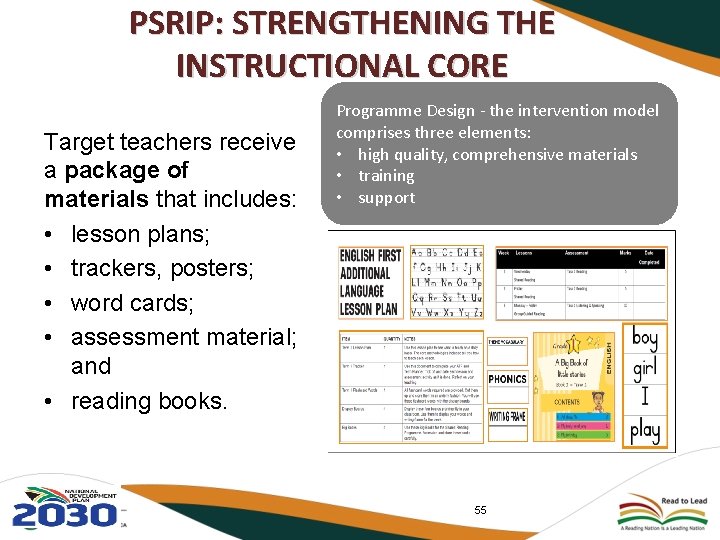
PSRIP: STRENGTHENING THE INSTRUCTIONAL CORE Target teachers receive a package of materials that includes: • lesson plans; • trackers, posters; • word cards; • assessment material; and • reading books. Programme Design - the intervention model comprises three elements: • high quality, comprehensive materials • training • support 55
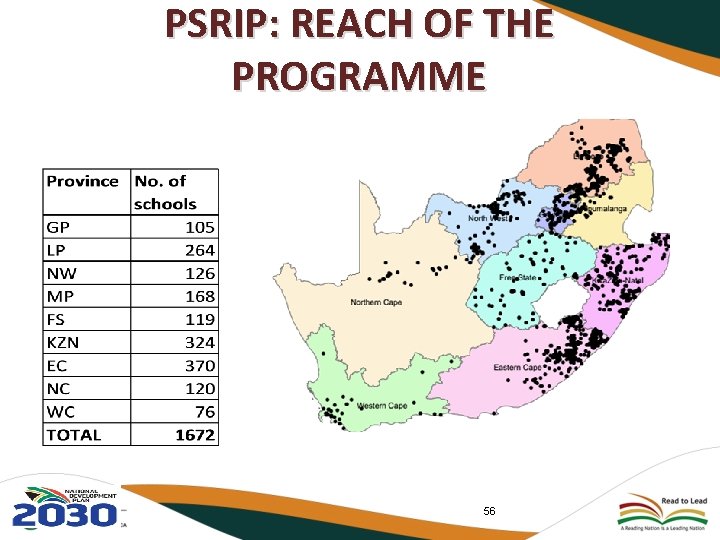
PSRIP: REACH OF THE PROGRAMME 56
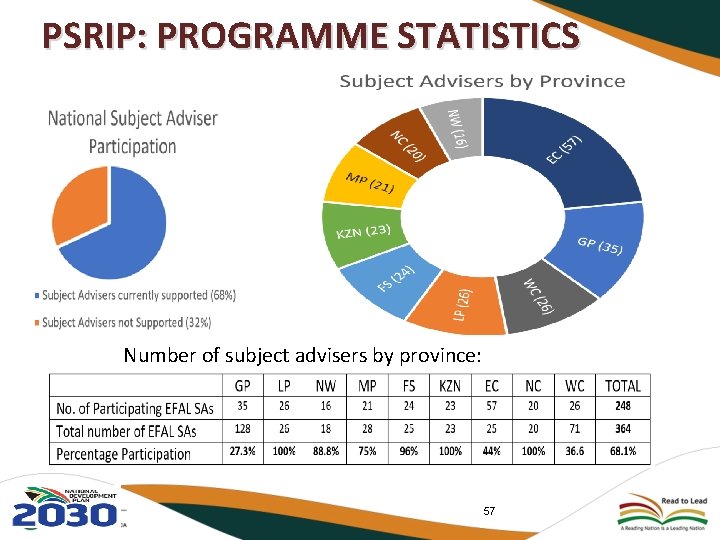
PSRIP: PROGRAMME STATISTICS Number of subject advisers by province: 57
EARLY GRADE READING STUDY AND IMPROVEMENT PLAN 58
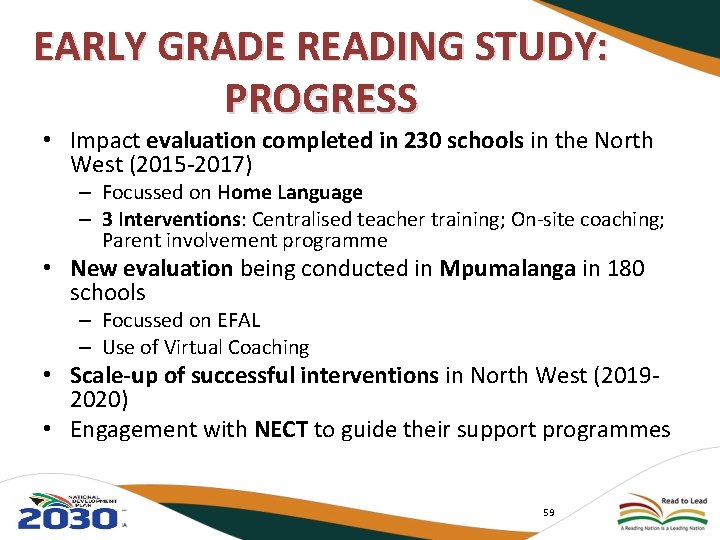
EARLY GRADE READING STUDY: PROGRESS • Impact evaluation completed in 230 schools in the North West (2015 -2017) – Focussed on Home Language – 3 Interventions: Centralised teacher training; On-site coaching; Parent involvement programme • New evaluation being conducted in Mpumalanga in 180 schools – Focussed on EFAL – Use of Virtual Coaching • Scale-up of successful interventions in North West (20192020) • Engagement with NECT to guide their support programmes 59
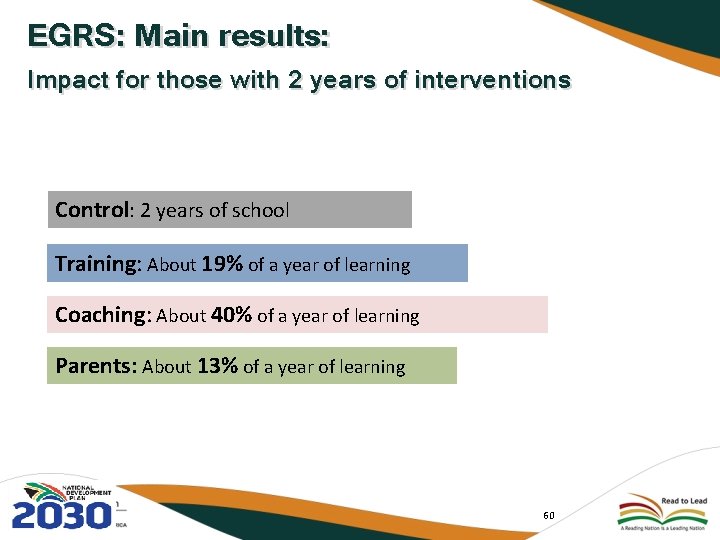
EGRS: Main results: Impact for those with 2 years of interventions Control: 2 years of school Training: About 19% of a year of learning Coaching: About 40% of a year of learning Parents: About 13% of a year of learning 60
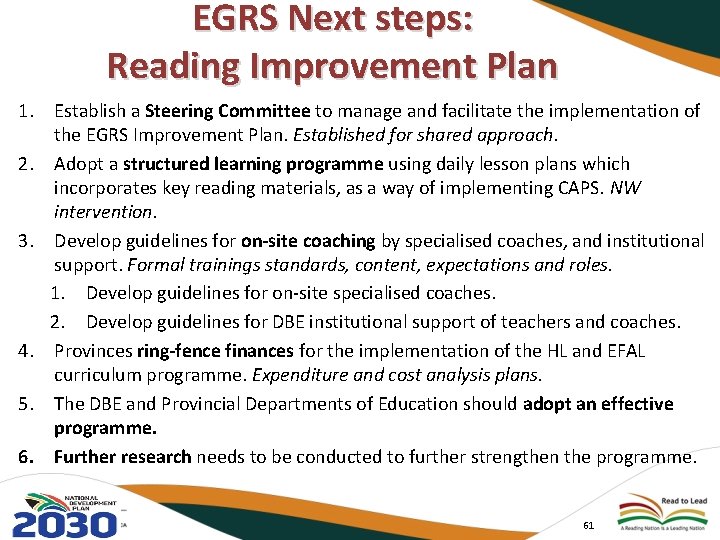
EGRS Next steps: Reading Improvement Plan 1. Establish a Steering Committee to manage and facilitate the implementation of the EGRS Improvement Plan. Established for shared approach. 2. Adopt a structured learning programme using daily lesson plans which incorporates key reading materials, as a way of implementing CAPS. NW intervention. 3. Develop guidelines for on-site coaching by specialised coaches, and institutional support. Formal trainings standards, content, expectations and roles. 1. Develop guidelines for on-site specialised coaches. 2. Develop guidelines for DBE institutional support of teachers and coaches. 4. Provinces ring-fence finances for the implementation of the HL and EFAL curriculum programme. Expenditure and cost analysis plans. 5. The DBE and Provincial Departments of Education should adopt an effective programme. 6. Further research needs to be conducted to further strengthen the programme. 61
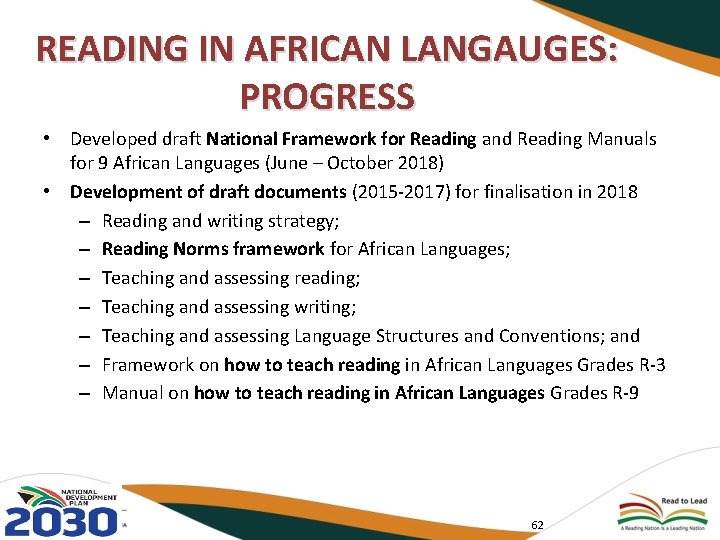
READING IN AFRICAN LANGAUGES: PROGRESS • Developed draft National Framework for Reading and Reading Manuals for 9 African Languages (June – October 2018) • Development of draft documents (2015 -2017) for finalisation in 2018 – Reading and writing strategy; – Reading Norms framework for African Languages; – Teaching and assessing reading; – Teaching and assessing writing; – Teaching and assessing Language Structures and Conventions; and – Framework on how to teach reading in African Languages Grades R-3 – Manual on how to teach reading in African Languages Grades R-9 62
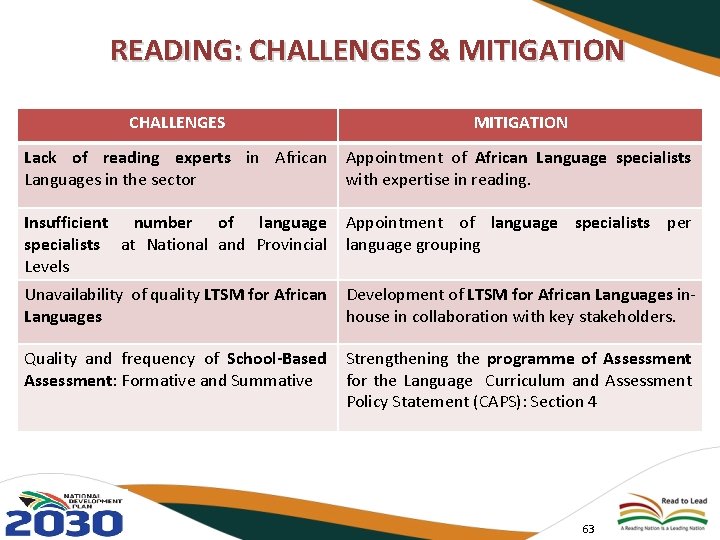
READING: CHALLENGES & MITIGATION CHALLENGES MITIGATION Lack of reading experts in African Appointment of African Language specialists Languages in the sector with expertise in reading. Insufficient number of language Appointment of language specialists per specialists at National and Provincial language grouping Levels Unavailability of quality LTSM for African Development of LTSM for African Languages in. Languages house in collaboration with key stakeholders. Quality and frequency of School-Based Strengthening the programme of Assessment: Formative and Summative for the Language Curriculum and Assessment Policy Statement (CAPS): Section 4 63
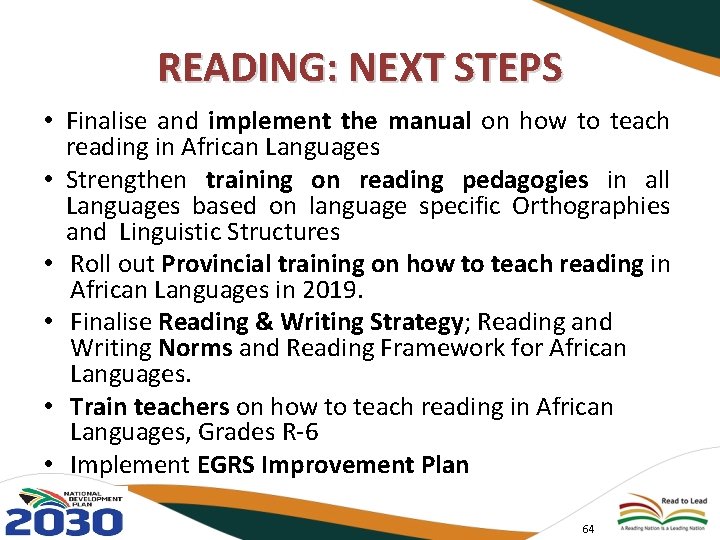
READING: NEXT STEPS • Finalise and implement the manual on how to teach reading in African Languages • Strengthen training on reading pedagogies in all Languages based on language specific Orthographies and Linguistic Structures • Roll out Provincial training on how to teach reading in African Languages in 2019. • Finalise Reading & Writing Strategy; Reading and Writing Norms and Reading Framework for African Languages. • Train teachers on how to teach reading in African Languages, Grades R-6 • Implement EGRS Improvement Plan 64
E-LEARNING — OPERATION PHAKISA/ SKILLS FOR A CHANGING WORLD/ IR 65
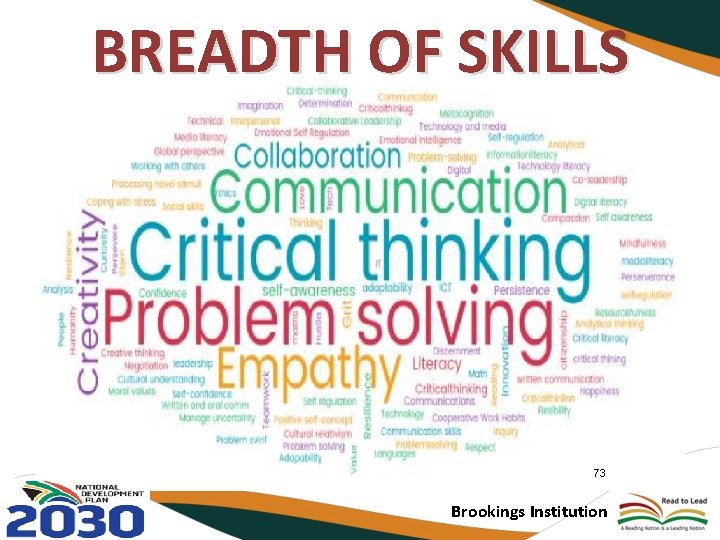
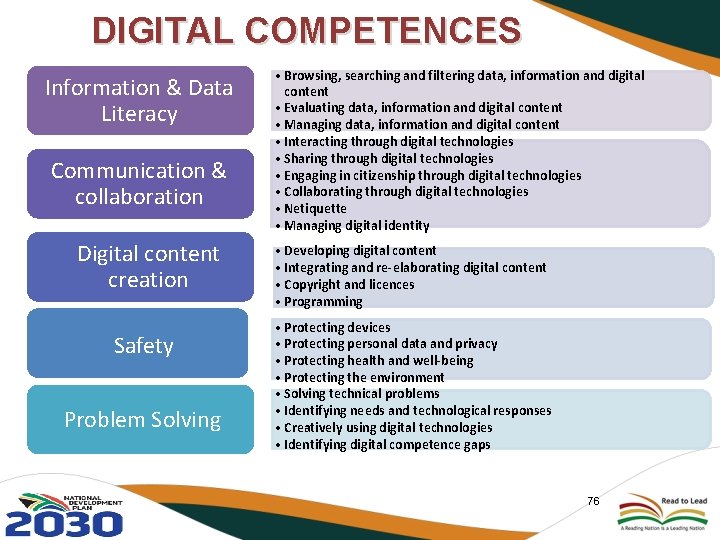
E-LEARNING / OPERATION PHAKISA: REPORT RECOMMENDATIONS Recommendations from the HLPA regarding 21 st Century skills are as follows: 1) “Given the impact that technology development is having on the labour market, literacy and learning competency have been identified as worker survival skills given that 47% of current jobs are destined for redundancy due to technological changes such as automation and artificial intelligence requiring workers to retrain for new jobs that will be created by these new technologies. ” (Executive Summary, p 45). 2) A new strategy is required to ensure access to broadband for learners 66
21 st CENTURY DEMANDS • The rapid growth in broadband access and usage, driven by mobile-broadband technologies has resulted in development of a “connected economy” which is giving rise to the Fourth Industrial Revolution (4 IR) • Emerging technologies stemming from internet of things (Io. T), robotics, artificial intelligence (AI) are driving the 4 IR • A World Economic Forum study estimated that more than 5. 1 million jobs will be lost as a result of labour market changes over the period 2015 to 2020. 67
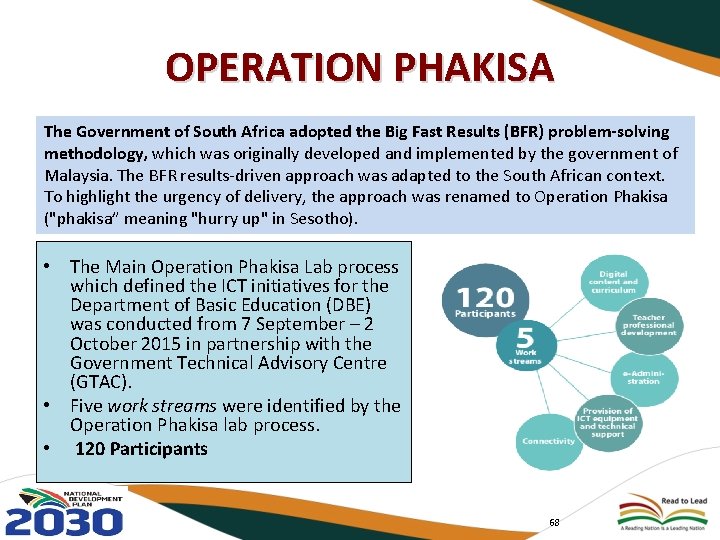
OPERATION PHAKISA The Government of South Africa adopted the Big Fast Results (BFR) problem-solving methodology, which was originally developed and implemented by the government of Malaysia. The BFR results-driven approach was adapted to the South African context. To highlight the urgency of delivery, the approach was renamed to Operation Phakisa ("phakisa” meaning "hurry up" in Sesotho). • The Main Operation Phakisa Lab process which defined the ICT initiatives for the Department of Basic Education (DBE) was conducted from 7 September – 2 October 2015 in partnership with the Government Technical Advisory Centre (GTAC). • Five work streams were identified by the Operation Phakisa lab process. • 120 Participants 68
E-LEARNING / OPERATION PHAKISA: RESPONDING TO THE REPORT • In terms of avoiding legislative silos, through Operation Phakisa, DBE is collaborating frequently with other government departments to ensure this practice is avoided. – Telecommunications and Postal Services and Communications (on connectivity); – Social Development (on ICT standards for special needs learners); – Science and Technology (on connectivity and ICT research in Pedagogy); – Higher Education (on training teachers to use ICTs in class); – Public Service Administration (on standardisation of ICT strategy and processes); as well as – other subsidiaries of these departments such as CSIR and ICASA. • The DBE holds quarterly meetings where all of these departments are present. This committee is called the ICT Interdepartmental Committee of Chief Directors. It has been in operation since 2016. 69
PLANS TO DEVELOP SKILLS FOR A CHANGING WORLD AND THE FOURTH INDUSTRIAL REVOLUTION 70
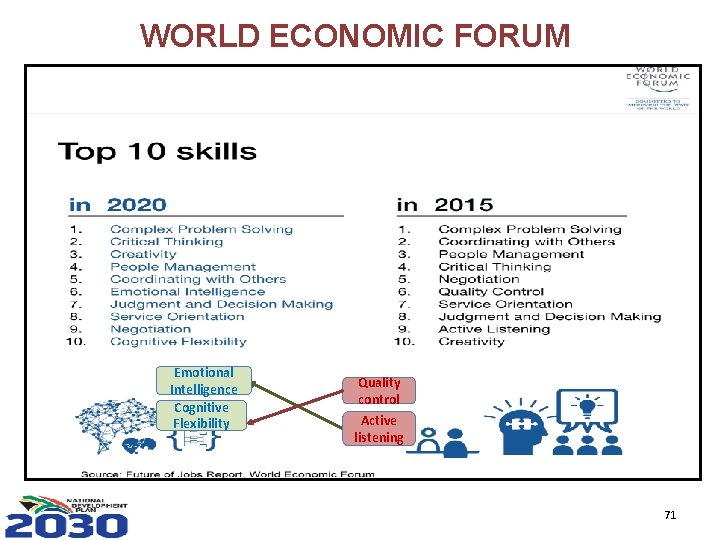
WORLD ECONOMIC FORUM NIR: FUTURE OF JOBS Emotional Intelligence Cognitive Flexibility Quality control Active listening 71
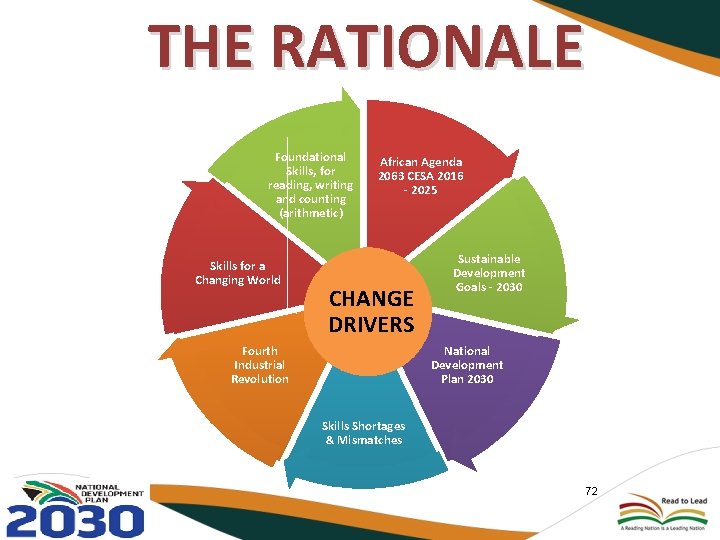
THE RATIONALE Foundational Skills, for reading, writing and counting (arithmetic) Skills for a Changing World African Agenda 2063 CESA 2016 - 2025 CHANGE DRIVERS Fourth Industrial Revolution Sustainable Development Goals - 2030 National Development Plan 2030 Skills Shortages & Mismatches 72
BREADTH OF SKILLS 73 Brookings Institution
SKILLS EMBEDDED IN THE CURRICULUM Innovation and Creativity Computational Skills Human Rights and Social Justice Critical Thinking Communication and Collaboration Problem Solving Team Work 74
75
DIGITAL COMPETENCES Information & Data Literacy Communication & collaboration Digital content creation Safety Problem Solving • Browsing, searching and filtering data, information and digital content • Evaluating data, information and digital content • Managing data, information and digital content • Interacting through digital technologies • Sharing through digital technologies • Engaging in citizenship through digital technologies • Collaborating through digital technologies • Netiquette • Managing digital identity • Developing digital content • Integrating and re-elaborating digital content • Copyright and licences • Programming • Protecting devices • Protecting personal data and privacy • Protecting health and well-being • Protecting the environment • Solving technical problems • Identifying needs and technological responses • Creatively using digital technologies • Identifying digital competence gaps 76
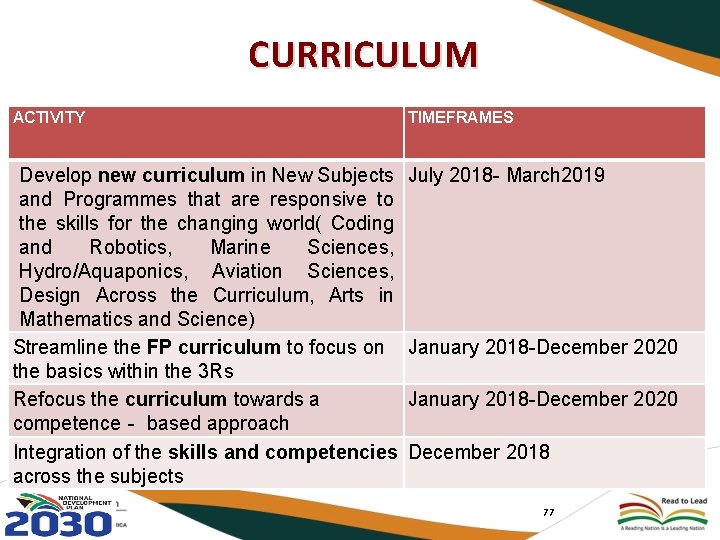
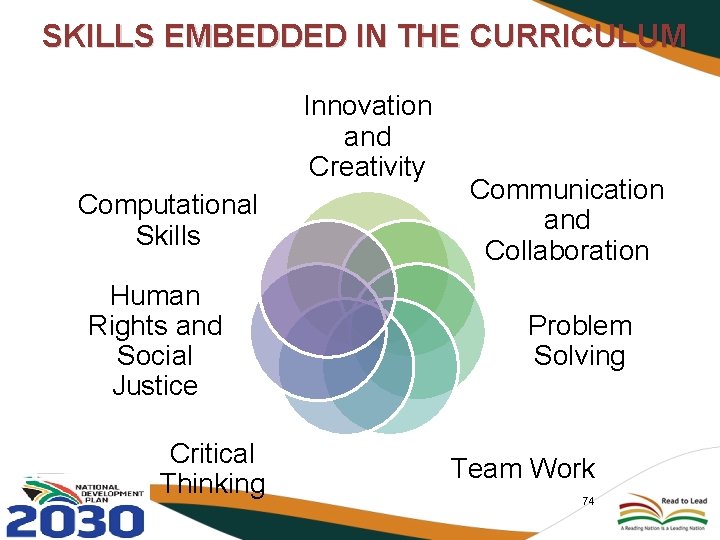
CURRICULUM ACTIVITY TIMEFRAMES Develop new curriculum in New Subjects July 2018 - March 2019 and Programmes that are responsive to the skills for the changing world( Coding and Robotics, Marine Sciences, Hydro/Aquaponics, Aviation Sciences, Design Across the Curriculum, Arts in Mathematics and Science) Streamline the FP curriculum to focus on January 2018 -December 2020 the basics within the 3 Rs Refocus the curriculum towards a January 2018 -December 2020 competence‐ based approach Integration of the skills and competencies December 2018 across the subjects 77
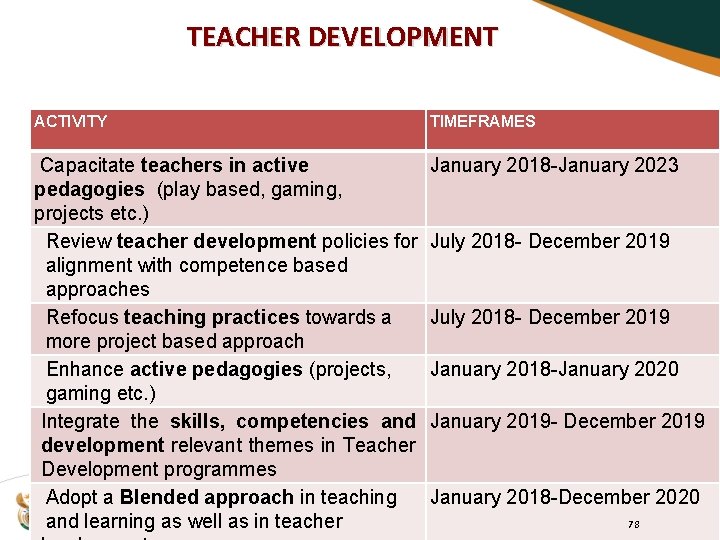
TEACHER DEVELOPMENT ACTIVITY TIMEFRAMES Capacitate teachers in active pedagogies (play based, gaming, projects etc. ) Review teacher development policies for alignment with competence based approaches Refocus teaching practices towards a more project based approach Enhance active pedagogies (projects, gaming etc. ) Integrate the skills, competencies and development relevant themes in Teacher Development programmes Adopt a Blended approach in teaching and learning as well as in teacher January 2018 -January 2023 July 2018 - December 2019 January 2018 -January 2020 January 2019 - December 2019 January 2018 -December 2020 78
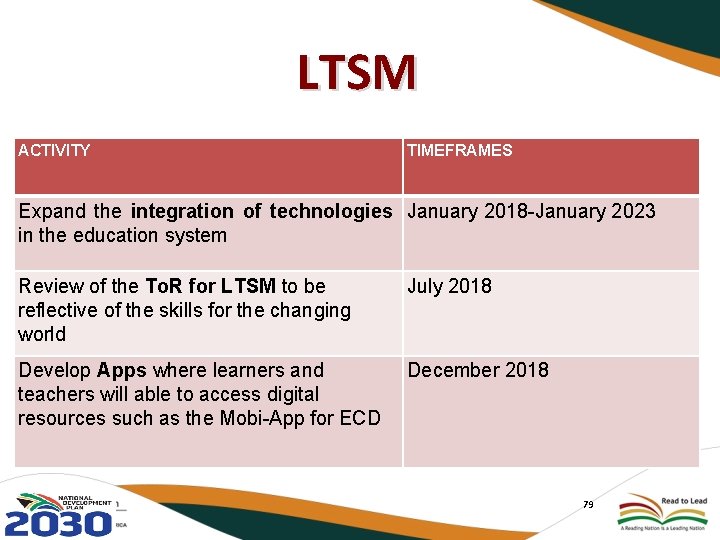
LTSM ACTIVITY TIMEFRAMES Expand the integration of technologies January 2018 -January 2023 in the education system Review of the To. R for LTSM to be reflective of the skills for the changing world July 2018 Develop Apps where learners and teachers will able to access digital resources such as the Mobi-App for ECD December 2018 79
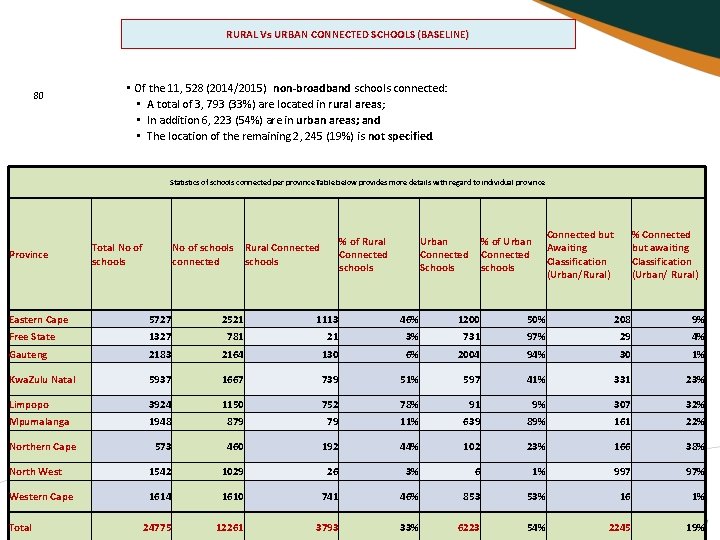
RURAL Vs URBAN CONNECTED SCHOOLS (BASELINE) 80 • Of the 11, 528 (2014/2015) non-broadband schools connected: • A total of 3, 793 (33%) are located in rural areas; • In addition 6, 223 (54%) are in urban areas; and • The location of the remaining 2, 245 (19%) is not specified. Statistics of schools connected per province Table below provides more details with regard to individual province Province Total No of schools % of Rural Connected schools No of schools Rural Connected connected schools Urban % of Urban Connected Schools schools Connected but Awaiting Classification (Urban/Rural) % Connected but awaiting Classification (Urban/ Rural) Eastern Cape 5727 2521 1113 46% 1200 50% 208 9% Free State 1327 781 21 3% 731 97% 29 4% Gauteng 2183 2164 130 6% 2004 94% 30 1% Kwa. Zulu Natal 5937 1667 739 51% 597 41% 331 23% Limpopo 3924 1150 752 78% 91 9% 307 32% Mpumalanga 1948 879 79 11% 639 89% 161 22% 573 460 192 44% 102 23% 166 38% North West 1542 1029 26 3% 6 1% 997 97% Western Cape 1614 1610 741 46% 853 53% 16 1% 24775 12261 3793 33% 6223 54% 2245 19% Northern Cape Total
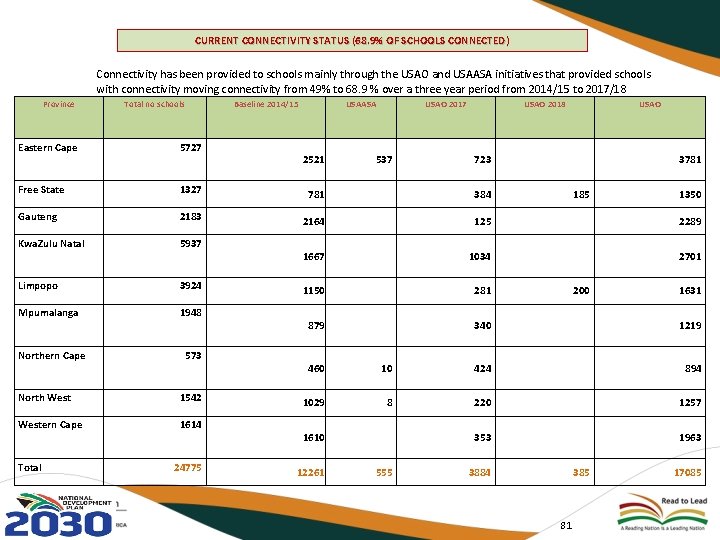
CURRENT CONNECTIVITY STATUS (68. 9% OF SCHOOLS CONNECTED) Connectivity has been provided to schools mainly through the USAO and USAASA initiatives that provided schools with connectivity moving connectivity from 49% to 68. 9 % over a three year period from 2014/15 to 2017/18 Province Total no schools Baseline 2014/15 USAASA Eastern Cape 5727 Free State 1327 781 Gauteng 2183 2164 Kwa. Zulu Natal 5937 Limpopo 3924 Mpumalanga 1948 Northern Cape 573 North West 1542 Western Cape 1614 Total 24775 2521 USAO 2017 537 USAO 2018 USAO 723 3781 384 185 1350 125 2289 1034 2701 1667 1150 281 200 1631 879 340 1219 460 10 424 894 1029 8 220 1257 353 1963 1610 12261 555 3884 385 81 17085
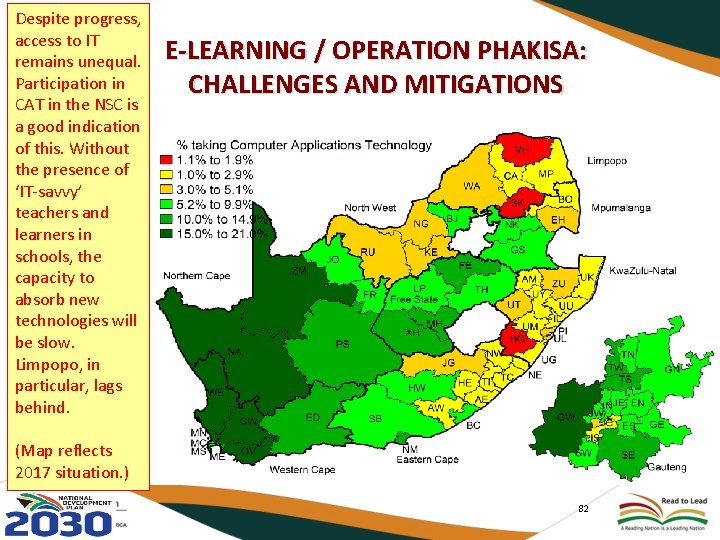
Despite progress, access to IT remains unequal. Participation in CAT in the NSC is a good indication of this. Without the presence of ‘IT-savvy’ teachers and learners in schools, the capacity to absorb new technologies will be slow. Limpopo, in particular, lags behind. E-LEARNING / OPERATION PHAKISA: CHALLENGES AND MITIGATIONS (Map reflects 2017 situation. ) 82
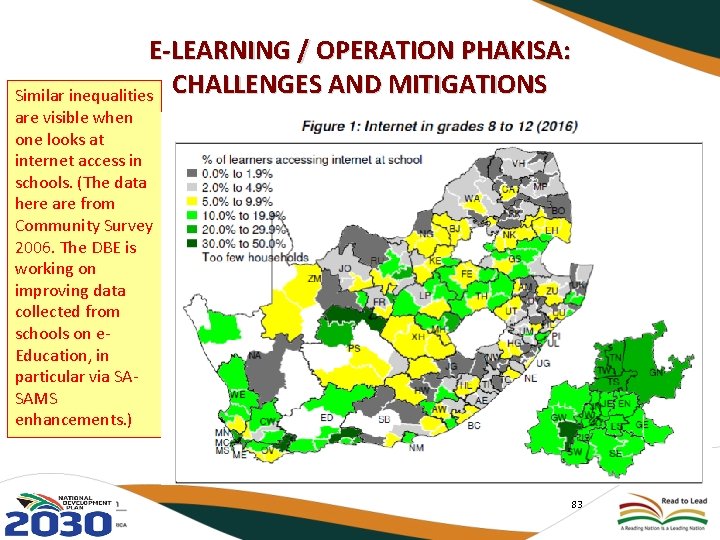
E-LEARNING / OPERATION PHAKISA: Similar inequalities CHALLENGES AND MITIGATIONS are visible when one looks at internet access in schools. (The data here are from Community Survey 2006. The DBE is working on improving data collected from schools on e. Education, in particular via SASAMS enhancements. ) 83
QUALITY AND STANDARDISED EARLY CHILDHOOD DEVELOPMENT PROGRAMMES (ECD) 84
ECD: REPORT RECOMMENDATIONS • Broaden access to quality and standardised Early Childhood Development programmes, targeting rural and marginalized communities. • Transfer the ECD programme from the Department of Social Development to the Department of Basic Education to improve readiness for Grade R. • Parliament should use its right to allocate funding to ECD to – Increase funding; and – develop appropriate training for ECD practitioners. • The state should offer subsidy and simultaneously improve sanitation, access to water and electricity to the communities where children live. 85
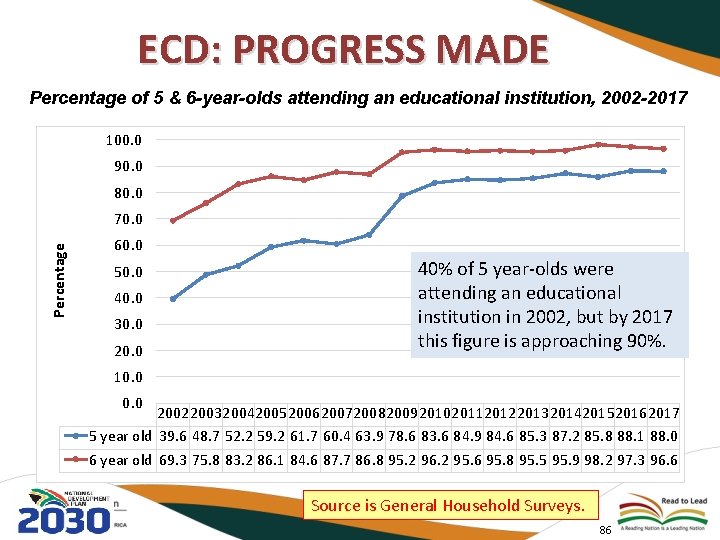
ECD: PROGRESS MADE Percentage of 5 & 6 -year-olds attending an educational institution, 2002 -2017 100. 0 90. 0 80. 0 Percentage 70. 0 60. 0 50. 0 40. 0 30. 0 20. 0 40% of 5 year-olds were attending an educational institution in 2002, but by 2017 this figure is approaching 90%. 10. 0 2002200320042005200620072008200920102011201220132014201520162017 5 year old 39. 6 48. 7 52. 2 59. 2 61. 7 60. 4 63. 9 78. 6 83. 6 84. 9 84. 6 85. 3 87. 2 85. 8 88. 1 88. 0 6 year old 69. 3 75. 8 83. 2 86. 1 84. 6 87. 7 86. 8 95. 2 96. 2 95. 6 95. 8 95. 5 95. 9 98. 2 97. 3 96. 6 Source is General Household Surveys. 86
ECD: PROGRESS MADE • National Integrated ECD Policy approved by Cabinet on 09 December 2015. • Draft National Integrated ECD Plan developed in 2017 by government departments to provide the framework for ensuring standardised and equitable delivery of the comprehensive package of quality services. • Heads of Education Committee (HEDCOM) of 16 April 2018 supported the establishment of a HEDCOM ECD Sub-Committee under the leadership of a provincial Head of Department to finalise an implementation plan and transitional arrangements if the function is shifted to Basic Education. 87
ECD: PROGRESS MADE… • DSD Conditional Grant for ECD infrastructure and financing framework developed; • 4 463 ECD practitioners currently in training towards a Level 4 ECD qualification; • Policy on Minimum Requirements for Programmes leading to Qualifications in Higher Education in Early Childhood Care And Education approved in March 2017. 88
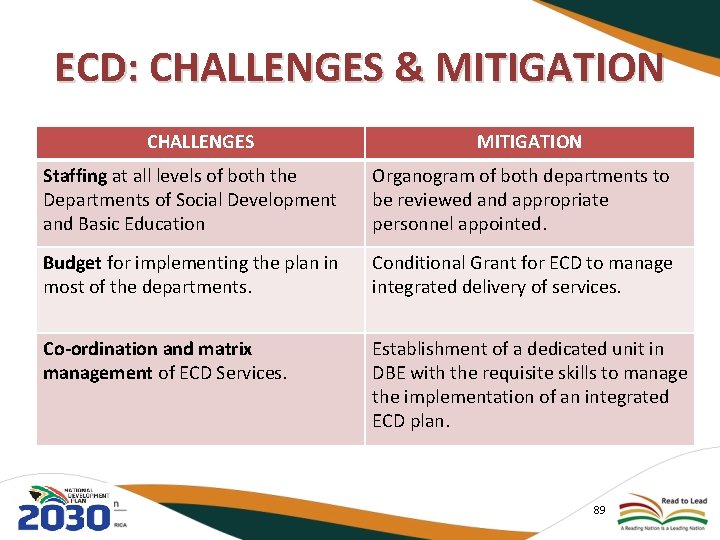
ECD: CHALLENGES & MITIGATION CHALLENGES MITIGATION Staffing at all levels of both the Departments of Social Development and Basic Education Organogram of both departments to be reviewed and appropriate personnel appointed. Budget for implementing the plan in most of the departments. Conditional Grant for ECD to manage integrated delivery of services. Co-ordination and matrix management of ECD Services. Establishment of a dedicated unit in DBE with the requisite skills to manage the implementation of an integrated ECD plan. 89
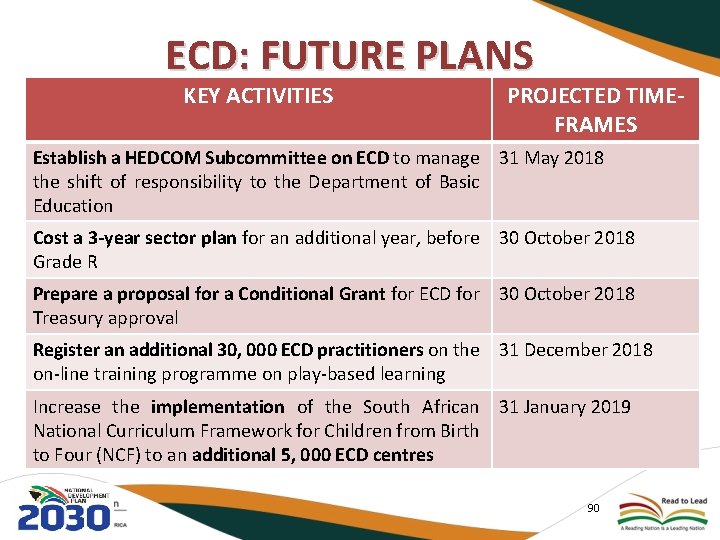
ECD: FUTURE PLANS KEY ACTIVITIES PROJECTED TIMEFRAMES Establish a HEDCOM Subcommittee on ECD to manage 31 May 2018 the shift of responsibility to the Department of Basic Education Cost a 3 -year sector plan for an additional year, before 30 October 2018 Grade R Prepare a proposal for a Conditional Grant for ECD for 30 October 2018 Treasury approval Register an additional 30, 000 ECD practitioners on the 31 December 2018 on-line training programme on play-based learning Increase the implementation of the South African 31 January 2019 National Curriculum Framework for Children from Birth to Four (NCF) to an additional 5, 000 ECD centres 90
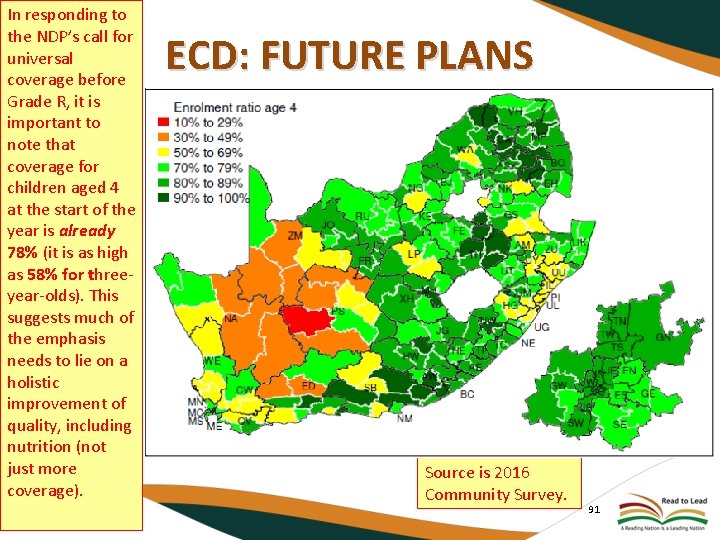
In responding to the NDP’s call for universal coverage before Grade R, it is important to note that coverage for children aged 4 at the start of the year is already 78% (it is as high as 58% for threeyear-olds). This suggests much of the emphasis needs to lie on a holistic improvement of quality, including nutrition (not just more coverage). ECD: FUTURE PLANS Source is 2016 Community Survey. 91
Early Childhood Development Funding The explanation of the current ECD funding model (Norms and Standard) and proposed changes to the model 92
Funding Model Grade 1 - 12 q. Funding for Grade 1 to 12 is regulated by two separate policies: Ø Provisioning of personnel is regulated by the Personnel post provisioning; and Ø Non personnel funding is regulated by the National Norms and Standard for school funding policy. 93
ECD - Current Funding Model v According to White paper 5, Grade R funding model in primary schools is structured via direct poverty –targeted grant-in-aid from Provincial Education Department to School Governing Bodies (SGB). v The subsidy is regulated through the National Norms and Standard for funding Grade R. v The total Grade R learner cost is equal to 70% of the total cost per learner in Grade 1. v. This covers personnel and non- personnel funding 94
ECD – proposed funding model v The range in funding model applicable in Grade R to be in line with the model which is applicable for Grade 1 to 12. v When determining a schools Norms and Standards allocation, learners enrolled in Grade R must be included in the enrolment figures of the school. 95
Legislative proposals v Repeal of Section 8, paragraphs 198 -260 (’’National Norms and Standard for Grade R Funding’’) of the amended national Norms and Standards for school funding. 96

SCHOOL MANAGEMENT AND GOVERNANCE 97
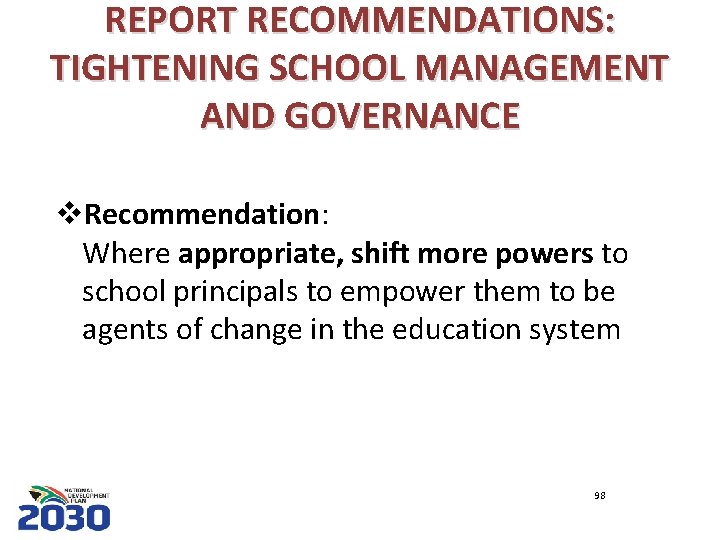
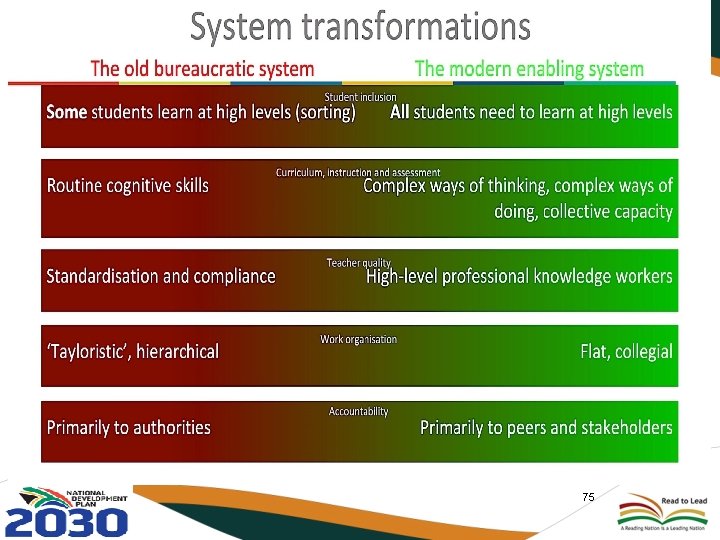
REPORT RECOMMENDATIONS: TIGHTENING SCHOOL MANAGEMENT AND GOVERNANCE v. Recommendation: Where appropriate, shift more powers to school principals to empower them to be agents of change in the education system 98
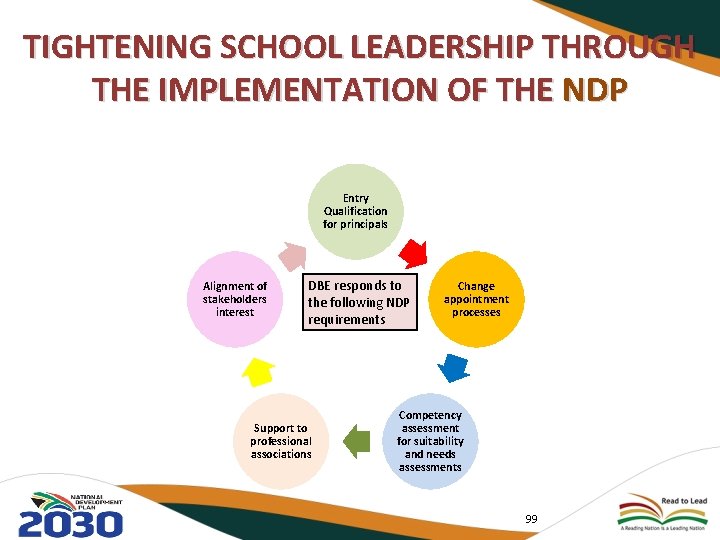
TIGHTENING SCHOOL LEADERSHIP THROUGH THE IMPLEMENTATION OF THE NDP Entry Qualification for principals Alignment of stakeholders interest DBE responds to the following NDP requirements Support to professional associations Change appointment processes Competency assessment for suitability and needs assessments 99
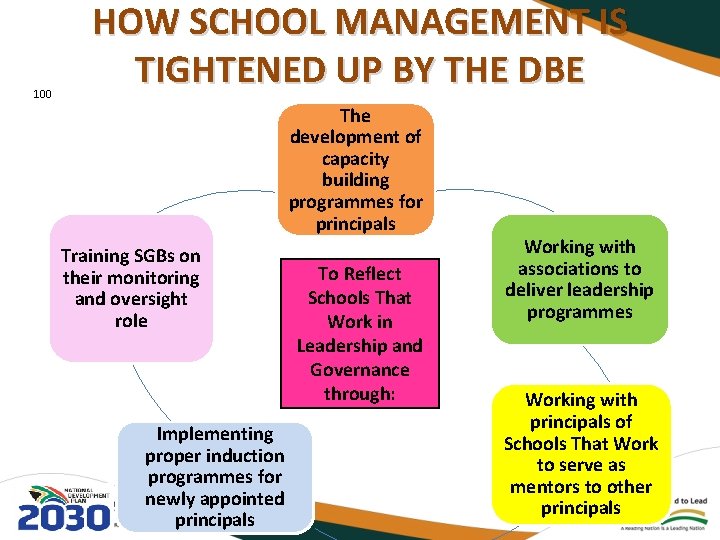
100 HOW SCHOOL MANAGEMENT IS TIGHTENED UP BY THE DBE The development of capacity building programmes for principals Training SGBs on their monitoring and oversight role Implementing proper induction programmes for newly appointed principals To Reflect Schools That Work in Leadership and Governance through: Working with associations to deliver leadership programmes Working with principals of Schools That Work to serve as mentors to other principals
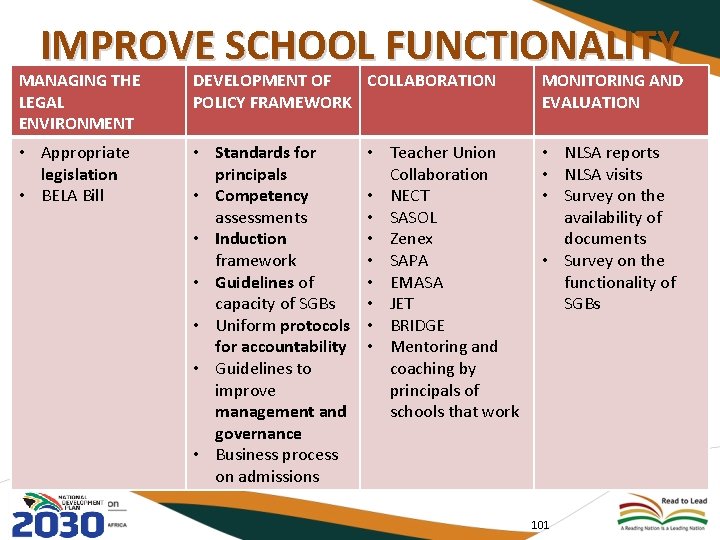
IMPROVE SCHOOL FUNCTIONALITY MANAGING THE LEGAL ENVIRONMENT DEVELOPMENT OF COLLABORATION POLICY FRAMEWORK MONITORING AND EVALUATION • Appropriate legislation • BELA Bill • Standards for principals • Competency assessments • Induction framework • Guidelines of capacity of SGBs • Uniform protocols for accountability • Guidelines to improve management and governance • Business process on admissions • NLSA reports • NLSA visits • Survey on the availability of documents • Survey on the functionality of SGBs • Teacher Union Collaboration • NECT • SASOL • Zenex • SAPA • EMASA • JET • BRIDGE • Mentoring and coaching by principals of schools that work 101
PROGRESS AND NEXT STEPS 102
PROGRESS AND NEXT STEPS • The recently published ‘South African standard for school principals’ is an important contribution in that it provides, for the first time, a clear and comprehensive statement of the competencies required of a school principal. 103
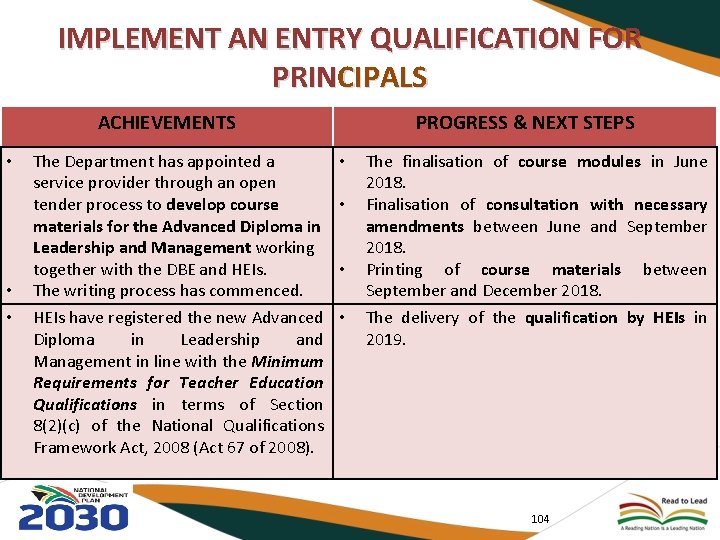
IMPLEMENT AN ENTRY QUALIFICATION FOR PRINCIPALS ACHIEVEMENTS • • • The Department has appointed a service provider through an open tender process to develop course materials for the Advanced Diploma in Leadership and Management working together with the DBE and HEIs. The writing process has commenced. HEIs have registered the new Advanced Diploma in Leadership and Management in line with the Minimum Requirements for Teacher Education Qualifications in terms of Section 8(2)(c) of the National Qualifications Framework Act, 2008 (Act 67 of 2008). PROGRESS & NEXT STEPS • • The finalisation of course modules in June 2018. Finalisation of consultation with necessary amendments between June and September 2018. Printing of course materials between September and December 2018. The delivery of the qualification by HEIs in 2019. 104
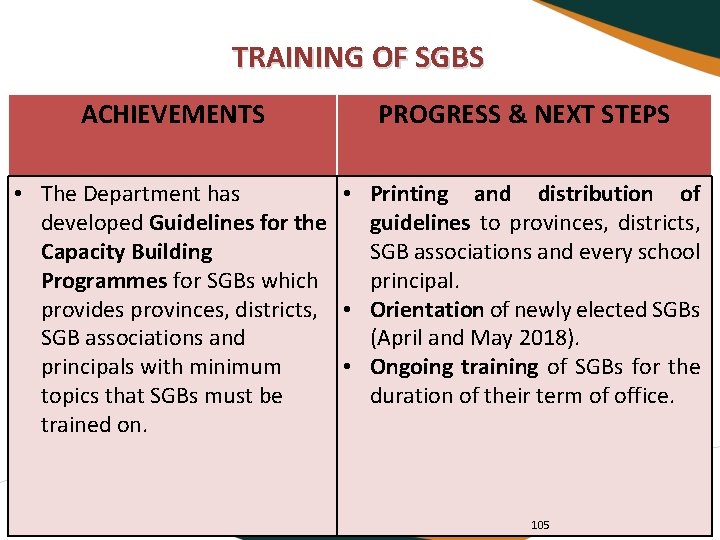
TRAINING OF SGBS ACHIEVEMENTS PROGRESS & NEXT STEPS • The Department has • Printing and distribution of developed Guidelines for the guidelines to provinces, districts, Capacity Building SGB associations and every school Programmes for SGBs which principal. provides provinces, districts, • Orientation of newly elected SGBs SGB associations and (April and May 2018). principals with minimum • Ongoing training of SGBs for the topics that SGBs must be duration of their term of office. trained on. 105
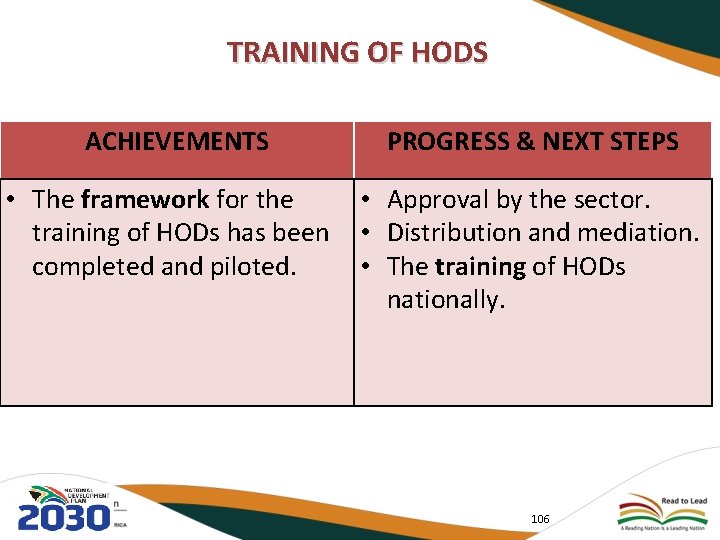
TRAINING OF HODS ACHIEVEMENTS PROGRESS & NEXT STEPS • The framework for the • Approval by the sector. training of HODs has been • Distribution and mediation. completed and piloted. • The training of HODs nationally. 106
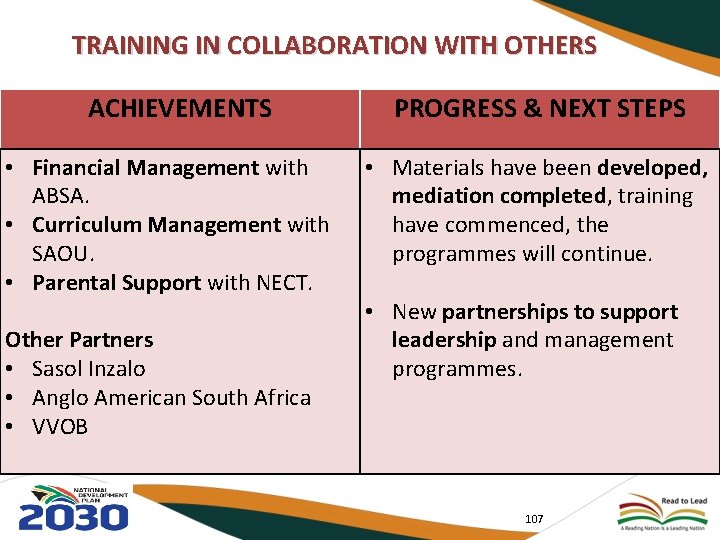
TRAINING IN COLLABORATION WITH OTHERS ACHIEVEMENTS • Financial Management with ABSA. • Curriculum Management with SAOU. • Parental Support with NECT. Other Partners • Sasol Inzalo • Anglo American South Africa • VVOB PROGRESS & NEXT STEPS • Materials have been developed, mediation completed, training have commenced, the programmes will continue. • New partnerships to support leadership and management programmes. 107
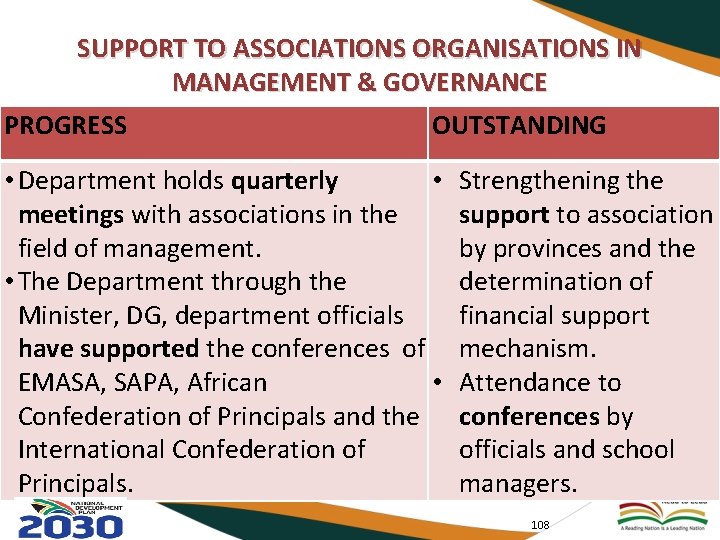
SUPPORT TO ASSOCIATIONS ORGANISATIONS IN MANAGEMENT & GOVERNANCE PROGRESS OUTSTANDING • Department holds quarterly • meetings with associations in the field of management. • The Department through the Minister, DG, department officials have supported the conferences of EMASA, SAPA, African • Confederation of Principals and the International Confederation of Principals. Strengthening the support to association by provinces and the determination of financial support mechanism. Attendance to conferences by officials and school managers. 108
RESOURCING 109
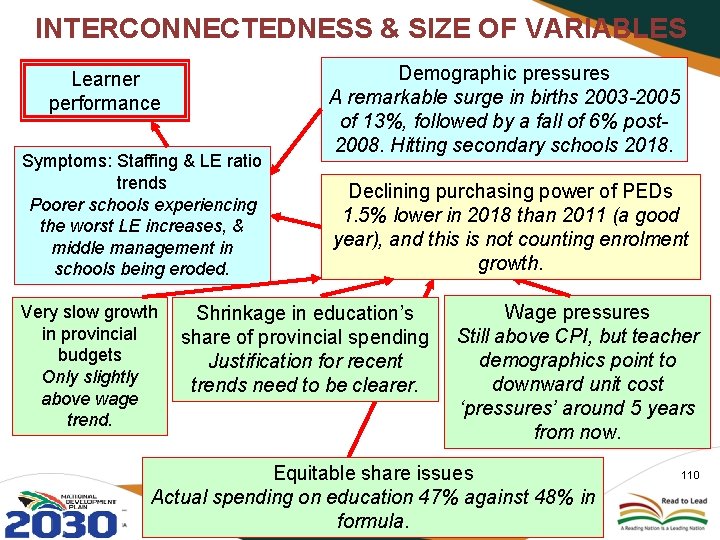
INTERCONNECTEDNESS & SIZE OF VARIABLES Learner performance Symptoms: Staffing & LE ratio trends Poorer schools experiencing the worst LE increases, & middle management in schools being eroded. Very slow growth in provincial budgets Only slightly above wage trend. Demographic pressures A remarkable surge in births 2003 -2005 of 13%, followed by a fall of 6% post 2008. Hitting secondary schools 2018. Declining purchasing power of PEDs 1. 5% lower in 2018 than 2011 (a good year), and this is not counting enrolment growth. Shrinkage in education’s share of provincial spending Justification for recent trends need to be clearer. Wage pressures Still above CPI, but teacher demographics point to downward unit cost ‘pressures’ around 5 years from now. Equitable share issues Actual spending on education 47% against 48% in formula. 110
EQUITABLE SHARE ISSUES v Equitable share (ES) formula does not determine how much is spent on education in each province. However, it serves as a somewhat useful benchmark against which to gauge the adequacy of each province’s allocation to basic education. v However, strictly this should be ES as a % of all spending items in education, divided by ES as a % of all spending items in province. v In one respect, equitable share is actually (not just theoretically) ‘short-changing’ certain PEDs. The use of the Census 2011 population figures in the education component (mid-year estimates are used elsewhere in the formula) means that, in particular, Gauteng is under-funded. More specifically, Gauteng appears to be losing around R 300 million each financial year. The cumulative under-funding for the Gauteng Department of Education over the 2018 MTEF period, is estimated at R 1 billion. 111
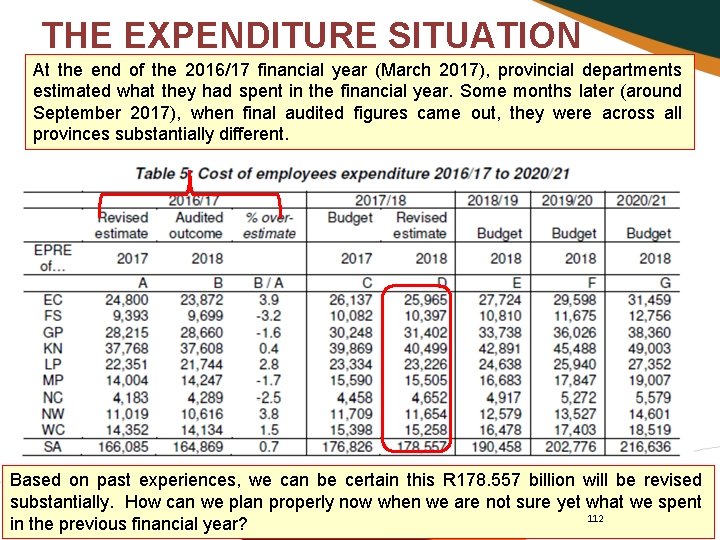
THE EXPENDITURE SITUATION At the end of the 2016/17 financial year (March 2017), provincial departments estimated what they had spent in the financial year. Some months later (around September 2017), when final audited figures came out, they were across all provinces substantially different. Based on past experiences, we can be certain this R 178. 557 billion will be revised substantially. How can we plan properly now when we are not sure yet what we spent 112 in the previous financial year?
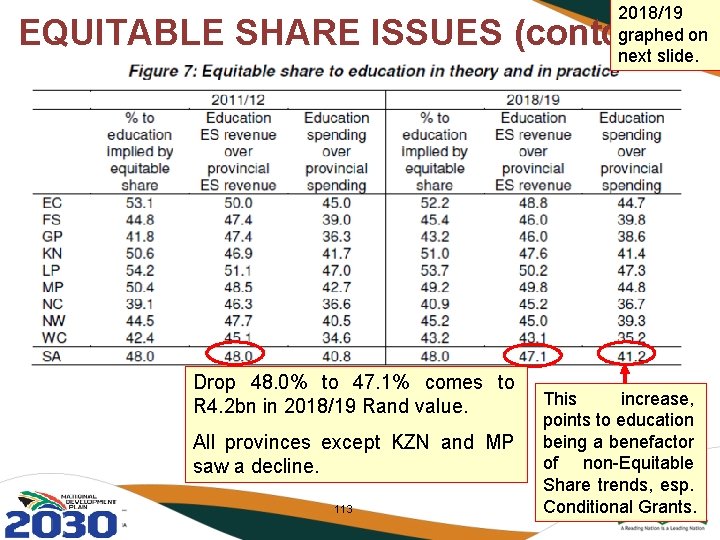
2018/19 graphed on next slide. EQUITABLE SHARE ISSUES (contd. ) Drop 48. 0% to 47. 1% comes to R 4. 2 bn in 2018/19 Rand value. All provinces except KZN and MP saw a decline. 113 This increase, points to education being a benefactor of non-Equitable Share trends, esp. Conditional Grants.
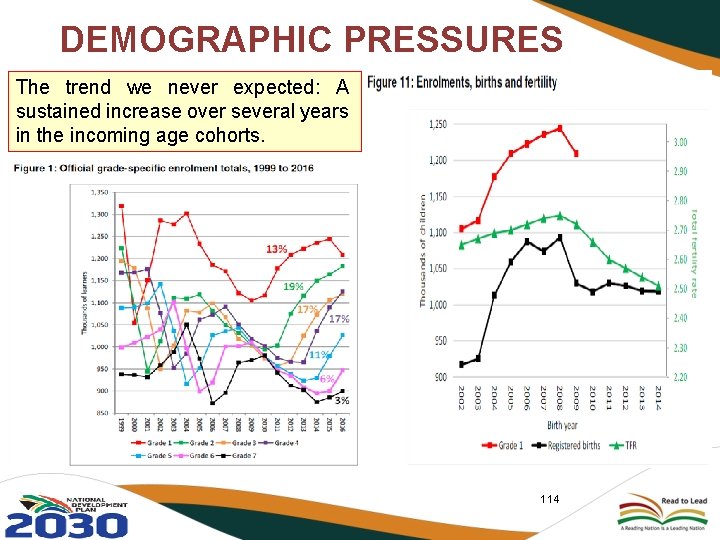
DEMOGRAPHIC PRESSURES The trend we never expected: A sustained increase over several years in the incoming age cohorts. 114
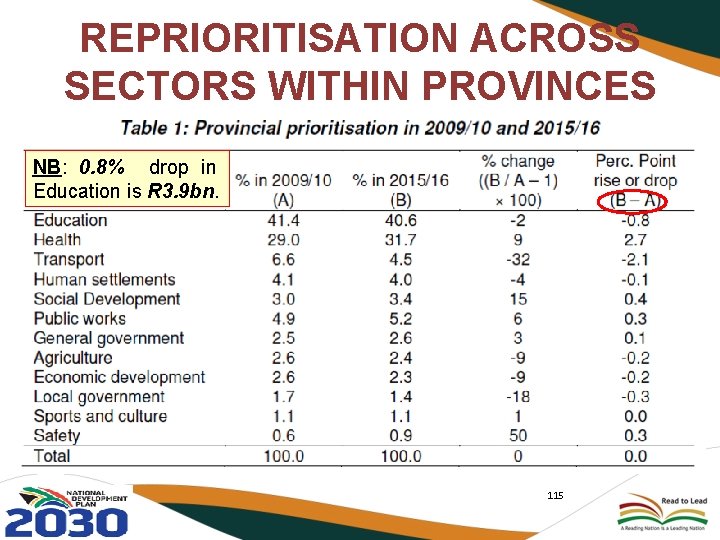
REPRIORITISATION ACROSS SECTORS WITHIN PROVINCES NB: 0. 8% drop in Education is R 3. 9 bn. 115
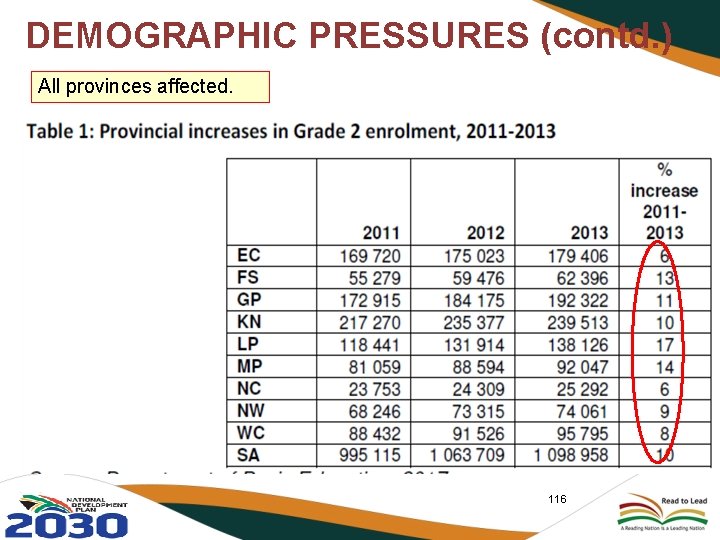
DEMOGRAPHIC PRESSURES (contd. ) All provinces affected. 116
WAGE PRESSURES v The average increase in the purchasing power of educators, relative to official CPI, resulting from aboveinflation CPI Cost of Living (Co. L) adjustments, came to 27% between 2007 and 2017. v In addition, annual notch progression comes to 1% a year. v A ‘demographic dividend’ in the form of a slowing increase in the average pushes the average cost of educators down by just 0. 3% (but this effect is increasing). v The above factors mean that the purchasing power (relative to CPI) of the average educator increased by 35% from 2007 to 2017. 117
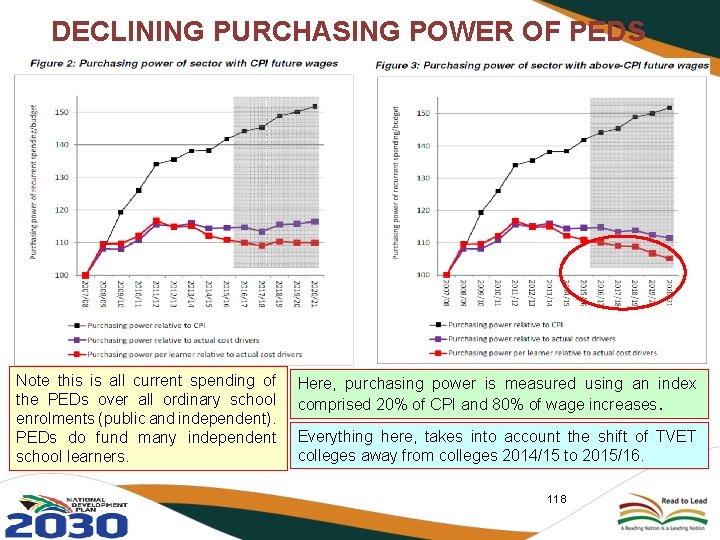
DECLINING PURCHASING POWER OF PEDs Note this is all current spending of the PEDs over all ordinary school enrolments (public and independent). PEDs do fund many independent school learners. Here, purchasing power is measured using an index comprised 20% of CPI and 80% of wage increases. Everything here, takes into account the shift of TVET colleges away from colleges 2014/15 to 2015/16. 118
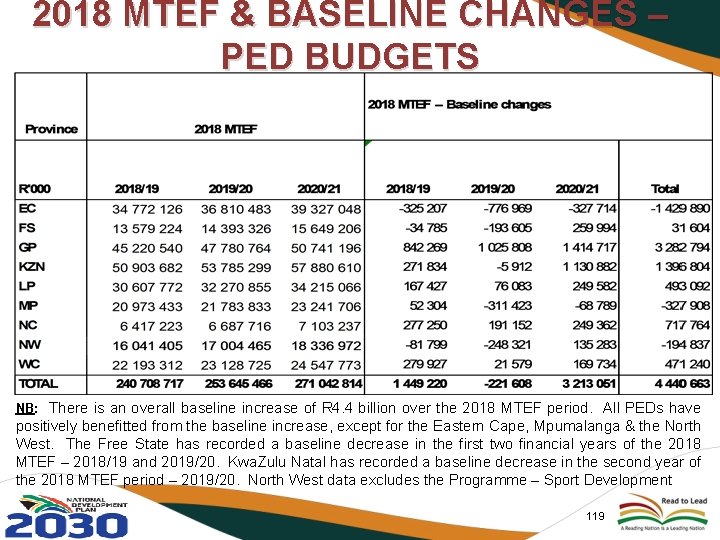
2018 MTEF & BASELINE CHANGES – PED BUDGETS NB: There is an overall baseline increase of R 4. 4 billion over the 2018 MTEF period. All PEDs have positively benefitted from the baseline increase, except for the Eastern Cape, Mpumalanga & the North West. The Free State has recorded a baseline decrease in the first two financial years of the 2018 MTEF – 2018/19 and 2019/20. Kwa. Zulu Natal has recorded a baseline decrease in the second year of the 2018 MTEF period – 2019/20. North West data excludes the Programme – Sport Development 119
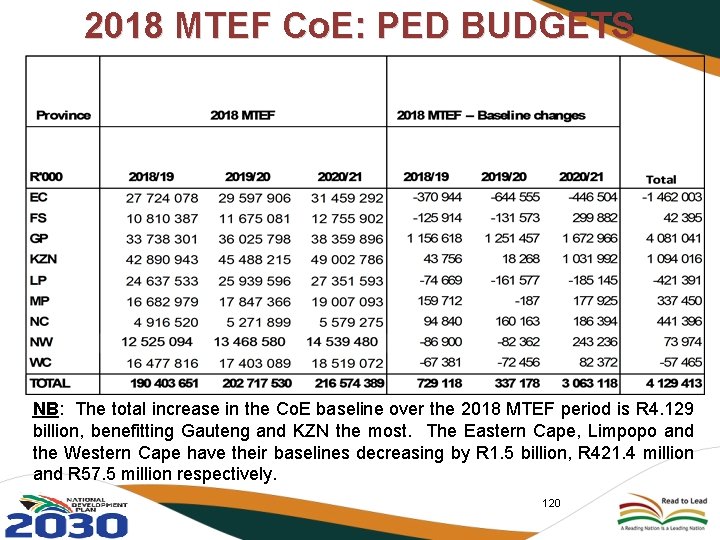
2018 MTEF Co. E: PED BUDGETS NB: The total increase in the Co. E baseline over the 2018 MTEF period is R 4. 129 billion, benefitting Gauteng and KZN the most. The Eastern Cape, Limpopo and the Western Cape have their baselines decreasing by R 1. 5 billion, R 421. 4 million and R 57. 5 million respectively. 120
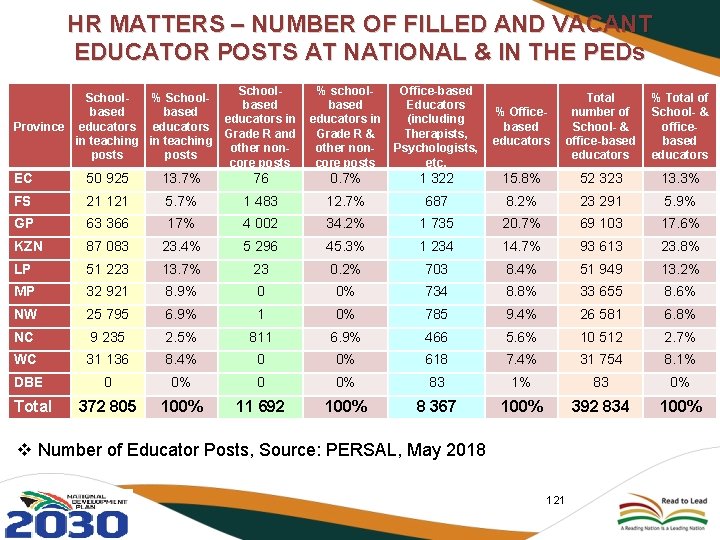
HR MATTERS – NUMBER OF FILLED AND VACANT EDUCATOR POSTS AT NATIONAL & IN THE PEDs School% school. Office-based School% Schoolbased Educators based % Officeeducators in (including Province educators based Grade R and Grade R & Therapists, in teaching educators other non. Psychologists, posts core posts etc. Total % Total of number of School- & office-based educators EC 50 925 13. 7% 76 0. 7% 1 322 15. 8% 52 323 13. 3% FS 21 121 5. 7% 1 483 12. 7% 687 8. 2% 23 291 5. 9% GP 63 366 17% 4 002 34. 2% 1 735 20. 7% 69 103 17. 6% KZN 87 083 23. 4% 5 296 45. 3% 1 234 14. 7% 93 613 23. 8% LP 51 223 13. 7% 23 0. 2% 703 8. 4% 51 949 13. 2% MP 32 921 8. 9% 0 0% 734 8. 8% 33 655 8. 6% NW 25 795 6. 9% 1 0% 785 9. 4% 26 581 6. 8% NC 9 235 2. 5% 811 6. 9% 466 5. 6% 10 512 2. 7% WC 31 136 8. 4% 0 0% 618 7. 4% 31 754 8. 1% DBE 0 0% 83 1% 83 0% 372 805 100% 11 692 100% 8 367 100% 392 834 100% Total v Number of Educator Posts, Source: PERSAL, May 2018 121
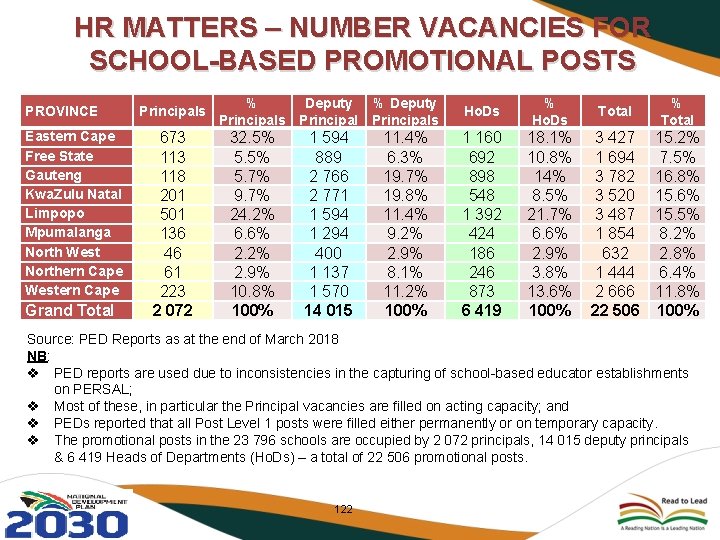
HR MATTERS – NUMBER VACANCIES FOR SCHOOL-BASED PROMOTIONAL POSTS PROVINCE Eastern Cape Free State Gauteng Kwa. Zulu Natal Limpopo Mpumalanga North West Northern Cape Western Cape Grand Total Principals 673 118 201 501 136 46 61 223 2 072 % Deputy Principals 32. 5% 5. 7% 9. 7% 24. 2% 6. 6% 2. 2% 2. 9% 10. 8% 100% 1 594 889 2 766 2 771 1 594 1 294 400 1 137 1 570 14 015 11. 4% 6. 3% 19. 7% 19. 8% 11. 4% 9. 2% 2. 9% 8. 1% 11. 2% 100% Ho. Ds Total % Total 1 160 692 898 548 1 392 424 186 246 873 6 419 18. 1% 10. 8% 14% 8. 5% 21. 7% 6. 6% 2. 9% 3. 8% 13. 6% 100% 3 427 1 694 3 782 3 520 3 487 1 854 632 1 444 2 666 22 506 15. 2% 7. 5% 16. 8% 15. 6% 15. 5% 8. 2% 2. 8% 6. 4% 11. 8% 100% Source: PED Reports as at the end of March 2018 NB: v PED reports are used due to inconsistencies in the capturing of school-based educator establishments on PERSAL; v Most of these, in particular the Principal vacancies are filled on acting capacity; and v PEDs reported that all Post Level 1 posts were filled either permanently or on temporary capacity. v The promotional posts in the 23 796 schools are occupied by 2 072 principals, 14 015 deputy principals & 6 419 Heads of Departments (Ho. Ds) – a total of 22 506 promotional posts. 122
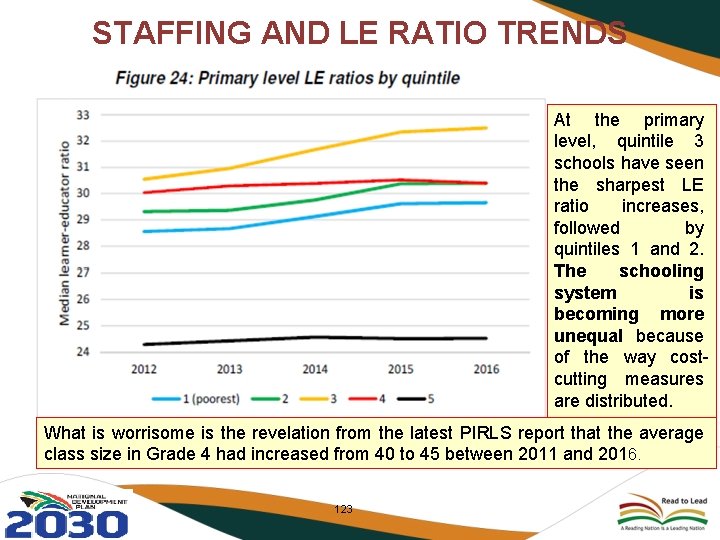
STAFFING AND LE RATIO TRENDS At the primary level, quintile 3 schools have seen the sharpest LE ratio increases, followed by quintiles 1 and 2. The schooling system is becoming more unequal because of the way costcutting measures are distributed. What is worrisome is the revelation from the latest PIRLS report that the average class size in Grade 4 had increased from 40 to 45 between 2011 and 2016. 123
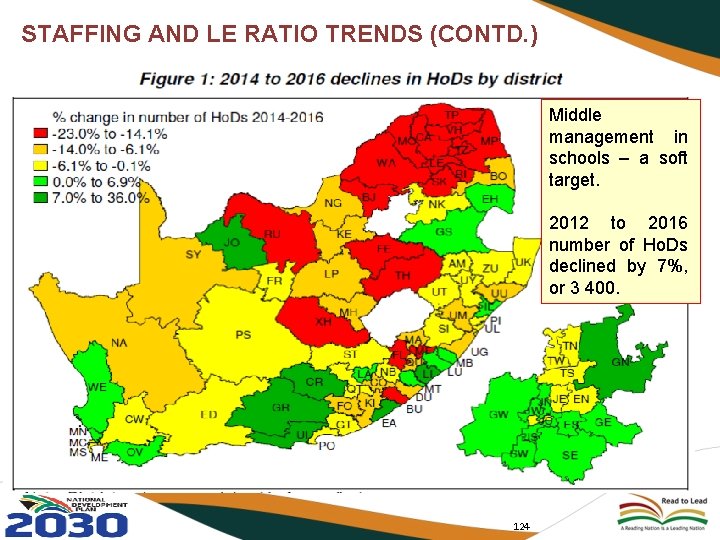
STAFFING AND LE RATIO TRENDS (CONTD. ) Middle management in schools – a soft target. 2012 to 2016 number of Ho. Ds declined by 7%, or 3 400. 124
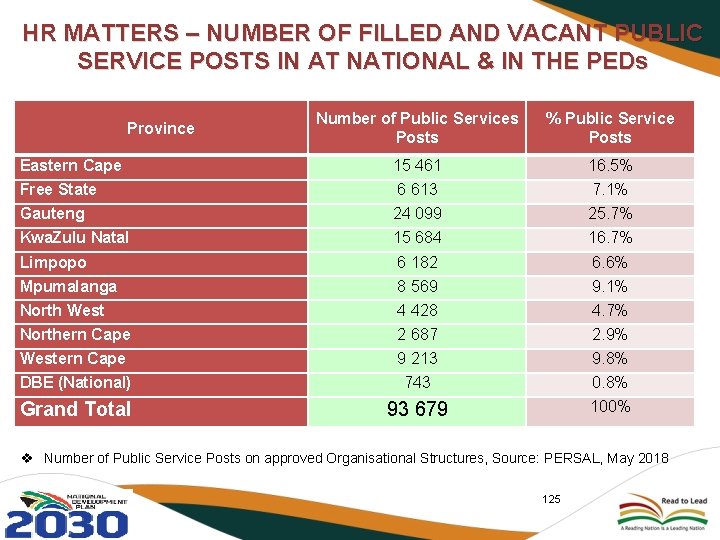
HR MATTERS – NUMBER OF FILLED AND VACANT PUBLIC SERVICE POSTS IN AT NATIONAL & IN THE PEDs Number of Public Services Posts % Public Service Posts Eastern Cape 15 461 16. 5% Free State 6 613 7. 1% Gauteng 24 099 25. 7% Kwa. Zulu Natal 15 684 16. 7% Limpopo 6 182 6. 6% Mpumalanga 8 569 9. 1% North West 4 428 4. 7% Northern Cape 2 687 2. 9% Western Cape 9 213 9. 8% DBE (National) 743 0. 8% Grand Total 93 679 100% Province v Number of Public Service Posts on approved Organisational Structures, Source: PERSAL, May 2018 125
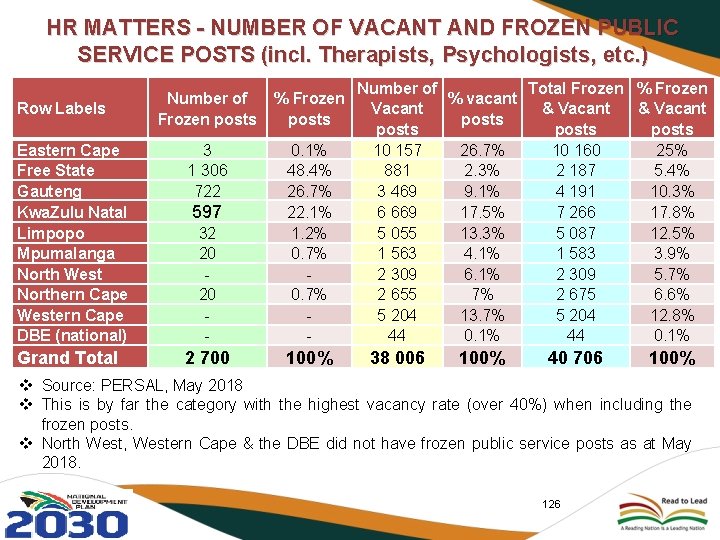
HR MATTERS - NUMBER OF VACANT AND FROZEN PUBLIC SERVICE POSTS (incl. Therapists, Psychologists, etc. ) Number of Frozen posts % Frozen posts Eastern Cape Free State Gauteng Kwa. Zulu Natal Limpopo Mpumalanga North West Northern Cape Western Cape DBE (national) 3 1 306 722 32 20 20 - 0. 1% 48. 4% 26. 7% 22. 1% 1. 2% 0. 7% - Grand Total 2 700 100% Row Labels 597 Number of Total Frozen % vacant Vacant & Vacant posts 10 157 26. 7% 10 160 25% 881 2. 3% 2 187 5. 4% 3 469 9. 1% 4 191 10. 3% 6 669 17. 5% 7 266 17. 8% 5 055 13. 3% 5 087 12. 5% 1 563 4. 1% 1 583 3. 9% 2 309 6. 1% 2 309 5. 7% 2 655 7% 2 675 6. 6% 5 204 13. 7% 5 204 12. 8% 44 0. 1% 38 006 100% 40 706 100% v Source: PERSAL, May 2018 v This is by far the category with the highest vacancy rate (over 40%) when including the frozen posts. v North West, Western Cape & the DBE did not have frozen public service posts as at May 2018. 126
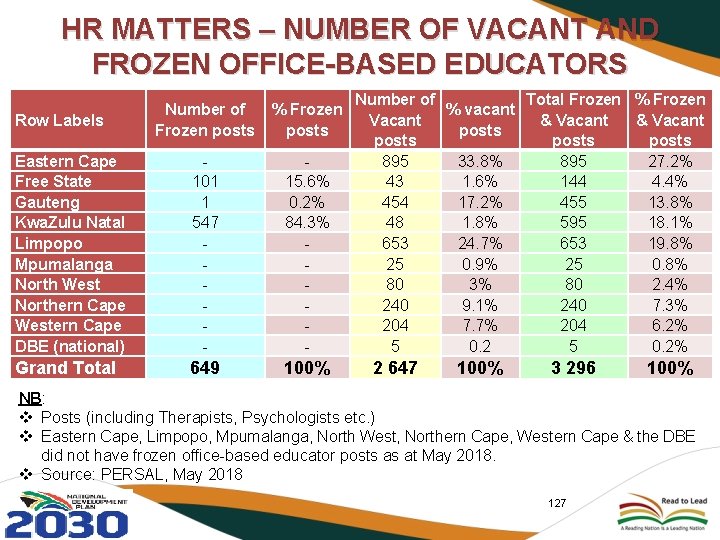
HR MATTERS – NUMBER OF VACANT AND FROZEN OFFICE-BASED EDUCATORS Number of Frozen posts % Frozen posts Eastern Cape Free State Gauteng Kwa. Zulu Natal Limpopo Mpumalanga North West Northern Cape Western Cape DBE (national) 101 1 547 - 15. 6% 0. 2% 84. 3% - Grand Total 649 100% Row Labels Number of Total Frozen % vacant Vacant & Vacant posts 895 33. 8% 895 27. 2% 43 1. 6% 144 4. 4% 454 17. 2% 455 13. 8% 48 1. 8% 595 18. 1% 653 24. 7% 653 19. 8% 25 0. 9% 25 0. 8% 80 3% 80 2. 4% 240 9. 1% 240 7. 3% 204 7. 7% 204 6. 2% 5 0. 2% 2 647 100% 3 296 100% NB: v Posts (including Therapists, Psychologists etc. ) v Eastern Cape, Limpopo, Mpumalanga, North West, Northern Cape, Western Cape & the DBE did not have frozen office-based educator posts as at May 2018. v Source: PERSAL, May 2018 127
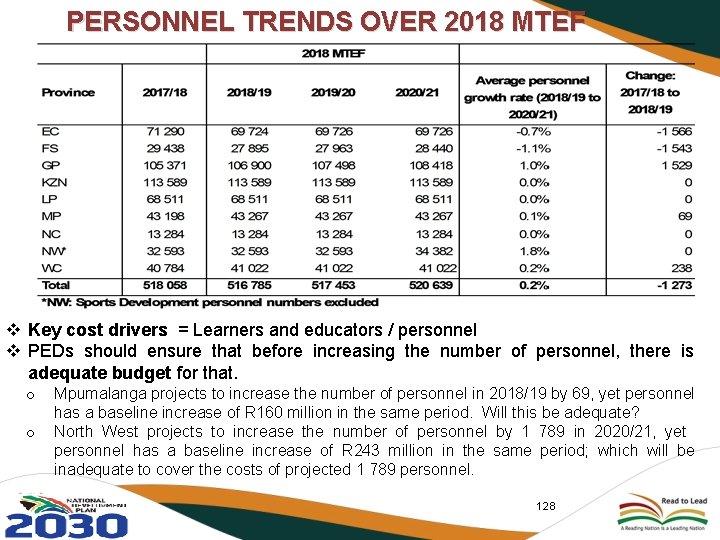
PERSONNEL TRENDS OVER 2018 MTEF v Key cost drivers = Learners and educators / personnel v PEDs should ensure that before increasing the number of personnel, there is adequate budget for that. o o Mpumalanga projects to increase the number of personnel in 2018/19 by 69, yet personnel has a baseline increase of R 160 million in the same period. Will this be adequate? North West projects to increase the number of personnel by 1 789 in 2020/21, yet personnel has a baseline increase of R 243 million in the same period; which will be inadequate to cover the costs of projected 1 789 personnel. 128
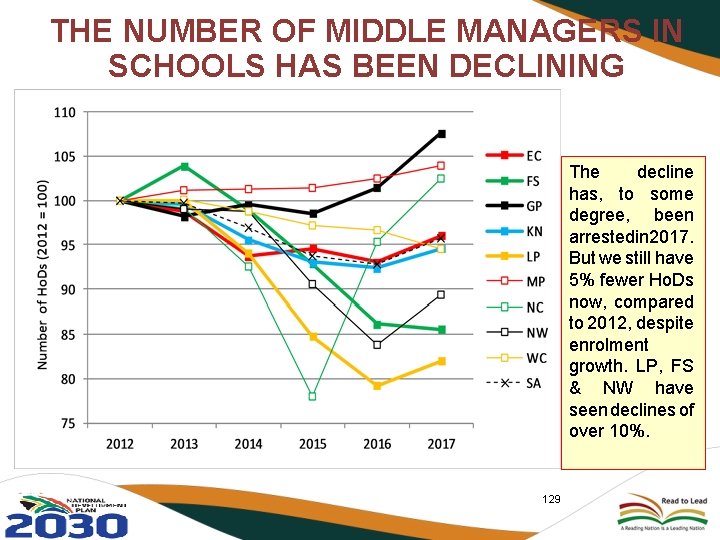
THE NUMBER OF MIDDLE MANAGERS IN SCHOOLS HAS BEEN DECLINING The decline has, to some degree, been arrestedin 2017. But we still have 5% fewer Ho. Ds now, compared to 2012, despite enrolment growth. LP, FS & NW have seen declines of over 10%. 129
IMPROVE THE EXTENT OF RETURNS ON OUR INVESTMENTS IN EDUCATION 130
Improve the Extent of Returns on our Investments in Education Ø By far the best way of improving individual and societal returns, is to improve the quality of learning and teaching across all grades. ØThe economic evidence is clear that ultimately it is weak competencies that hinder economic development and individual advancement. Ø The shift is currently towards better monitoring of who achieves e. g. 50% and 70% marks in key subjects, as opposed to just a pass. This emphasis needs to be strengthened further. 131
Improve the Extent of Returns on our Investments in Education Ø The Three Stream Model is part of a shift towards expanding participation, especially black and female participation, in more vocationally oriented school subjects such as Engineering Graphics and Design and Computer Applications Technology. 132
Improve the Extent of Returns on our Investments in Education… Ø International evidence suggests getting all South African youths to successfully complete 12 years of education should be considered a long-term undertaking which is heavily dependent on qualitative improvements from the primary level up. ØTo facilitate a situation in which youths fail to successfully complete 12 years, the DBE is currently re-considering a General Education Certificate in Grade 9. This would facilitate e. g. articulation between schools and TVET colleges. 133
RECOMMENDATION 134
Recommendation It is recommended that the Portfolio Committee discusses the progress, in respect of access to quality education, on the recommendations of the Report of the High Level Panel on the Assessment of Key Legislation and the Acceleration of Fundamental Change. 135
136
- Slides: 136