
Port Sector Issues Challenges Arvind Kumar Senior Adviser
- Slides: 43
Port Sector: Issues & Challenges Arvind Kumar* Senior Adviser (TR) Ministry of Road Transport & Highways February 2, 2012, Mount Abu Forum of Indian Regulators (FOIR) *Views are personal and do not necessarily reflect the views of the organization to which the author belongs
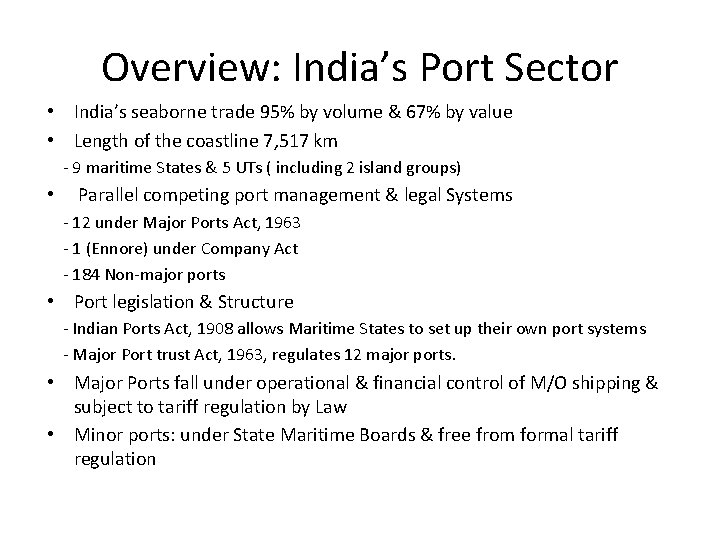
Overview: India’s Port Sector • India’s seaborne trade 95% by volume & 67% by value • Length of the coastline 7, 517 km - 9 maritime States & 5 UTs ( including 2 island groups) • Parallel competing port management & legal Systems - 12 under Major Ports Act, 1963 - 1 (Ennore) under Company Act - 184 Non-major ports • Port legislation & Structure - Indian Ports Act, 1908 allows Maritime States to set up their own port systems - Major Port trust Act, 1963, regulates 12 major ports. • Major Ports fall under operational & financial control of M/O shipping & subject to tariff regulation by Law • Minor ports: under State Maritime Boards & free from formal tariff regulation
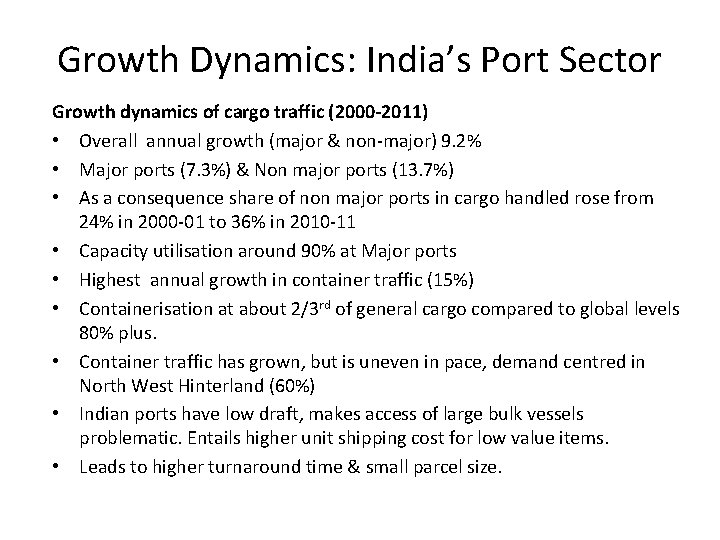
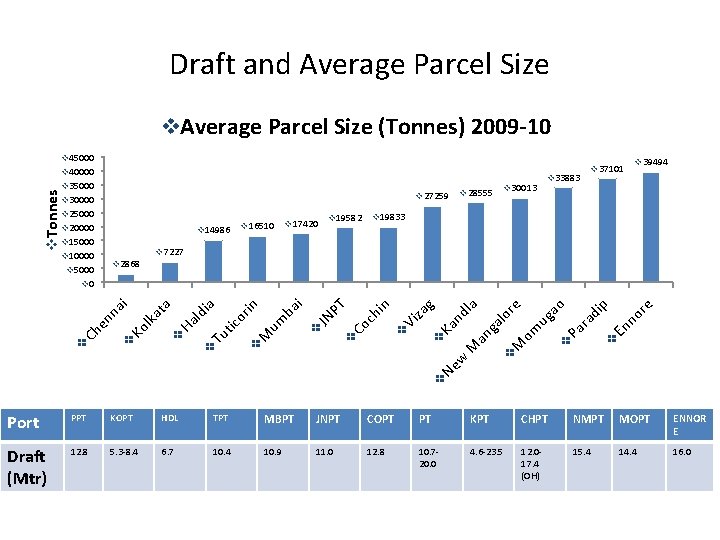
Growth Dynamics: India’s Port Sector Growth dynamics of cargo traffic (2000 -2011) • Overall annual growth (major & non-major) 9. 2% • Major ports (7. 3%) & Non major ports (13. 7%) • As a consequence share of non major ports in cargo handled rose from 24% in 2000 -01 to 36% in 2010 -11 • Capacity utilisation around 90% at Major ports • Highest annual growth in container traffic (15%) • Containerisation at about 2/3 rd of general cargo compared to global levels 80% plus. • Container traffic has grown, but is uneven in pace, demand centred in North West Hinterland (60%) • Indian ports have low draft, makes access of large bulk vessels problematic. Entails higher unit shipping cost for low value items. • Leads to higher turnaround time & small parcel size.
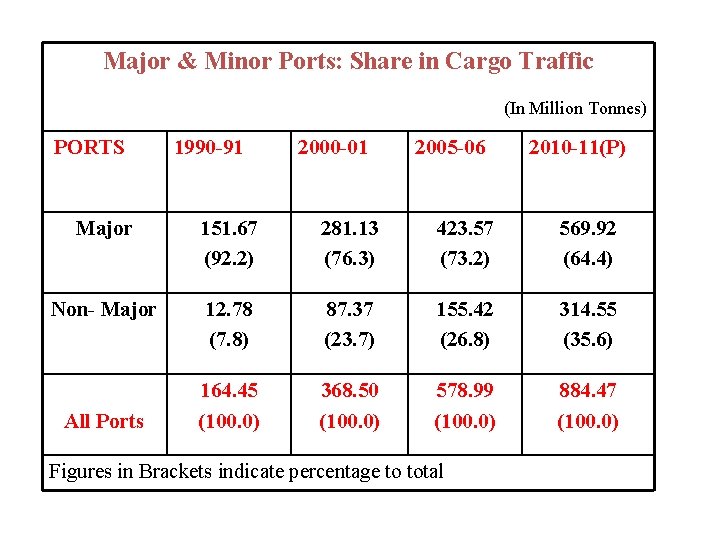
Major & Minor Ports: Share in Cargo Traffic (In Million Tonnes) PORTS 1990 -91 2000 -01 2005 -06 2010 -11(P) Major 151. 67 (92. 2) 281. 13 (76. 3) 423. 57 (73. 2) 569. 92 (64. 4) Non- Major 12. 78 (7. 8) 87. 37 (23. 7) 155. 42 (26. 8) 314. 55 (35. 6) 164. 45 (100. 0) 368. 50 (100. 0) 578. 99 (100. 0) 884. 47 (100. 0) All Ports Figures in Brackets indicate percentage to total
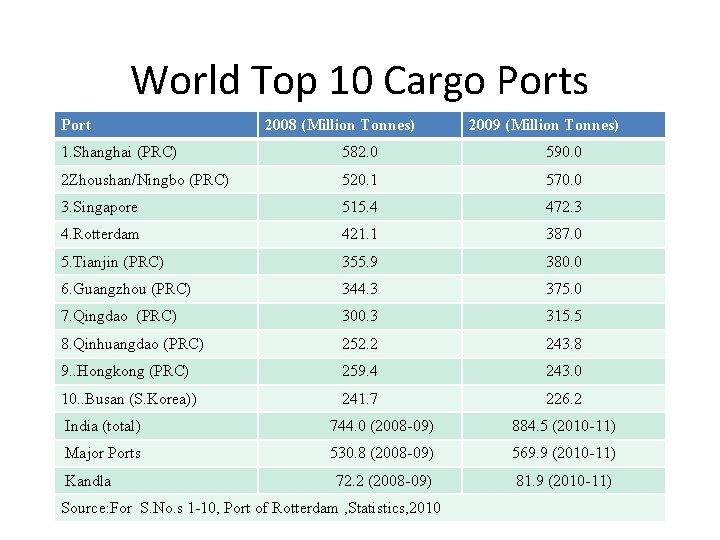
World Top 10 Cargo Ports Port 2008 (Million Tonnes) 2009 (Million Tonnes) 1. Shanghai (PRC) 582. 0 590. 0 2 Zhoushan/Ningbo (PRC) 520. 1 570. 0 3. Singapore 515. 4 472. 3 4. Rotterdam 421. 1 387. 0 5. Tianjin (PRC) 355. 9 380. 0 6. Guangzhou (PRC) 344. 3 375. 0 7. Qingdao (PRC) 300. 3 315. 5 8. Qinhuangdao (PRC) 252. 2 243. 8 9. . Hongkong (PRC) 259. 4 243. 0 10. . Busan (S. Korea)) 241. 7 226. 2 India (total) 744. 0 (2008 -09) 884. 5 (2010 -11) Major Ports 530. 8 (2008 -09) 569. 9 (2010 -11) 72. 2 (2008 -09) 81. 9 (2010 -11) Kandla Source: For S. No. s 1 -10, Port of Rotterdam , Statistics, 2010
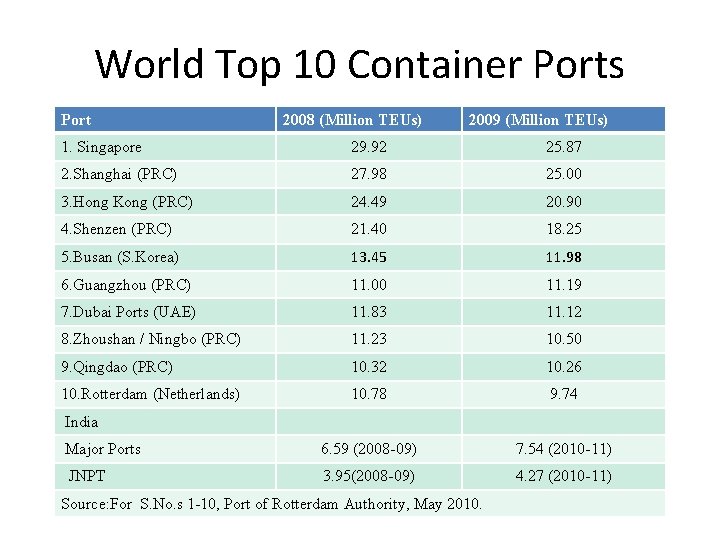
World Top 10 Container Ports Port 2008 (Million TEUs) 2009 (Million TEUs) 1. Singapore 29. 92 25. 87 2. Shanghai (PRC) 27. 98 25. 00 3. Hong Kong (PRC) 24. 49 20. 90 4. Shenzen (PRC) 21. 40 18. 25 5. Busan (S. Korea) 13. 45 11. 98 6. Guangzhou (PRC) 11. 00 11. 19 7. Dubai Ports (UAE) 11. 83 11. 12 8. Zhoushan / Ningbo (PRC) 11. 23 10. 50 9. Qingdao (PRC) 10. 32 10. 26 10. Rotterdam (Netherlands) 10. 78 9. 74 Major Ports 6. 59 (2008 -09) 7. 54 (2010 -11) JNPT 3. 95(2008 -09) 4. 27 (2010 -11) India Source: For S. No. s 1 -10, Port of Rotterdam Authority, May 2010.
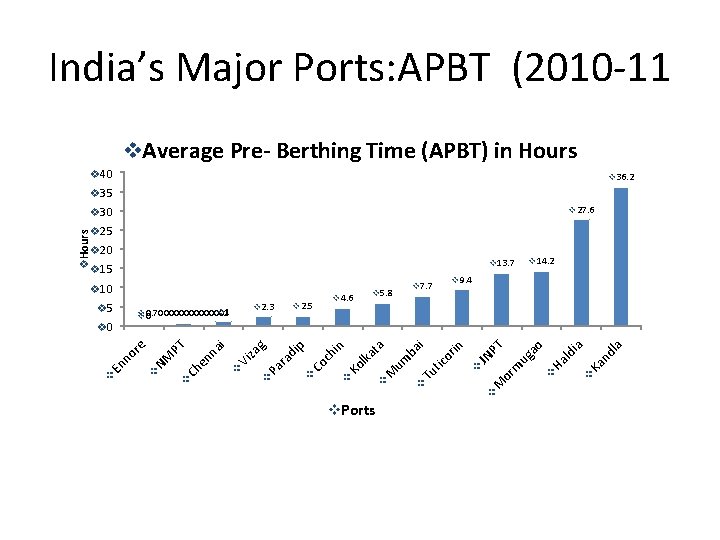
India’s Major Ports: APBT (2010 -11 v. Average Pre- Berthing Time (APBT) in Hours v 40 v 36. 2 v 35 v 27. 6 v 30 v. Hours v 25 v 20 v 13. 7 v 15 v. Ports M a Ka nd l ia v Ha ld o v or m ug a PT JN v or in v v Tu tic um ba i ta M v 9. 4 v 7. 7 v 5. 8 Ko lka hi n v Co c v Pa ra za Vi v di p g i na Ch en v NM v v En no r e v 0 PT v 1 v v 0. 700000001 0 v 4. 6 v 2. 5 v 2. 3 v v 5 v v 10 v 14. 2
Draft and Average Parcel Size v. Average Parcel Size (Tonnes) 2009 -10 v. Tonnes v 27259 v 14986 v 19833 re no v En ra Pa om ug or ga l di p ao e a Ka n v Vi v dl g za n hi v Co c JN PT i v ba um M Tu tic or in a ld i Ha TPT MBPT JNPT COPT PT KPT CHPT NMPT MOPT ENNOR E Draft (Mtr) 12. 8 5. 3 -8. 4 6. 7 10. 4 10. 9 11. 0 12. 8 10. 720. 0 4. 6 -23. 5 12. 017. 4 (OH) 15. 4 14. 4 16. 0 v v Ne w v HDL M KOPT M PPT v Port v v v lka ta i v 19582 v Ko na en v 17420 v 33883 v 30013 v 39494 v 37101 v 7227 v 2868 Ch v 16510 v 28555 an v 45000 v 40000 v 35000 v 30000 v 25000 v 20000 v 15000 v 10000 v 5000 v 0
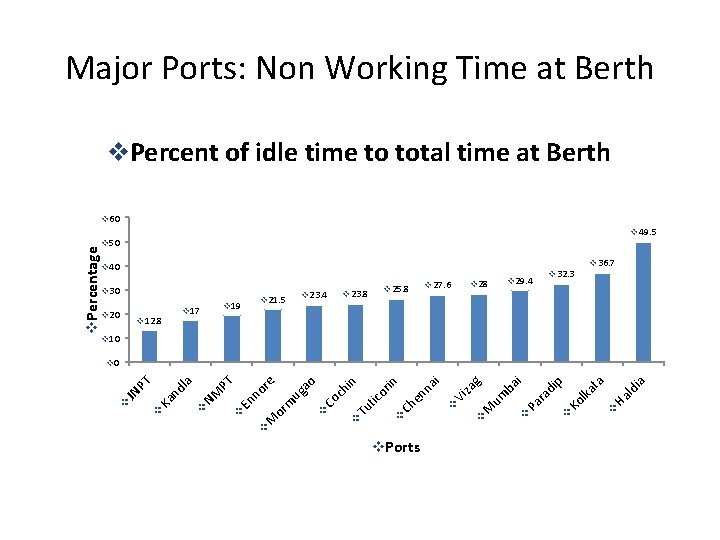
Major Ports: Non Working Time at Berth v. Percent of idle time to total time at Berth v 60 v 49. 5 v. Percentage v 50 v 40 v 30 v 20 v 12. 8 v 21. 5 v 19 v 17 v 23. 4 v 23. 8 v 29. 4 v 28 v 27. 6 v 25. 8 v 32. 3 v 36. 7 v 10 v. Ports ia Ha ld ta v v Ko lka di p ra Pa v um ba i g M v v Vi za ai nn v Ch e or in Tu tic hi n v Co c v v M or m ug a o e no r En v NM PT a v Ka nd l v v JN PT v 0
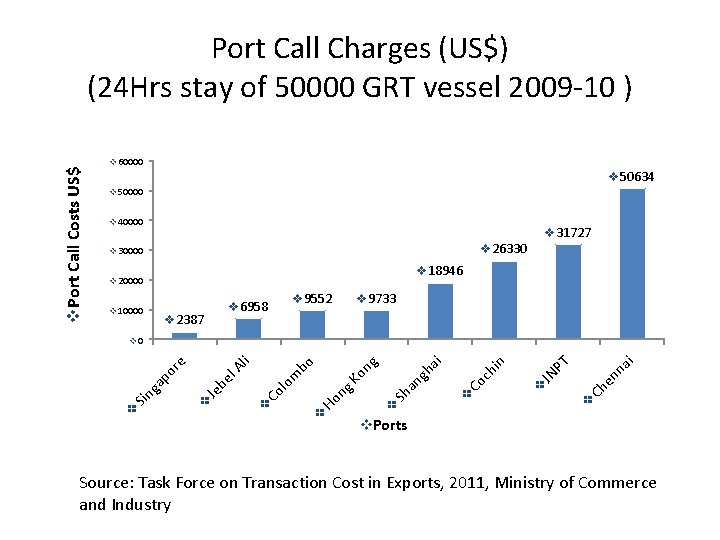
v. Port Call Costs US$ Port Call Charges (US$) (24 Hrs stay of 50000 GRT vessel 2009 -10 ) v 60000 v 50634 v 50000 v 40000 v 26330 v 30000 v 18946 v 20000 v 10000 v 31727 v 2387 v 9733 v 9552 v 6958 ai nn Ch e v JN PT v n v Co c hi i v Sh Ko n v Ho ng lo Co v an gh a g bo m Al i el Je b v v Sin ga p or e v 0 v. Ports Source: Task Force on Transaction Cost in Exports, 2011, Ministry of Commerce and Industry
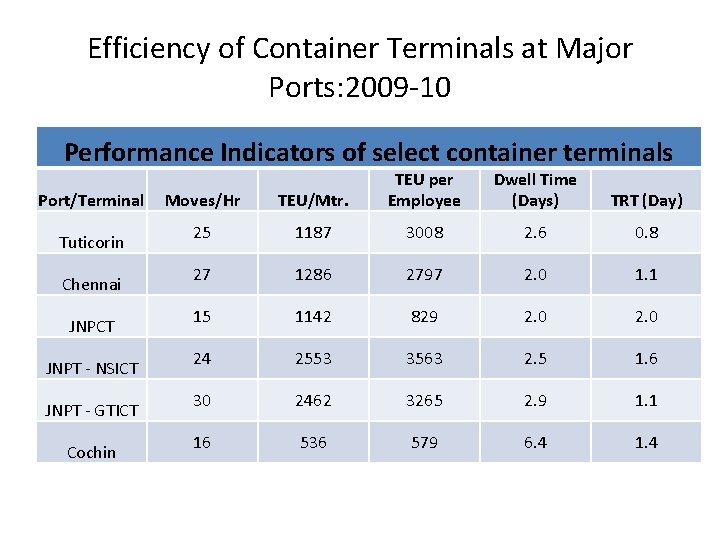
Efficiency of Container Terminals at Major Ports: 2009 -10 Performance Indicators of select container terminals Port/Terminal Tuticorin Chennai JNPCT JNPT - NSICT JNPT - GTICT Cochin Moves/Hr TEU/Mtr. TEU per Employee Dwell Time (Days) TRT (Day) 25 1187 3008 2. 6 0. 8 27 1286 2797 2. 0 1. 1 15 1142 829 2. 0 24 2553 3563 2. 5 1. 6 30 2462 3265 2. 9 1. 1 16 536 579 6. 4 1. 4
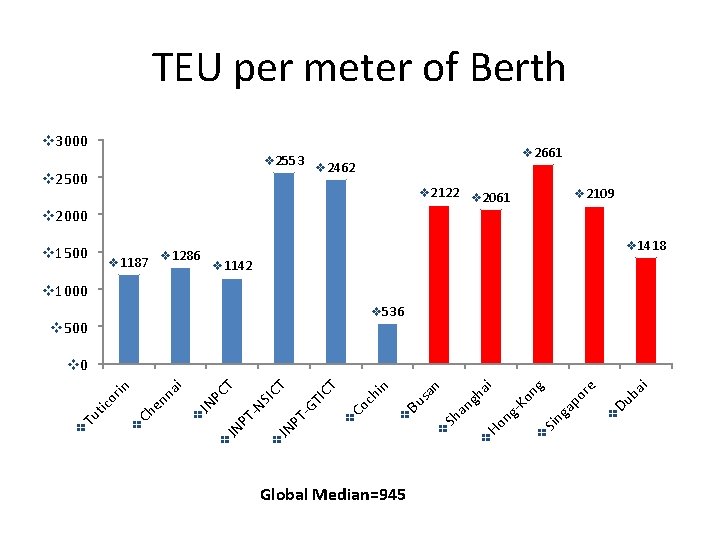
TEU per meter of Berth v 3000 v 2553 v 2500 v 2661 v 2462 v 2122 v 2061 v 2109 v 2000 v 1500 v 1187 v 1286 v 1418 v 1142 v 1000 v 536 v 500 ai Du b v ga p or e g Sin v ng -K on ai Ho v v Sh an Bu v Global Median=945 gh sa n n v Co c hi T v JN P TG TI C IC NS PT - JN v T T JN PC v Ch e v v Tu tic or nn in ai v 0
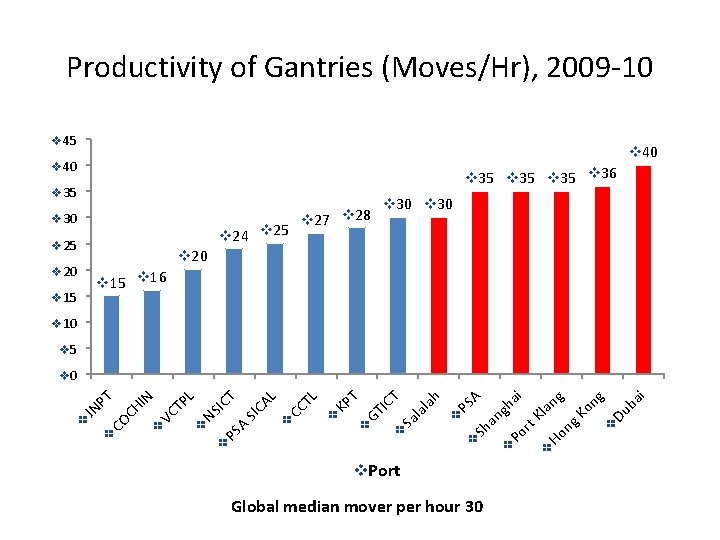
Productivity of Gantries (Moves/Hr), 2009 -10 v 45 v 40 v 35 v 36 v 35 v 30 v 24 v 25 v 20 v 15 v 27 v 28 v 30 v 20 v 15 v 16 v 10 v 5 v. Port Global median mover per hour 30 v v Sh v ai Du b an gh ai Po rt Kl v Ho ang ng Ko ng PS A v la h Sa la T v GT IC T v KP v v JN PT v CO CH IN v VC TP L v NS I v PS CT A SI CA L v CC TL v 0
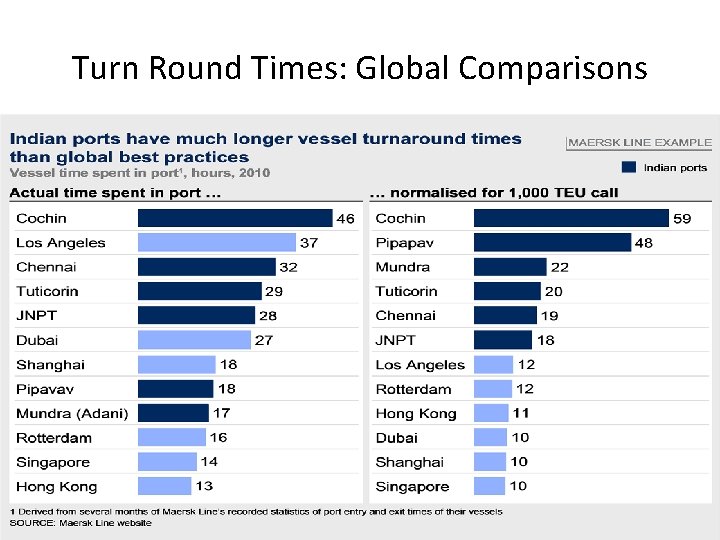
Turn Round Times: Global Comparisons
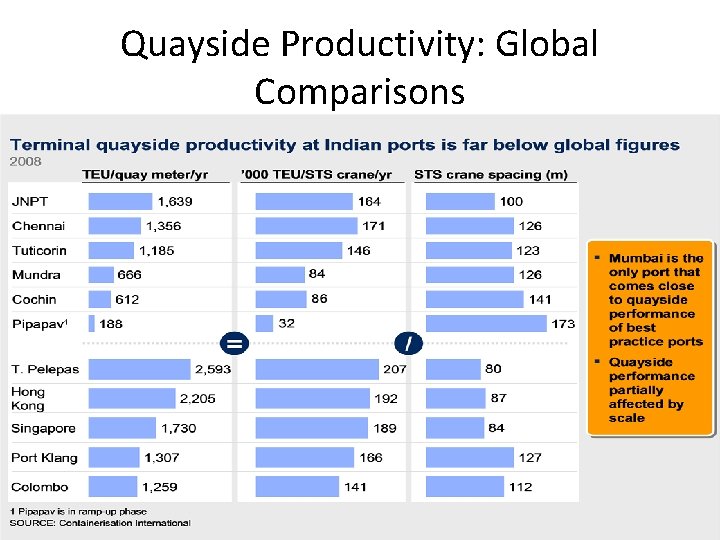
Quayside Productivity: Global Comparisons
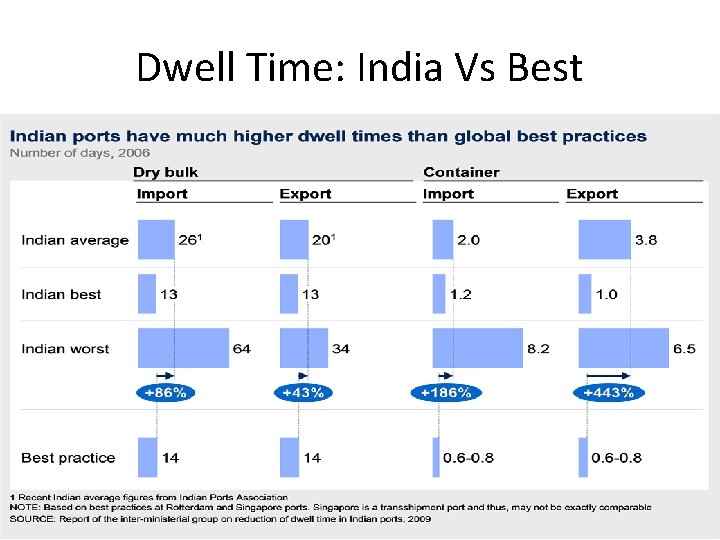
Dwell Time: India Vs Best
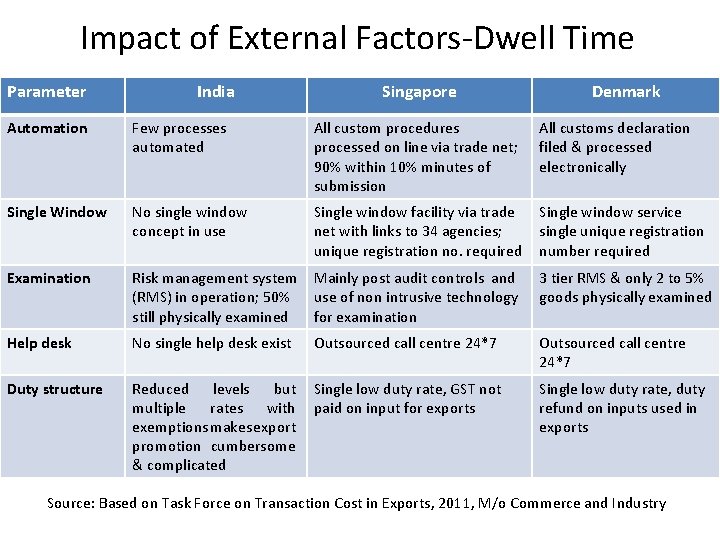
Impact of External Factors-Dwell Time Parameter India Singapore Denmark Automation Few processes automated All custom procedures processed on line via trade net; 90% within 10% minutes of submission All customs declaration filed & processed electronically Single Window No single window concept in use Single window facility via trade net with links to 34 agencies; unique registration no. required Single window service single unique registration number required Examination Risk management system (RMS) in operation; 50% still physically examined Mainly post audit controls and use of non intrusive technology for examination 3 tier RMS & only 2 to 5% goods physically examined Help desk No single help desk exist Outsourced call centre 24*7 Duty structure Reduced levels but multiple rates with exemptions makes export promotion cumbersome & complicated Single low duty rate, GST not paid on input for exports Single low duty rate, duty refund on inputs used in exports Source: Based on Task Force on Transaction Cost in Exports, 2011, M/o Commerce and Industry
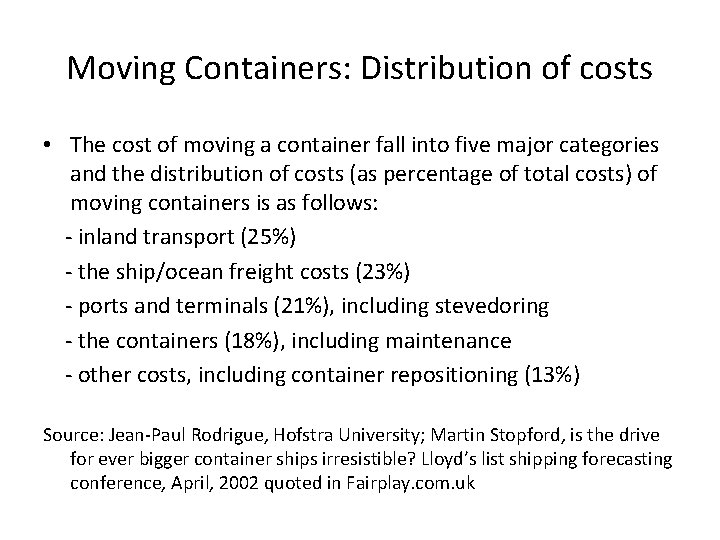
Moving Containers: Distribution of costs • The cost of moving a container fall into five major categories and the distribution of costs (as percentage of total costs) of moving containers is as follows: - inland transport (25%) - the ship/ocean freight costs (23%) - ports and terminals (21%), including stevedoring - the containers (18%), including maintenance - other costs, including container repositioning (13%) Source: Jean-Paul Rodrigue, Hofstra University; Martin Stopford, is the drive for ever bigger container ships irresistible? Lloyd’s list shipping forecasting conference, April, 2002 quoted in Fairplay. com. uk
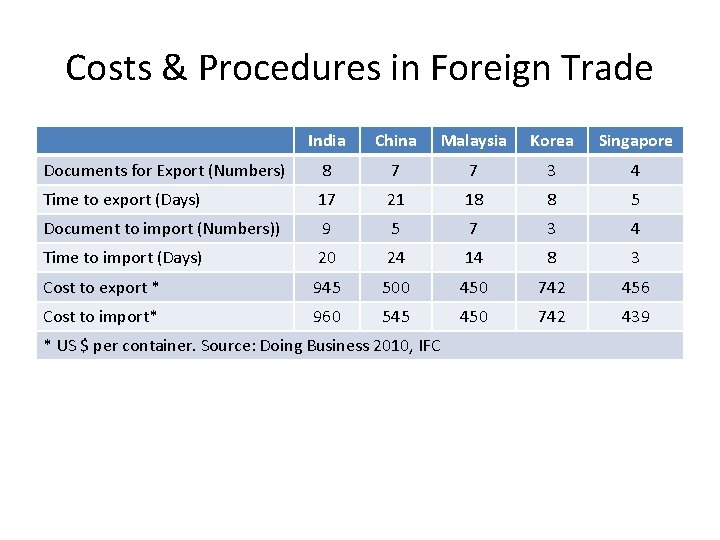
Costs & Procedures in Foreign Trade India China Malaysia Korea Singapore Documents for Export (Numbers) 8 7 7 3 4 Time to export (Days) 17 21 18 8 5 Document to import (Numbers)) 9 5 7 3 4 Time to import (Days) 20 24 14 8 3 Cost to export * 945 500 450 742 456 Cost to import* 960 545 450 742 439 * US $ per container. Source: Doing Business 2010, IFC
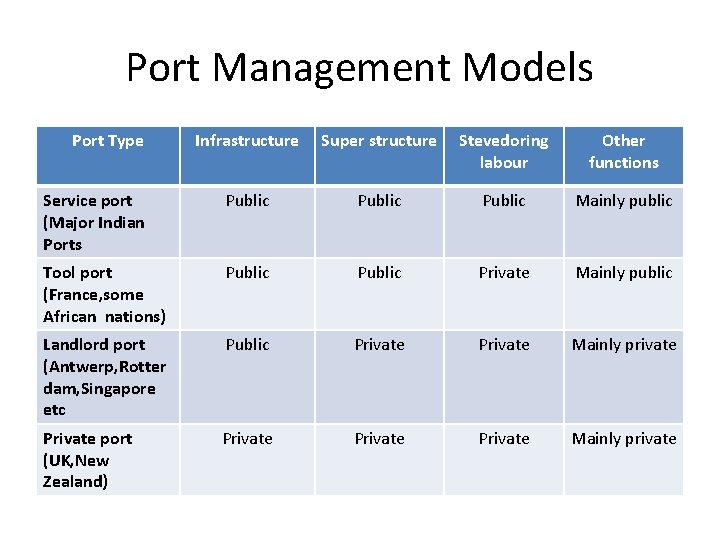
Port Management Models Port Type Infrastructure Super structure Stevedoring labour Other functions Service port (Major Indian Ports Public Mainly public Tool port (France, some African nations) Public Private Mainly public Landlord port (Antwerp, Rotter dam, Singapore etc Public Private Mainly private Private port (UK, New Zealand) Private Mainly private
When to Regulate? • Market power • Imperfect & Asymmetric information: Operator (Agent) has an informational advantage over the Government/Regulator (Principal) • Externalities: occur when production or consumption of goods/services impose costs/benefits on others which are not reflected in the prices charged for the goods & services being provided • Joint provision & consumption
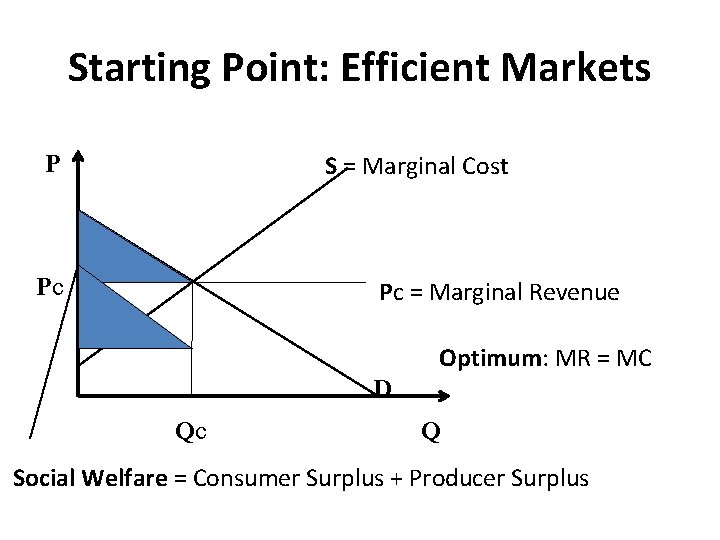
Starting Point: Efficient Markets P S = Marginal Cost Pc Pc = Marginal Revenue Optimum: MR = MC D Qc Q Social Welfare = Consumer Surplus + Producer Surplus
Philosophy of Regulation • Case for Economic Regulation exists when: – Activity or industry has elements which bestow advantages of natural monopoly, it occurs when: • Industry/Activity has large sunk costs and falling average costs • Significant barriers to entry • Locational advantages which bestow near monopoly advantages on the operator
The economic Characteristics of Port Infrastructure • The basic port infrastructure is: - indivisible & requires large sunk costs -long lived -constructed in a specific space for a specific use • => Perfect conditions for the existence of scale economies • The most obvious difference with other public services: - Multiple services associated with the port infrastructure • This multitasking dimension matters a lot when thinking about economic regulation, including pricing - the infrastructure provide a service: you can charge a price - the infrastructure is an input: you can charge a price
Why Tariff Regulation in Ports • Port Trusts (PTs) can not regulate their own tariffs or of Terminal Operators due to – Conflict of Interest – Being Competitors – Need to safeguard user’s interests • Therefore, the need for 3 rd Party Neutral Regulator
Charter of TAMP To fix scale of rates : • For services rendered by the ports • Rentals for use of port trust properties • Fix charges for services rendered by port operators (BOT, concessionaries etc. under MPT • Prescribe conditions for services rendered by Port Trusts/operators. Guiding Principles • Safeguard the interest of port users; • Just and fair return to operators • Promote economy in use of resources & efficiency
Tariff Guidelines 2005: Approach • Anchored on cost plus basis • Cost as per estimate for future & ROCE determine tariff • Revenue share/royalty not treated as cost - Except in cases prior to July 29, 2003 subject to a maximum of second lowest bidder • ROCE is on sum of net fixed assets plus working capital • Return on capital allowed 16% as of now full ROCE allowed for capacity utilization of 60% & above.
Tariff Guidelines 2005 Approach • Tariff approved by TAMP valid for 3 years • Rates fixed by TAMP are ceiling rates -Ports/operators enjoy flexibility to offer rebates • Tariffs fixed are -Vessel related (port dues, berth hire on GRT basis) -Pilotage sliding rates (higher for higher GRT) -Cargo related (wharfage rates) based on cargo handling • Concessional tariff for coastal cargo/containers/vessels -60% of normal tariff applicable -coal, POL & iron ore are not eligible.
Tariff Guidelines 2005: Issues • Information intensive exercise • Too much emphasis on individual operator’s profitability • Weak incentives for efficiency • Disallowance for revenue share in tariff and its long term effects – Partial pass through of royalty/revenue share for private terminals which came prior to July 2003.
Tariff Guidelines 2008 • Simple & Norm based • No provision for midterm review – Unchanged Tariff for 30 years • May not encourage regular investment by operators or • May bestow windfall gains on operators if any change in planning/parameters • Norms do not cover all areas of operations
Upfront Tariff Guidelines 2008 • Committee on infrastructure found that combining cost plus model of tariff and revenue share model of bidding was untenable • Recommendations – Upfront tariff – Uniform tariff cap at the same port – Normative cost based with fair return on capital – Capacity utilisation of 75% – Tariff caps to be reviewed once every five years to adjust for any unforeseen events – Tariff indexed to 60% of WPI variation • Guidelines for upfront tariff setting for PPP projects – Notified in the Gazette on 26. 2. 2008
Salient Features of 2008 Guidelines • TAMP to fix upfront tariff cap before bidding based on proposals from major ports – Bid document to incorporate the upfront tariff – Tariff cap set for a port would be applicable to all projects bid out subsequently for identical cargo during the next five years • Approach – Normative cost based approach – Estimated capital and operating cost based on norms prescribed – Fair rate of return on capital employed (presently @ 16%) • Annual indexation of upfront tariff – 60% of the variation in the WPI of the relevant year • TAMP to review tariff caps – Once in five years for extra-ordinary events – Revised tariff caps applicable to subsequent PPP projects
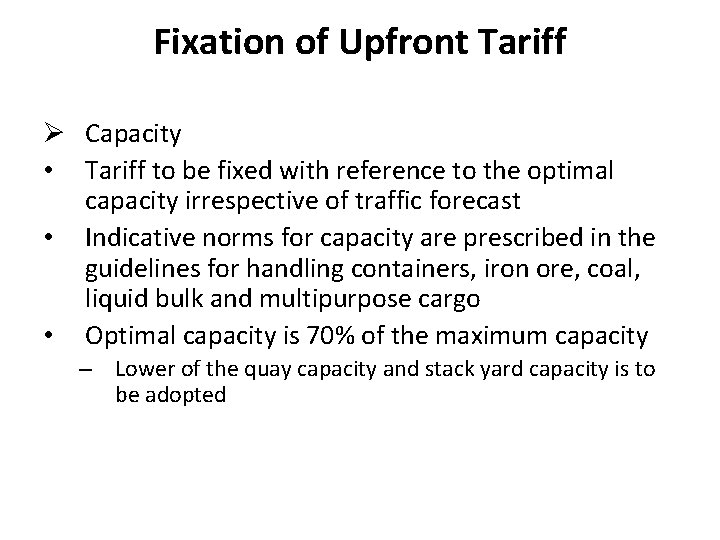
Fixation of Upfront Tariff Ø Capacity • Tariff to be fixed with reference to the optimal capacity irrespective of traffic forecast • Indicative norms for capacity are prescribed in the guidelines for handling containers, iron ore, coal, liquid bulk and multipurpose cargo • Optimal capacity is 70% of the maximum capacity – Lower of the quay capacity and stack yard capacity is to be adopted
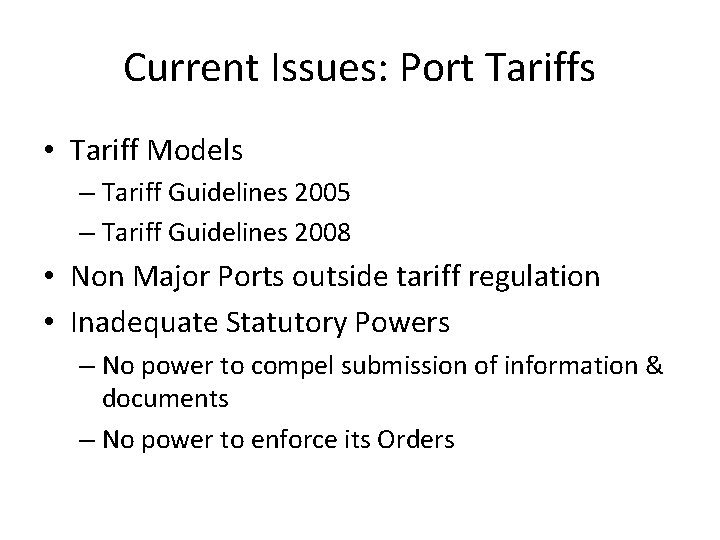
Current Issues: Port Tariffs • Tariff Models – Tariff Guidelines 2005 – Tariff Guidelines 2008 • Non Major Ports outside tariff regulation • Inadequate Statutory Powers – No power to compel submission of information & documents – No power to enforce its Orders
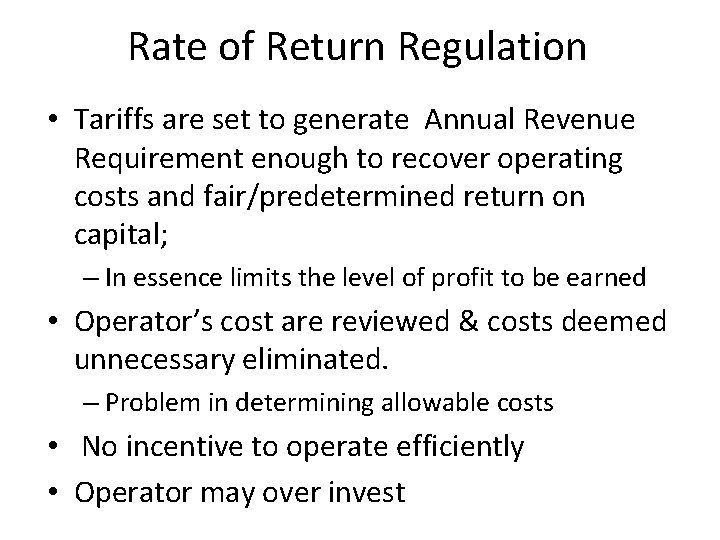
Rate of Return Regulation • Tariffs are set to generate Annual Revenue Requirement enough to recover operating costs and fair/predetermined return on capital; – In essence limits the level of profit to be earned • Operator’s cost are reviewed & costs deemed unnecessary eliminated. – Problem in determining allowable costs • No incentive to operate efficiently • Operator may over invest
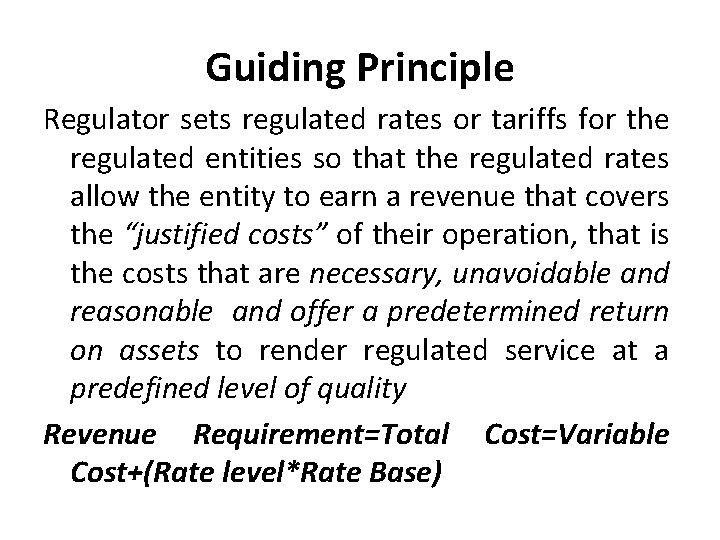
Guiding Principle Regulator sets regulated rates or tariffs for the regulated entities so that the regulated rates allow the entity to earn a revenue that covers the “justified costs” of their operation, that is the costs that are necessary, unavoidable and reasonable and offer a predetermined return on assets to render regulated service at a predefined level of quality Revenue Requirement=Total Cost=Variable Cost+(Rate level*Rate Base)
Pitfalls of Cost Plus Regulation • Motivation for over-investment (increased rate base) – ‘gold plating’ • No motivation to increase productive efficiency • Continuous pressure for price increase • No incentive for selection of right equipment • Information asymmetry at the regulator’s side: - no up-to-date operating cost information - no data on future business plans (investments, costreduction, etc. ), - obscure picture on demand side.
Port pricing Models: Theoretical Perspective • Presence of economies of scale => problem to implement a first best pricing policy (price equal to marginal cost) => not possible to recover investment costs. • Second-best alternatives, common to other transport sectors, are: - Average-cost pricing, - Two- part tariffs, - Long-run marginal cost pricing, and the use of rental fees from concessionaires.
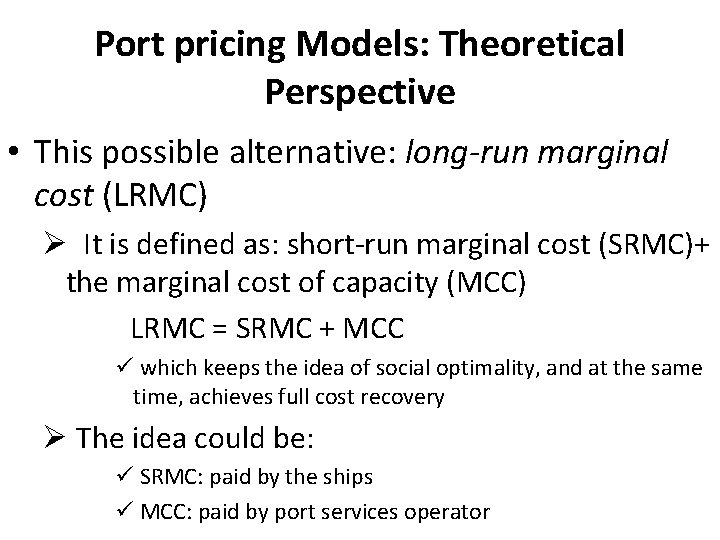
Port pricing Models: Theoretical Perspective • This possible alternative: long-run marginal cost (LRMC) Ø It is defined as: short-run marginal cost (SRMC)+ the marginal cost of capacity (MCC) LRMC = SRMC + MCC ü which keeps the idea of social optimality, and at the same time, achieves full cost recovery Ø The idea could be: ü SRMC: paid by the ships ü MCC: paid by port services operator
Regulation Versus Market Failure • • • Are there regulatory errors in setting prices? Is regulation intrusive and costly? Does it discourage long term investment? Too much focus on short term cost/prices Is regulatory innovation desirable
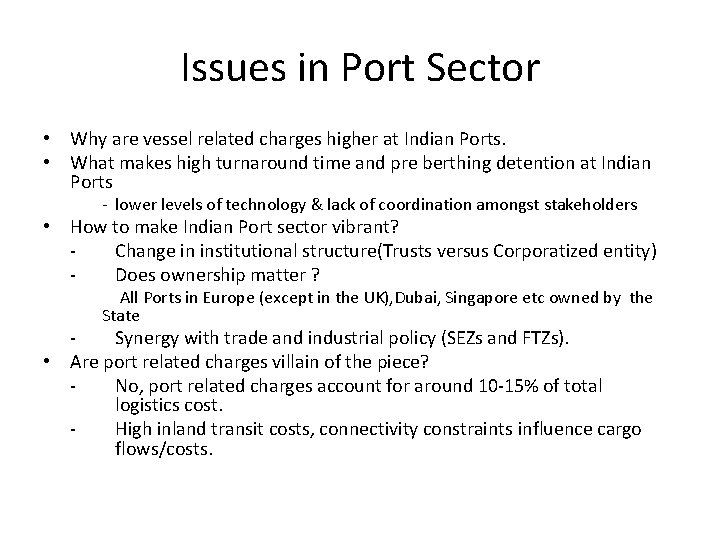
Issues in Port Sector • Why are vessel related charges higher at Indian Ports. • What makes high turnaround time and pre berthing detention at Indian Ports - lower levels of technology & lack of coordination amongst stakeholders • How to make Indian Port sector vibrant? Change in institutional structure(Trusts versus Corporatized entity) Does ownership matter ? All Ports in Europe (except in the UK), Dubai, Singapore etc owned by the State Synergy with trade and industrial policy (SEZs and FTZs). • Are port related charges villain of the piece? No, port related charges account for around 10 -15% of total logistics cost. High inland transit costs, connectivity constraints influence cargo flows/costs.
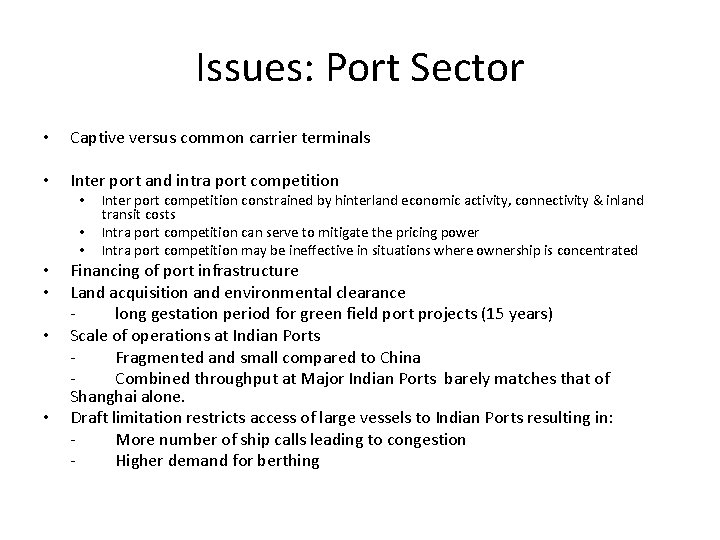
Issues: Port Sector • Captive versus common carrier terminals • Inter port and intra port competition • • Inter port competition constrained by hinterland economic activity, connectivity & inland transit costs Intra port competition can serve to mitigate the pricing power Intra port competition may be ineffective in situations where ownership is concentrated Financing of port infrastructure Land acquisition and environmental clearance long gestation period for green field port projects (15 years) Scale of operations at Indian Ports Fragmented and small compared to China Combined throughput at Major Indian Ports barely matches that of Shanghai alone. Draft limitation restricts access of large vessels to Indian Ports resulting in: More number of ship calls leading to congestion Higher demand for berthing
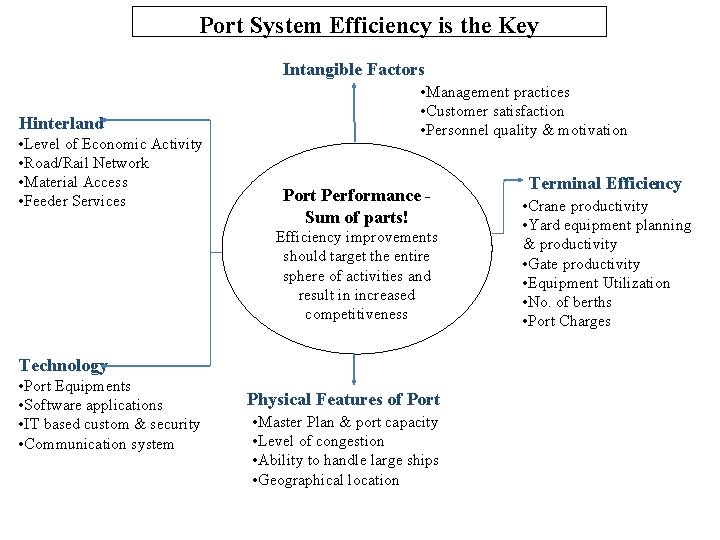
Port System Efficiency is the Key Intangible Factors Hinterland • Level of Economic Activity • Road/Rail Network • Material Access • Feeder Services • Management practices • Customer satisfaction • Personnel quality & motivation Port Performance Sum of parts! Efficiency improvements should target the entire sphere of activities and result in increased competitiveness Technology • Port Equipments • Software applications • IT based custom & security • Communication system Physical Features of Port • Master Plan & port capacity • Level of congestion • Ability to handle large ships • Geographical location Terminal Efficiency • Crane productivity • Yard equipment planning & productivity • Gate productivity • Equipment Utilization • No. of berths • Port Charges