Port of Dubrovnik Passenger port development 1 st

Port of Dubrovnik - Passenger port development 1 st Joint Forum Conference of the Adriatic-Ionian Chambers of Commerce, Cities and Universities 17 th Oct 2018

Contents • • • Basic information History, location, legal aspects Traffic data Cruise industry stakeholders Economic impact Port Development Plans 2

Port Authorities in Croatia 6 State Port Authorities open for international public traffic: • • • Port Authority of Dubrovnik Port Authority of Ploce Port Authority of Split Port Authority of Sibenik Members of the Port Authorities Community, ESPO, Port Authority of Zadar Med. Cruise (the Association of Mediterranean Port Authority of Rijeka Cruise Ports) 22 County Port Authorities RIJEKA ZADAR ŠIBENIK SPLIT PLOČE AIVP - The worldwide network of port cities DUBROVNIK 3

Geographical position

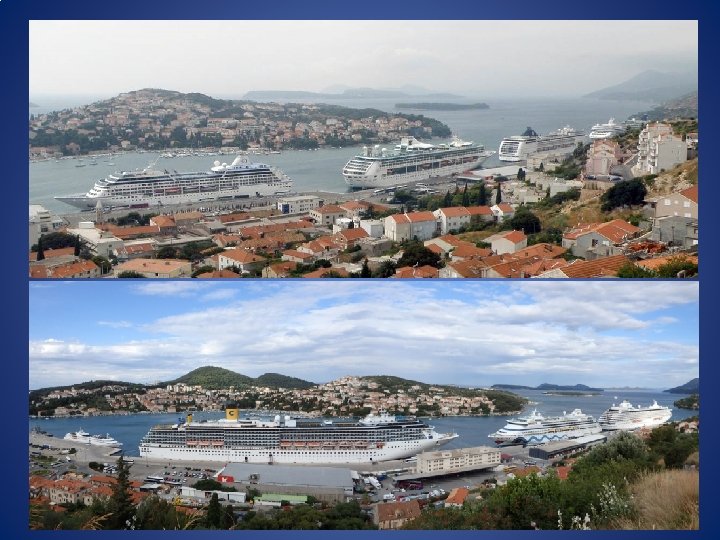
Dubrovnik „one destination - two ports”

Port of Dubrovnik - history Before 1667 Beginning of 19 th century 1873

Milestone of cruise history • • • 10 th August 1844 steam ship BARONE STUERMER arrived from Trieste with 153 pax on „voyage of pleasure” Before 1 st WW s/s: SENEGAL, VECTIS, ARGONAUT, VITTORIA, METEOR, PRINZESSIN VICTORIA LUISE, SALSETTE, ORMUZ, DUNOTTAR CASTLE, FRANCE. . . 30 th March 1931 on s/s THEOPHILE GAUTIER with Bernard Shaw arrived in Dubrovnik Between 1 st & 2 nd WW arrived in Dubrovnik: AQUITANIA, ATLANTIS, BRITANNIC, GENERAL VON STEUBEN, MONTE ROSA, SIERRA CORDOBA, ORION, ORCA, ORONTES, ORCADES, ORONSAY, LANCASTRIA, RANCHI, CARINTHIA, STRATHNAVER, STRATHMORE, STRATHAIRD, VULCANIA, SATURNIA, ARANDORA STAR, LEOPOLDVILLE, VOLTAIRE, BATORY, SLAMAT, ROMA, OCEANIA, HELLAS, STELLA POLARIS, CAMPONA, MILWAUKEE, MEXIQUE, ORION, EMPRESS OF AUSTRALIA, EMPRESS OF CANADA, EMPRESS OF FRANCE, EMPRESS OF SCOTLAND, MOLDAVIA, ORFORD, SAMARIA, OTRANTO, VICEROY OF INDIA, CONTE ROSSO, CALGARIC, LAPLAND 1935 more then 50 cruise ships visited Dubrovnik 1953 m/v Oslofjord visited Dubrovnik as first ship after 2 nd WW Ships in fifties: REINA DEL MAR, QUEEN ELIZABETH 2, FRANCE, CANBERRA, ANDES, ATHINAI, AKROPOLIS, HERMES, ELLINIS, AUSONIA, INDEPENDENCE, CONSTITUTION, IBERIA, CARONIA, SAGAFJORD, OSLOFJORD, ORIANA, ORSOVA, ORCADES, ANKARA, EMPRESS OF CANADA, NIEUW AMSTERDAM, STATENDAM, LEONARDO DA VINCI 27 th September 1991 m/v La Palma – last ship before Croatian War of Independence 7 th November 1994 m/v La Palma returned in Dubrovnik

Passenger Port of Dubrovnik

Port Authority of Dubrovnik – legal aspects 1. Established by Government of Croatia 1997 for development and management of public port 2. Non profit organization 3. Main activities: a. Construction, maintenance, management, supervision, protection and development of maritime domain – port area b. Management of all kinds of port traffic c. Providing public services for which economic interests do not exist d. Granting concessions, supervision and coordination between concessioners

General information • • Operative territory surface: 120 000 m² Founded at the beginning of 20 th century Total length of quays: 1350 m Number of quays: 7 Draft: 6 – 12 m Maximum ship dimensions for berthing: unlimited Distances Airport: 20 km Bus terminal: 200 m City Center: 2 km

Port infrastructure Development plan NEXT PROJECT Batahovina II 2020 - 2023 400 m (16 mil €) COMPLETED 2011 218 m (8 mil €) COMPLETED 2009 825 m (26 mil €)
 LENGTH (m) DEPTH (m) 7 – 9 305 5, 5")
Berth particulars BERTH (no) LENGTH (m) DEPTH (m) 7 – 9 305 5, 5 – 6, 5 10 – 11 605 11, 0 12 220 11, 0 – 12, 0 14 218 10, 0

Anchorage and approaching navigational channel

Passenger traffic data 2013 -2018 Type of traffic 2013 2014 2015 2016 2017 2018 expected Ferry Lines 418. 555 427. 058 441. 155 496. 797 569. 776 586. 869 Cruise 1. 086. 925 844. 410 812. 608 833. 588 748. 918 768. 022 Other 90. 580 79. 797 89. 255 53. 305 91. 400 94. 142 Total 1. 596. 060 1. 351. 265 1. 343. 018 1. 383. 690 1. 410. 094 1. 449. 033

TRAFFIC FIGURES PORT GRUZ BY CATEGORIES / PERIOD 2013 – 2017 Year / Categories of traffic 2013 2014 2015 2016 2017 330. 118 335. 072 363. 649 426. 329 506. 159 1. 961. 327 29% * Other 90. 580 76. 470 86. 135 50. 300 88. 400 391. 885 6% Total A 420. 698 411. 542 449. 784 476. 629 594. 559 2. 353. 212 35% 29% 31% 35% 43% 35% 88. 437 91. 986 77. 506 70. 468 63. 617 392. 014 6% Cruise 942. 909 806. 187 768. 434 800. 300 704. 812 4. 022. 642 59% Total B 1. 031. 346 898. 173 845. 940 870. 768. 429 4. 414. 656 65% 71% 69% 65% 57% 65% 1. 452. 044 1. 309. 715 1. 295. 724 1. 347. 397 1. 362. 988 6. 767. 868 Domestic passengers Ferry % International passengers Ferry % Total A+B * domestic cruise, daily excursions Total % 100, 0%

Cruise passenger per months 2015/2016

Weekly schedule arrivals of cruise passengers in 2016 Monday; 74. 038 ; 10% Sunday; 97. 581 ; 13% Tuesday; 31. 661 ; 4% Wednesday; 85. 911 ; 11% Saturday; 195. 772 ; 25% Thursday; 179. 350; 23% Friday; 107. 298 ; 14%
 Nationality Pax Ration in total 1. UK 144. 387 20%")
Passengers by nationality (2016) Nationality Pax Ration in total 1. UK 144. 387 20% 2. Italy 129. 099 18% 3. Germany 102. 972 14% 4. USA 64. 319 9% 5. France 43. 694 6% 6. Spain 42. 039 6% 7. Switzerland 21. 899 3% 8. Austria 15. 636 2% 564. 045 76% Total top 8.

Cruise calls: 2013 - 692 2014 - 577 2015 - 603 2016 - 639 2017 - 539 2018 - 477 expected Dominant cruise lines: Costa Crociere MSC Crociere Croisimer Royal Caribbean Cruises P&O Cruises Celebrity Cruises Marella Cruises TUI Cruises

Cruise Passenger Capacity in the Mediterranean 2016 Company Ships Capacity % Market Costa Crociere 11 721. 404 19, 0% MSC 10 706. 352 18, 6% Royal Caribbean 9 326. 794 8, 6% Norwegian 4 238. 200 6, 3% AIDA 6 233. 144 6, 1% Marella Cruises 5 189. 496 5, 0% Celestyal 3 162. 290 4, 3% TUI 7 157. 320 4, 1% Princess 5 151. 698 4, 0% Holland America 5 120. 768 3, 2% 65 3. 007. 466 79, 2% Total Top 10

• • • Homeport operations Home port operations for Marella Cruises since 2015 Passenger ship „Marella Celebration”, every week from May to October (28 calls) Advantages of being a homeport for cruise ship is the additional revenue from service (flights, hotels accommodation, excursions, transport, taxis etc. ) The importance of positioning Dubrovnik as the turnaround port - homeport lies in the fact that this is the way to extend the stay of tourists in the area and the benefits for the local economy. Homeport for Dubrovnik means a whole new process of cruise tourism. Number of pax embarked and disembarked in Dubrovnik as part of „Marella Cruises" home port operations: Year 2015 2016 2017 Embarked 31. 168 33. 470 34. 075 Disembarked 30. 649 34. 693 34. 030 Total 61. 817 68. 163 68. 105

Dubrovnik & Med. Cruise Ports Cruise Traffic data 2017 No Top 10 Ports Med. Cruise Total Pax. Region 1 Barcelona West Med 2. 712. 247 2 Civitavecchia West Med 3 Balearic Islands 4 Total Calls Home in Pax. Home out Pax. Transit Pax. 778 719. 871 720. 512 1. 271. 864 2. 204. 336 729 426. 839 423. 154 1. 354. 343 West Med 2. 110. 663 819 368. 905 1. 372. 853 Marseille West Med 1. 487. 313 444 207. 156 207. 724 1. 072. 433 5 Venice Adriatic 1. 427. 812 466 614. 823 611. 648 201. 341 6 Piraeus East Med 1. 055. 559 576 165. 634 166. 977 722. 948 7 Tenerife Ports West Med 964. 337 533 66. 986 71. 090 826. 261 8 Naples West Med 927. 458 336 60. 004 53. 251 814. 133 9 Genoa West Med 925. 188 212 269. 351 271. 241 384. 596 10 Savona West Med 854. 443 187 258. 307 260. 543 335. 593 11 Dubrovnik Adriatc 748. 918 539 34. 075 34. 030 680. 813

Dubrovnik touristic attraction for cruise industry • • Preserved history Art Culture Nature beauty Way of life Gastronomy and enology Adventure Pilgrimage

Alternative excursion programme to the surroundings of Dubrovnik

Cruise industry stakeholder • • • Port authority Stevedoring company Ship’s agent Pilots Immigration police, Custom, Harbour Master Office Forwarding company Suppliers (bunker, provision, water supply, electric supply, etc…. ) City (municipal institution, road and pedestrian traffic regulation, public transport …) Dubrovnik Touristic Board Touristic agency – – • • Shore excursions Guide service Bus service Boat service Taxi service Museum and gallery, parks, beaches Gastro offer Shopping Hospitality industry Emergency response organization (Fire brigade, hospital, police, red cross. . ) Medical services

Economic impact of cruise to Dubrovnik area 2017 SIZE OF THE VESSEL GT PAX No % EXPENDITURE *approx. per passenger INCOME (EUR) SMALL 20. 000 400 193 36, 0 6, 50€ 501. 800 MEDIUM 40. 000 1. 000 54 10, 0 4, 63€ 250. 020 LARGE 100. 000 2. 600 289 53, 5 4, 13€ 3. 103. 282 MEGA 130. 000 4. 000 3 0, 5 3, 45€ 41. 400 539 100% Total 3. 896. 502 *approx. expenditure according the tariffs (not included weekends and holidays, or extra expenditures) operative coast, pilot, mooring/unmooring, lighting EXPENDITURE OF PASSENGER** 39€ 29. 207. 802 (748. 918 x 39) **approx. expenditure of passenger in destination (souvenirs, excursions, shuttle…) As per „Study on Sustainable Development of Cruise Tourism in Croatia”, 2007 DESTINATION INCOME*** 33. 104. 304 € ***approx. average vessel expenditure per passenger* x passenger expenditure** x number of passengers in Dubrovnik in 2017. (748. 918 pax)

Dubrovnik Port Development Project First Phase – Infrastructure Reconstruction of the operative quay: enough capacity to accommodate 3 mega cruise ships of approximately 300 m length simultaneously (completed 2006 -2011) Investment value: 36. 5 mil EUR (loan from EBRD, period of payment of the loan 20072017) Continuation of construction site: Project Batahovina II (new operative quay in length of 400 m with 2 ro-ro ramps) Investment value: 16. 5 mil EUR (based on non-refundable EU funds of 85%) Second Phase – Suprastructure Construction of suprastructure (Passenger Cruise Terminal), Investment value: approx. 30 mil EUR (negotiable model of investment PPP or BOT, expected realisation of the project 2026)
 Investment")
Suprastructure development Investment plan – Port facility Terminal building (expected completition date 2026) Investment model - considered options: PAD own assets co-financed with EU funds BOT – Build Operate and Transfer PPP – Public Private Partnership 1. FACILITIES EUR (in mill) Passenger terminal 30

Detailed urban plan VILLAS PORT CONTROL CENTER GARDENS Port for ferry transport AUDITORIUM BUS TERMINAL GARAGE BUSINESS Service area CRUISE TERMINAL FERRY TERMINAL PORT CONTROL CENTER Service area Park area Cruise ship port Service area Excursion traffic

Thank you for your attention!
- Slides: 31