Pore water oxygen profiles and benthic oxygen fluxes
106(NH 3)16(H 3 PO")
Pore water oxygen profiles and benthic oxygen fluxes (CH 2 O)106(NH 3)16(H 3 PO 4) + 138 O 2 => 106 HCO 3 - + 16 NO 3 - + HPO 4 -2 + 124 H+ + 16 H 2 O Integrated oxygen consumption => oxygen flux organic C decomposition (oxic) + reoxidation of reduced species (metals, sulfide) gradient at sediment-water interface, or fit profiles of oxygen or nitrate

O 2 penetration depth influence use of other electron acceptors understand controls on C org preservation interpret downcore % C org variations predict profile and rate of CO 2 release “metabolic” carbonate dissolution Comparisons: benthic flux chamber : sediment trap (OM lability) pore water : benthic flux chamber (bioirrigation)

What controls the O 2 penetration depth?
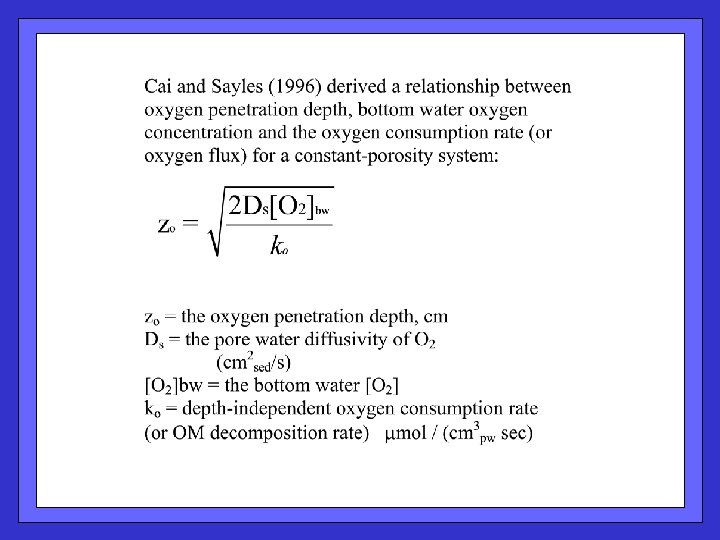
![Suggests that oxygen penetration depth is controlled by [O 2]bw and O 2 flux](http://slidetodoc.com/presentation_image_h/0dfbd45c48330b3b01da87ffadccbcfd/image-5.jpg "Suggests that oxygen penetration depth is controlled by [O 2]bw and O 2 flux")
Suggests that oxygen penetration depth is controlled by [O 2]bw and O 2 flux (in turn driven by OM flux)

Found a good relationship between predicted O 2 penetration depth (bottom water oxygen and oxygen flux) and observed OPD Cai and Sayles, 1996

The relationship breaks down at higher penetration depths; nonconstant decomposition rate?

Simple model provides a way to predict response of processes linked to OPD – OM preservation and benthic denitrification – to changes in [O 2]bw and surface ocean productivity (C flux, or O 2 flux)
 – test ability to predict OPD in cases where porosity")
Martin and Sayles (2004) – test ability to predict OPD in cases where porosity is a function of depth, and over a range of [O 2]bw and ko

in situ microelectrode O 2 profiles in western North Atlantic. Rates estimated by fitting the data with a diagenetic model Observed porosity (fn z) Fitting the profiles, found that a constant O 2 consumption rate (ko) was adequate for most sites Martin and Sayles, 2004
![Porosity is a significant factor Good agreement with predicted dependence on [O 2]bw and](http://slidetodoc.com/presentation_image_h/0dfbd45c48330b3b01da87ffadccbcfd/image-11.jpg "Porosity is a significant factor Good agreement with predicted dependence on [O 2]bw and")
Porosity is a significant factor Good agreement with predicted dependence on [O 2]bw and O 2 consumption rate
![The Cai and Sayles OPD [O 2]bw - O 2 flux relationship is confirmed](http://slidetodoc.com/presentation_image_h/0dfbd45c48330b3b01da87ffadccbcfd/image-12.jpg "The Cai and Sayles OPD [O 2]bw - O 2 flux relationship is confirmed")
The Cai and Sayles OPD [O 2]bw - O 2 flux relationship is confirmed in the more-general (variable f) case. (OPD increases with [O 2]bw , decreases with O 2 flux)

 of sediment OM – how tight is")
Oxygen evidence of the lability (reaction rate) of sediment OM – how tight is the link between OM input (sediment trap OM flux) and benthic decomposition?

Laboratory evidence of a range in lability for marine OM – plankton decomposition experiments. Westrich and Berner, 1984

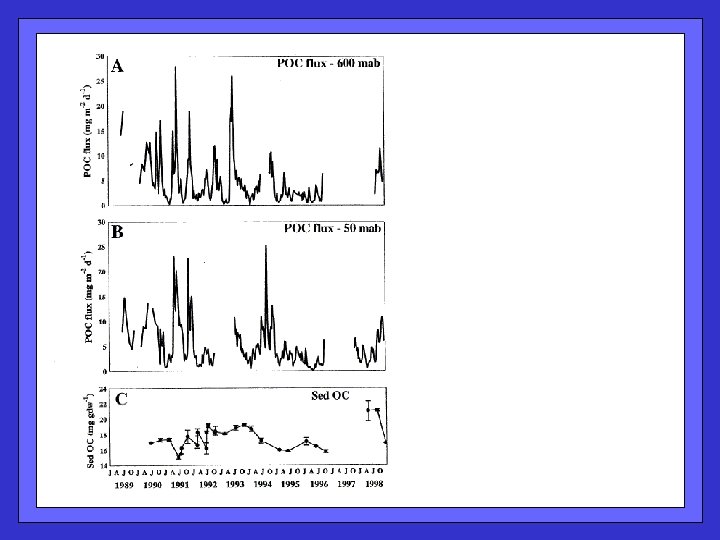
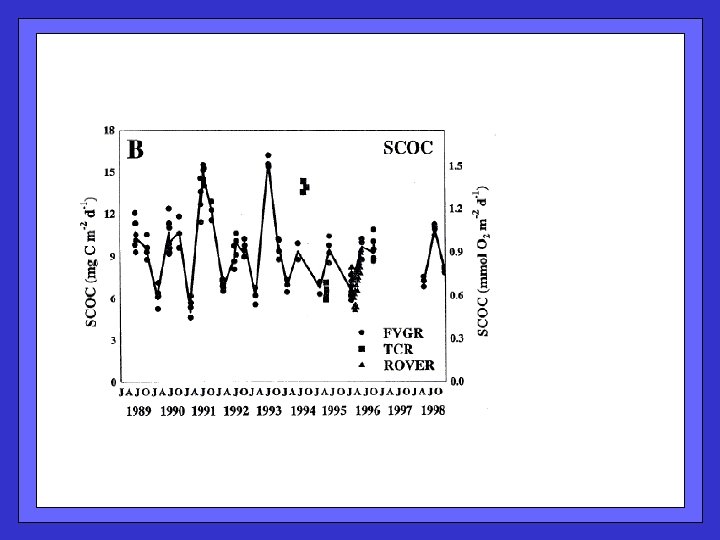
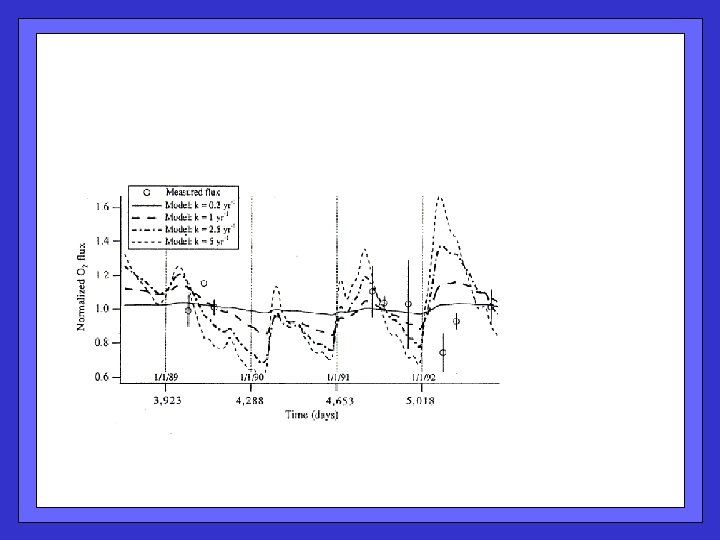
Sediment trap carbon flux and benthic oxygen demand off Bermuda. Long-term trap deployment, and a series of month-long BFC experiments Sayles, Martin, and Deuser, 1994
 compared with trap flux")
Sediment trap carbon flux and Observed benthic oxygen demand (circles) compared with trap flux and modelpredicted oxygen demand for slow (0. 2/y) and fast (5/y) decomposition rates. Observations more consistent with slow rates.

Contrast Sayles et al. Bermuda results (slow ko, lack of tight linkage between C flux and O 2 demand) with results of Smith et al. off California. Strong linkage off CA implies faster decomposition rates (5 to 10 / yr).


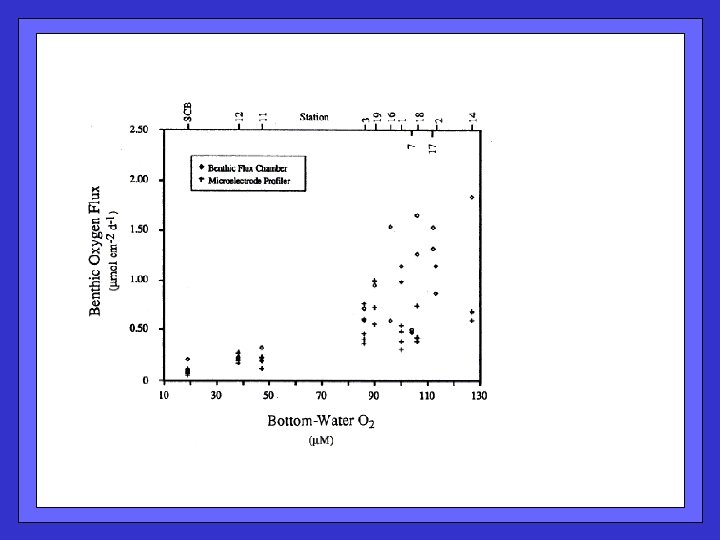
Relative importance of diffusion and bio-irrigation to oxygen uptake in continental margin sediments Pore water profiles and benthic flux chamber deployments on the California margin Reimers et al. , 1992

Pore water oxygen from in situ microelectrodes. Low bottom water oxygen in OMZ; oxygen penetration of millimeters at all these shallow sites. oxygen respiration (CH 2 O)106(NH 3)16(H 3 PO 4) + 138 O 2 => 106 HCO 3 - + 16 NO 3 - + HPO 4 -2 + 124 H+ + 16 H 2 O

Deeper sites, with higher bottom water oxygen and deeper oxygen penetration. Linear gradient estimates from steepest part of each profile. Reimers et al.
 deployments at these high-flux, low O")
Benthic flux chamber results; short (1 -2 day) deployments at these high-flux, low O 2 sites. Jahnke et al.

 and BFC results (total transport); no")
Reasonable agreement between O 2 profiles (diffusive transport) and BFC results (total transport); no obvious pattern to the differences.

Archer and Devol – WA margin

Microelectrode oxygen profiles

Benthic flux chamber O 2
 sites")
Total oxygen uptake substantially higher than diffusive uptake at the high oxygen (shelf) sites of Archer and Devol. Bioirrigation in high OM flux, high [O 2]bw settings

 in the O")
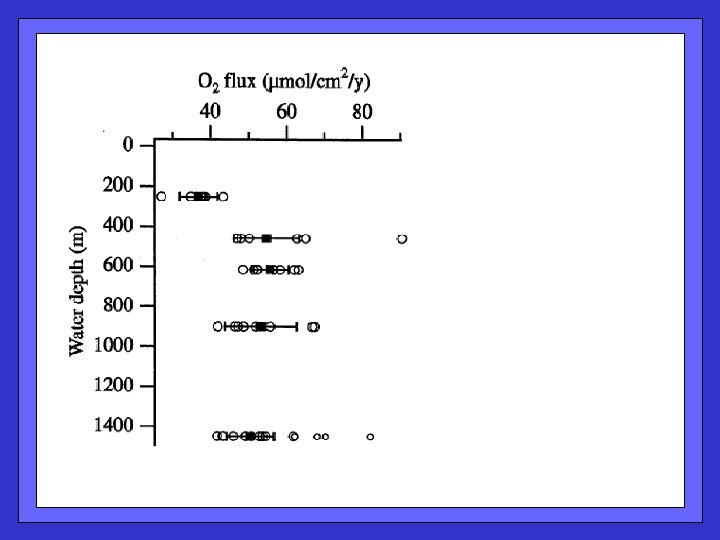
A depth transect in the western Atlantic. Shallowest site (250 m) in the O 2 minimum (165 m. M), and also characterized by coarse, lowporosity sediment. Martin and Sayles, 2004

Multiple in situ microelectrode O 2 profiles at each site. Rates estimated by fitting the data with a diagenetic model (not the “steepest slope” approach of Reimers et al. ) O 2 penetration 1 – 3 cm Martin and Sayles, 2004

Production and consumption rates of nitrate and ammonia also obtained by fitting the data with a diagenetic model. The ammonia flux reflects OM oxidation by sulfate and iron reduction.

Martin and Sayles, 2004 O 2 respiration dominates more strongly than on CA margin O 2 : NO 3 - : 75 – 82 % 5– 6% SO 42 - + Fe: 13 – 20 % O 2 : 91 % NO 3 - : 2% SO 42 - + Fe: 7%


Two-point gradient estimates at steepest part of profile. Steep nitrate gradients reflect rapid, shallow denitrification. nitrate reduction (CH 2 O)106(NH 3)16(H 3 PO 4) + 94. 4 NO 3 - => 13. 6 CO 2 + 92. 4 HCO 3 - + 55. 2 N 2 + HPO 4 -2 + 84. 8 H 2 O
 and Fe 2+ (filled) gradients (and Mn. Ox and Fe. Ox")
Mn 2+ (open) and Fe 2+ (filled) gradients (and Mn. Ox and Fe. Ox reduction rates) estimated from fits to upper part of each profile.

Reimers et al. , Mn 2+ decrease? No Mn 2+? Fe 2+ decrease? Mn. O 2 reduction (CH 2 O)106(NH 3)16(H 3 PO 4) + 236 Mn. O 2 + 364 H+ => 236 Mn 2+ + 106 HCO 3 - + 8 N 2 + HPO 4 -2 + 260 H 2 O Fe 2 O 3 reduction (CH 2 O)106(NH 3)16(H 3 PO 4) + 212 Fe 2 O 3 + 756 H+ => 424 Fe 2+ + 106 HCO 3 - + 16 NH 4+ + HPO 4 -2 + 424 H 2 O
 reflects sulfate reduction (CH 2 O)106(NH 3)16(H")
The ammonia flux (corrected for Fe reduction) reflects sulfate reduction (CH 2 O)106(NH 3)16(H 3 PO 4) + 53 SO 4 -2 => 106 HCO 3 - + 16 NH 4+ + HPO 4 -2 + 53 HS- + 39 H+

The oxygen fluxes are corrected for NH 3, Mn 2+ and Fe 2+ oxidation
- Slides: 51