Populations Populations l Population A group of organisms


 Total Population of the World by Decade, 1950– 2050 (historical and")

- Slides: 51
Populations
Populations l Population- A group of organisms of the same species that live in a particular area. l Three important characteristics of a population are its geographic distribution, density, and growth rate.
POPULATIONS Population Growth- the change in the size of a population with time. l Population Density- is the number of individuals per unit area. l Geographic Density is how the population is distributed. l
POPULATION SIZE Three factors can affect population size. l Number of births l Number of deaths l Number of organisms that enter or exit the population l
POPULATION SIZE l Immigration- The movement of organisms into a population. l Emigration- The movement of organisms out of a population.
POPULATION GROWTH Exponential growthoccurs when the individuals in a population reproduce at a constant rate. l Under ideal conditions with unlimited resources a population will grow exponentially. l Often call J shaped curve. l
POPULATION GROWTH We do know that populations cannot grow exponentially for very long. l What cause a population to slow down or even stop? l RESOURCES! As resources become less available, the growth of a population slows or stops. l
POPULATION GROWTH l Logistic Growth occurs when a population growth slows or stops following a period of exponential growth.
Carrying Capacity Populations that illustrate logistic growth have reached their Carrying Capacity. l CC- The number of organisms a given ecosystem can support. l S-shaped curve l
Carrying Capacity
Maintaining a Balance l For a population to survive, a balance must exist between producers/consume rs, predator/prey, growth and decay, water use and rainfall…etc.
Limiting Factors l Limiting Factors- Any condition of the environment that limits the size of a population. l Some can happen naturally and some are caused by humans. l Ex: Food, water, shelter and space availability, Predation, Climate, Disease, Pollution, Competition, ….
HUMAN IMPACT l Humans have disrupted this balance through…. l Building of roads, industry, homes l Pollution l Hunting/poaching l Global Warming, Excess CO 2
Predicting Carrying Capacity • Because ecosystems change, carrying capacity is difficult to predict and calculate • However, islands are the ideal place to study (clear boundaries)
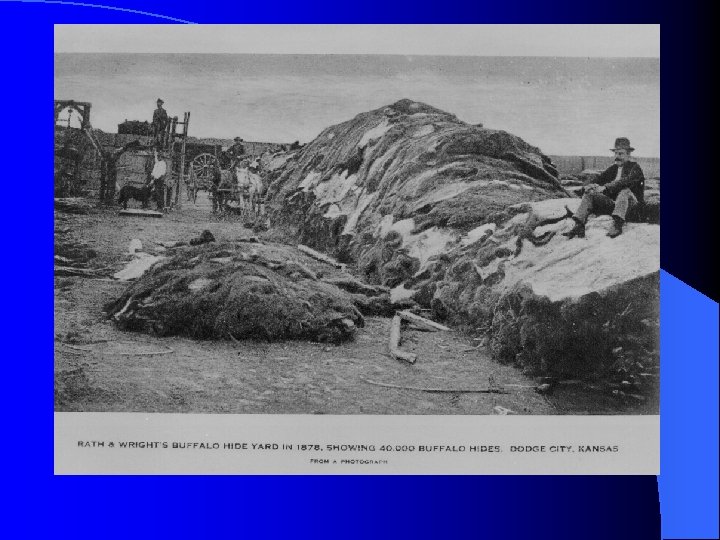
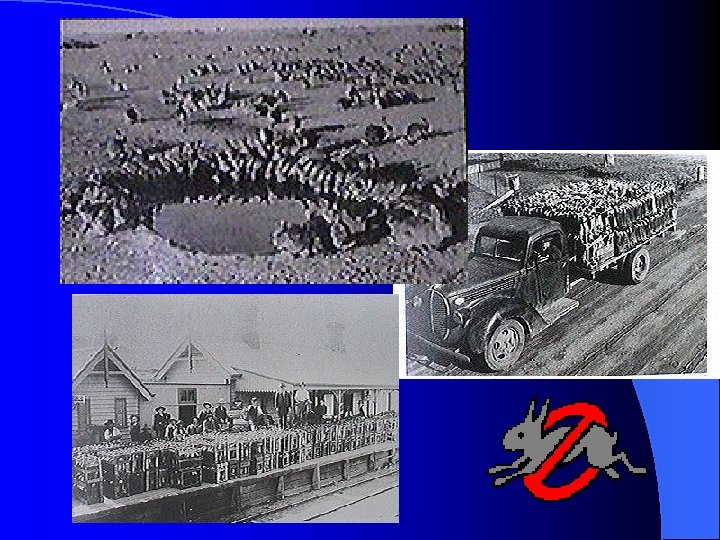
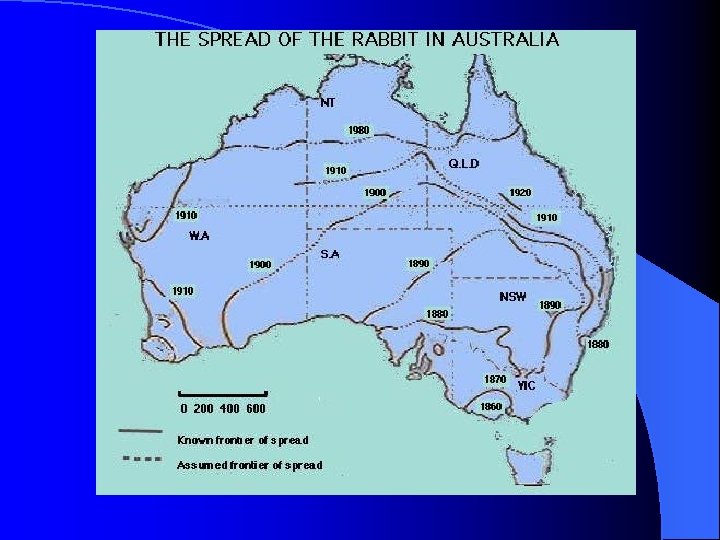
Rabbits in Australia • • • no rabbits in native ecosystems of Australia introduced in 1859 number increased rapidly plenty of vegetation; no predators; no competition disease and starvation caused the rabbit pop. to crash over time, vegetation recovered and rabbit pop. increased again continues to increase and decrease, but less dramatically
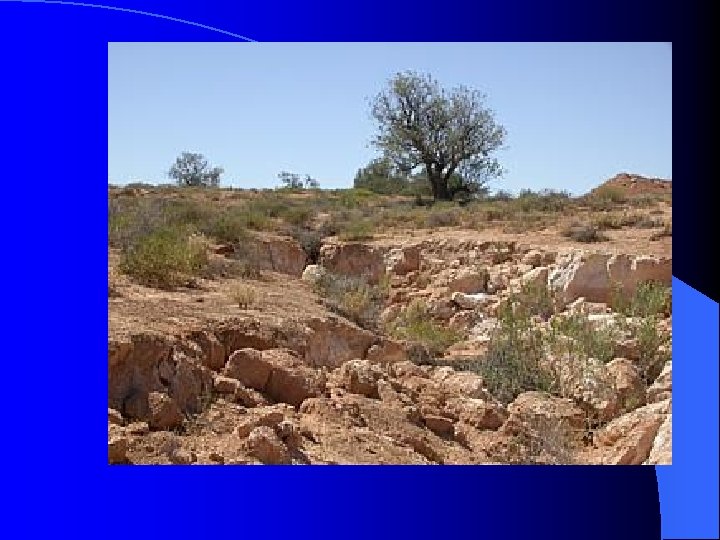
Rabbits reduced Phillip Island to a wasteland. Photos: Department of the Environment and Heritage Recovery was spectacular after the rabbits were eradicated Photos: Department of the Environment and Heritage
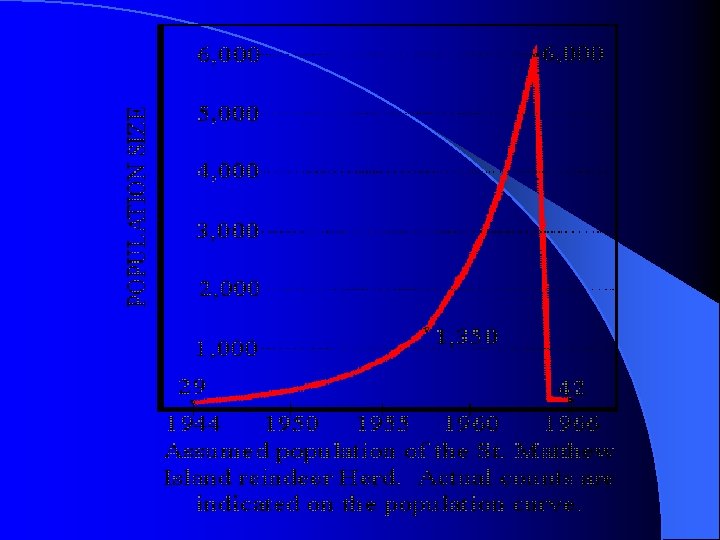
Reindeer near Alaska l 25 reindeer introduced to one of Pribilof Islands near Alaska in 1911 l by 1938, herd had grown to 2, 000 l reindeer ate mostly lichens, which grow back very slowly l by 1950, only 8 reindeer alive on the island
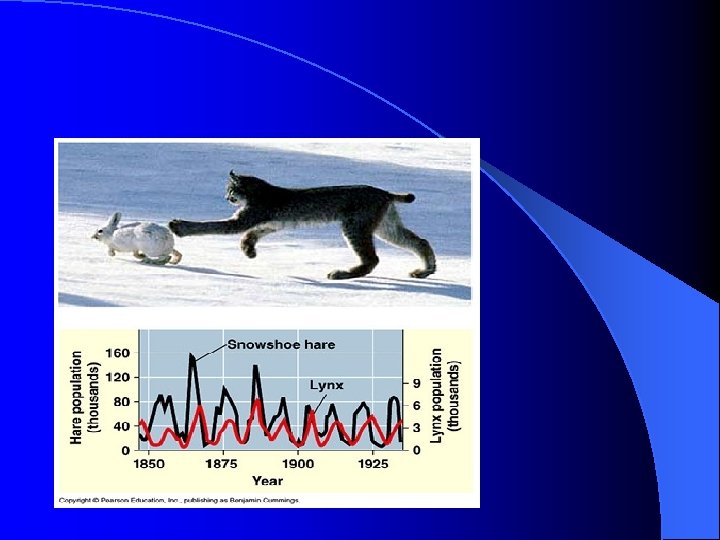
Predator/Prey This is an example of a predator/prey relationship. l As one increases the other will as a result decrease. …. which in turns causes the other to decrease. l A normal cycle l
Two Types of Population Regulation q. Cause of death may be density dependent or density independent
Density Dependent Factors l Density Dependent Factors have an increasing effect as populations increases • These factors operate most strongly when a population is large and dense.
Density Dependent Factors l Competition l Predation l Parasitism l Disease l Crowding
Population is growing rapidly and there are limited resources, predation, or disease
Density Independent Factors are factors that affect a population or cause death regardless of density. l Severe weather, natural disasters and certain human activities like damming of rivers and deforestation. l
Human Population
Human Population
Human Population
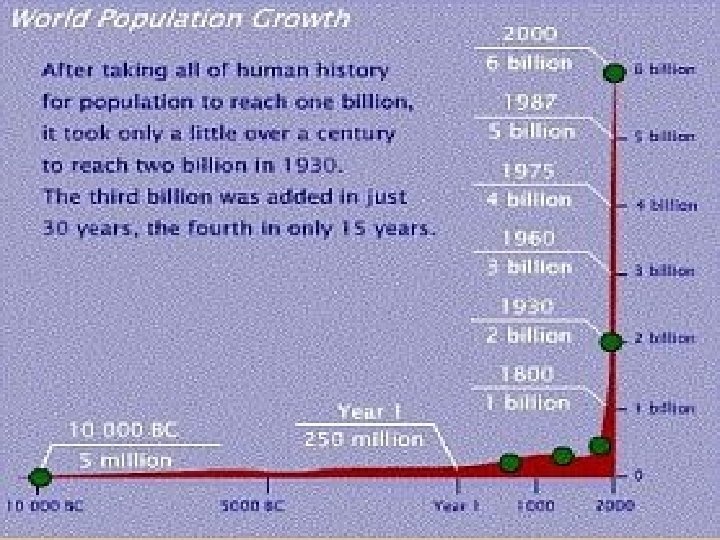
Human Population The human population has increased with time. l For most of human existence life was hard and limiting factors kept the population in check! l In fact only until recently…. ONLY ½ of all children reached adulthood! l
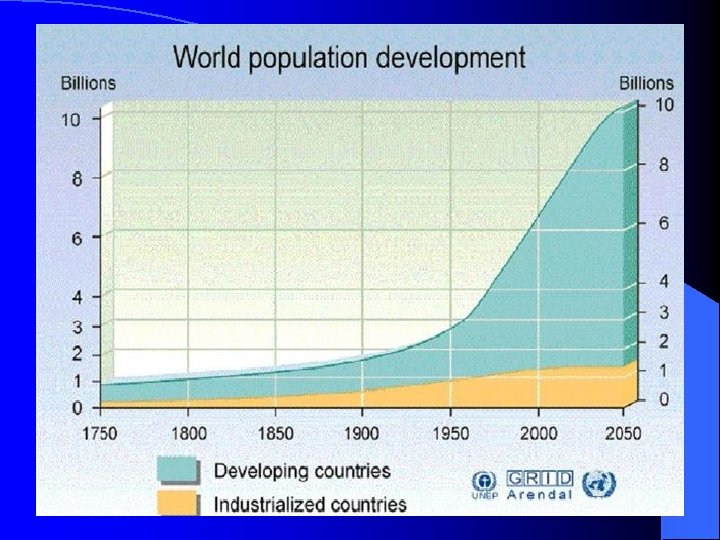
Human Population l l l About 500 years ago the human population began to increase. Growing Exponentially Industrial Revolution and Agriculture advancements are the reason for the drastic increase since the 1800’s Currently at 7 Billion People The population trends differ depending on Developing and Developed Countries.
DEMOGRAPHY l Will our population continue to rise indefinitely? What is earth carrying capacity for humans?
DEMOGRAPHY l Some scientist once believed that war, famine, and disease would be our limiting factors. l Do you agree?
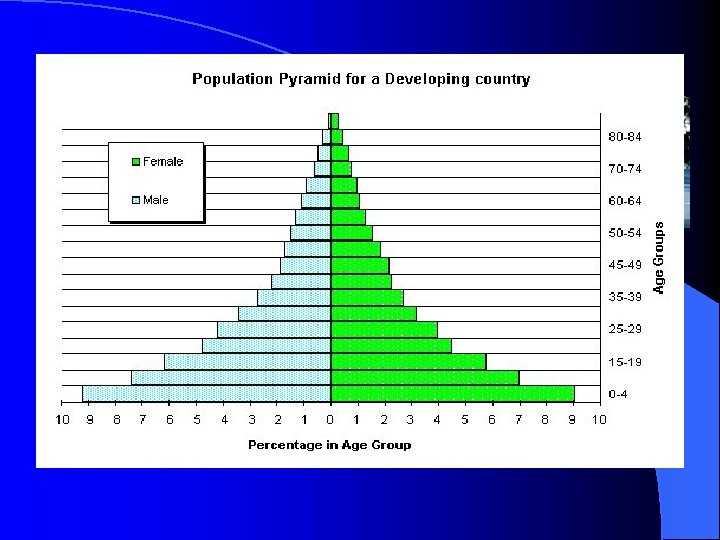
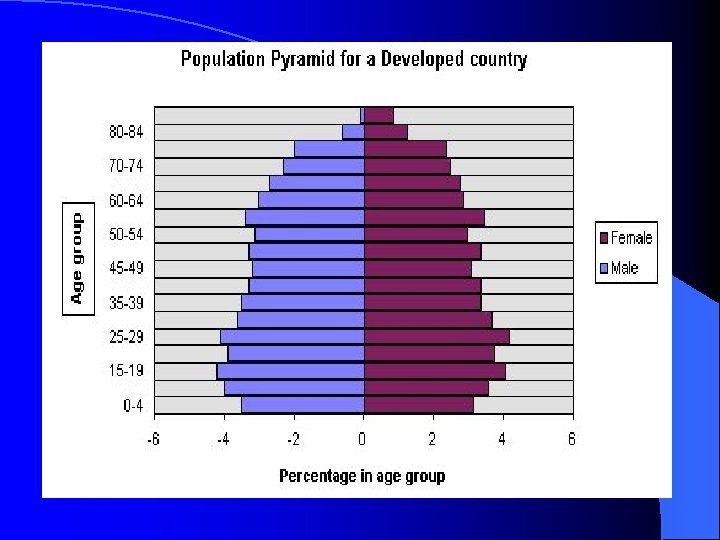
DEMOGRAPHY l DEMOGRAPHY- The study of population. l Demography examines the characteristics of human populations and attempts to explain how those populations will change over time! l You can study charts of the age structure of a population and determine if it is growing or not.
DEMOGRAPHY l Over the last centruy population growth in the US, Japan and much of Europe has slowed dramatically. l This hypothesis is referred to as DEMOGRAPHIC TRANSISITONwhich is defined as a dramatic shift change between birth and death rates.
Demographic Transition l l l Throughout history, human societies have had both high birth rates and death rates. With advances in medicine, nutrition, and sanitation, etc more children survive and reach old age. These changes lower the death rate and demographic transition begins. For a brief time you have high birth rate but low death rates which causes your population to grow exponentially. (1770 -1920 for the US) As societies modernize, (raise their standard of living, better education) the birth rate will begin to fall, the population growth will slow. The Demographic Transition is complete when birthrate falls to meet death rate and population growth stops.
Demographic Transition Very few countries have actually completed DT; most places are still growing exponentially. l Much of the population growth today is contributed by only 10 countries. l Guess the top 10 Countries!!!! l http: //www. mapsofworld. com/world-top-ten-mostpopulated-countries-map. html This is NOT very accurate but still kind of neat! l http: //www. internetworldstats. com/stats 8. htm l
Demographic Transition
Demographic Transition The five stages of the demographic transition model 1. 2. 3. 4. 5. Total population is low but it is balanced due to high birth rates and high death rates. Total population rises as death rates fall due to improvements in health care and sanitation. Birth rates remain high. Total population is still rising rapidly. The gap between birth and death rates narrows due to the availability of contraception and fewer children being needed to work - due to the mechanisation of farming. The natural increase is high. Total population is high, but it is balanced by a low birth rate and a low death rate. Birth control is widely available and there is a desire for smaller families. Total population is high but going into decline due to an ageing population. There is a continued desire for smaller families, with people opting to have children later in life
Demographic Transition
Developed Countries l Higher Average Incomes l Slower Population Growth l Diverse Industrial Economies l Stronger social support l Uses a large % of available resources l Ex: US, Canada, Japan, and countries of Western Europe
Developing Countries l Lower Average Incomes l Simpler and agriculture-based economies l Rapid Population Growth l Uses small % of available resources l Ex: Indonesia and countries in Africa.
(historical and projected) Total Population of the World by Decade, 1950– 2050 (historical and projected) Year Total world population (mid-year figures) Ten-year growth rate (%) 1950 2, 556, 000, 053 18. 9% 1960 3, 039, 451, 023 22. 0 1970 3, 706, 618, 163 20. 2 1980 4, 453, 831, 714 18. 5 1990 5, 278, 639, 789 15. 2 2000 6, 082, 966, 429 12. 6 20101 6, 848, 932, 929 10. 7 20201 7, 584, 821, 144 8. 7 20301 8, 246, 619, 341 7. 3 20401 8, 850, 045, 889 5. 6 20501 9, 346, 399, 468 —
http: //www. youtube. com/watch? v= E 8 dk. WQVFAo. A http: //www. youtube. com/watch? v= s-57 ui-r 6 Qw http: //www. youtube. com/watch? v= iod. J 0 OOdg. Rg http: //www. youtube. com/watch? v= Vc. SX 4 yt. Efc. E