Populations Chapter 5 Page 119 Characteristics of Populations


 A B C 850, 000 300, 000 90, 000 Initial")
 Number of individuals 3) def:")

 Number of individuals 2) Eliminates average phenotypes and favors extremes Overview Range of")


- Slides: 41
Populations Chapter 5, Page 119
Characteristics of Populations n n n 4 important characteristics of a population are; 1. Geographic distribution, 2. Density 3. Growth rate and 4. Age Structure.
Geographic Distribution n This is the range or area inhabited by a population n Another term would be the “range”.
Population Density n The number of individuals per unit area. n This number varies depending on the species and its ecosystem. n The equation is: Population density = number of individuals divided by/over the unit area
Population Growth n n n n Can grow rapidly Can decrease in size Can stay the same size from year to year 3 Factors can affect population size: 1. The number of births, 2. the number of deaths and 3. the number of individuals that enter or leave the population.
Immigration n The movement of individuals into an area causes the population to grow.
Emigration n The movement of individuals out of a population causes that population to decrease in size.
Abundant food? n If a population has abundant space and food and is protected from predators and disease, the population will multiply and the size of the population will increase
Exponential Growth n n This occurs when the individuals in a population reproduce at a constant rate. You normally will see a “J” shaped curve in the graph
Growth Rate n The growth rate may be stated in 3 ways; n 1. Doubling time 2. A birthrate per female 3. A percentage of growth per year. n n
Logistic Growth n n n Logistic growth occurs when a population’s growth slows or stops following a period of exponential growth. It slows when a populations birthrate and death-rate are the same, and/or the rate of immigration is equal to the rate of emigration. You will normally see an “S” shaped curve on the graph
Logistic Growth Curve
Carrying Capacity n The largest number of individuals that a given environment can support.
Figure 5 -4 Logistic Growth of Yeast Population Section 5 -1 Number of Yeast Cells Carrying capacity Time (hours) Go to Section:
Limiting Factor n A factor that causes population growth to decrease.
Limiting Factors affecting Populations n n Some limiting factors affect a population more strongly as the population grows larger. Example-Competition, Predation, Parasitism, disease. Other limiting factors limit a population’s growth regardless of the size of the population. Example-natural disasters, damming rivers, clear cutting forests.
Density-Dependent Limiting Factors n This is a limiting factor that depends on a BIG population size. n These become limiting only when the population reaches a certain size. (Large and dense) n Includes: Competition, Predation, Parasitism, Disease
Density Independent Factors n n This is a limiting factor that affects all populations in similar ways, regardless of population size. Include: Unusual weather, Natural disasters, seasonal cycles and Human activities– damming rivers, clear cutting forests, etc.
Changes Caused by Density Independent Factors n n Most populations can adapt to a certain amount of change Periodic droughts can affect entire populations of grasses Major upsets in an ecosystem can lead to long term declines in certain populations A response to this factor would be that the population crashes.
Competition n n n When populations become crowded, organisms compete for; food water space sunlight and other essentials like clothes
SB 4 c & d What effect did the loss of species B have on species A and D in Figure 5 -3? a. it caused the populations of A and D to decrease b. it caused the populations of A and D to increase c. it caused the populations of A and D to become extinct d. it had no effect on the populations of A and D
SB 4 c & d Examine the graph in Figure 5 -3. Which species were not affected by the loss of species B? a. species A, C, and E c. species C only b. species C and E d. species E only
Mechanism of Population Control n n Would be the predator-prey relationship On Isle Royale, the moose were the prey and the wolves were the predators If the moose population were to decline then so would the wolves since there is not enough for the wolves to eat. Parasites are like predators because they take nourishment at the expense of the host which weakens them causing disease or death
Figure 5 -7 Wolf and Moose Populations on Isle Royale Section 5 -2 60 2400 50 2000 40 1600 30 1200 20 800 10 400 0 1955 1960 1965 1970 1975 Moose Go to Section: 1980 Wolves 1985 1990 1995 0
Island Area (km 2) A B C 850, 000 300, 000 90, 000 Initial No. of Species 175 140 80 Extinctions 25 35 50 SB 4 c & d According to the data in Table 5 -2, which factor has the greatest impact on species loss? a. the original number of species c. the area of the island b. the distance from the mainland d. the climate
III. Natural selection and sexual selection Directional selection 2) Number of individuals 3) def: selection that results in allelic frequency moving in one direction Overview Example Range of values at time 2 Range of values at time 1 Number of individuals 1) Number of individuals A. Range of values at time 3
Number of individuals Range of values at time 1 B. Stabilizing selection Number of individuals 1) effect: there is no change in average value for a trait, and variation is reduced 2) Overview Number of individuals Range of values at time 2 Range of values at time 3
3) Number of individuals 2) Eliminates average phenotypes and favors extremes Overview Range of values at time 1 Very important: can lead to speciation- creation of new species Range of values at time 2 Number of individuals 1) Number of individuals C. Disruptive selection Range of values at time 3
Historical Overview of Human Population n n The size of the human population increased with time It was slow at first due to life being harsh and limiting factors kept population sizes low It began to grow again because of improved sanitation, industry made life easier and safer and the world’s food supply became more reliable The human population cannot keep growing exponentially because the Earth and its resources are limited
Demography n Demography is the scientific study of human populations. n Factors include; birthrates, death rates and the age structure of the populations.
Demographic Transition n n This is the hypothesis that explains why population growth has slowed dramatically in the United States, Japan and much of Europe. Birthrates and death rates fall during the demographic transition. Initially, both rates are high then the death rate drops while the birthrate remains high and finally the birthrate also decreases. This process is demographic transition.
Human History n n n Societies have had high birthrates and equally high death rates Advances in nutrition, sanitation, and medicine have lowered the death rate Changes brought about by modernization lower the death rate Births greatly exceed deaths, resulting in rapid population increases As modernization continues, the birthrate falls and population growth decreases The birthrate falls to meet the death rate, and population stops
Human Population Growth n n The worldwide human population is still growing exponentially Most people live in countries that have not yet completed the demographic transition The demographic transition has happened in the U. S. Population growth depends on how many people of different ages make up a given population.
Population growth rates by place
Figure 5 -13 Age Distribution Section 5 -3 U. S. Population Males Go to Section: Females Rwandan Population Males Females
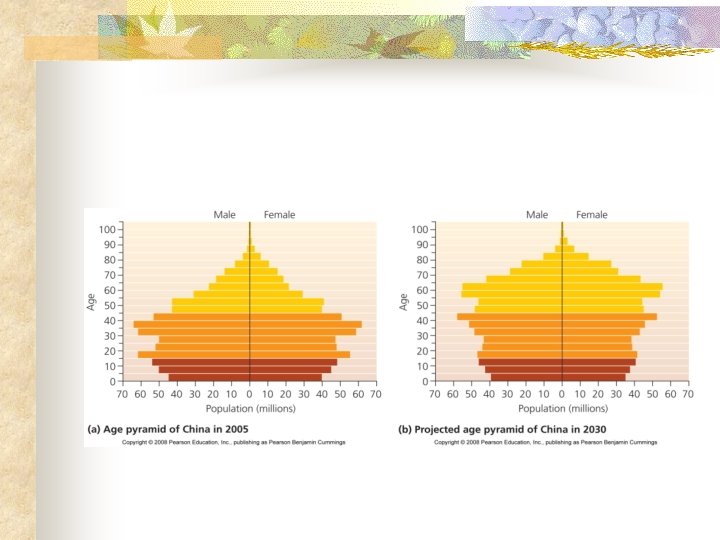
Age structure and sex ratios of a population
Age Structures n The age structure in the US predicts a slow but steady growth rate for the near future. n The age structure in Rwanda predicts a population that will double in about 30 years.
Women’s roles
Future Population Growth n n n By the year 2050 the worlds population may reach more than 9 BILLION people. http: //math. berkeley. edu/~galen/popclk. html To level this off or slow it down, countries of the world that are currently growing rapidly move toward the demographic transition. http: //www. poodwaddle. com/worldclock. swf http: //www. census. gov/population/www/popcloc kus. html
Future Growth n n n If the growth in human population does not slow down, ecologists suggest that there could be serious and lasting damage to the environment as well as to the global economy. http: //www. myfootprint. org/ What is your ecological footprint?