POPULATIONS AND POPULATION STRUCTURE A population is a


, the number")


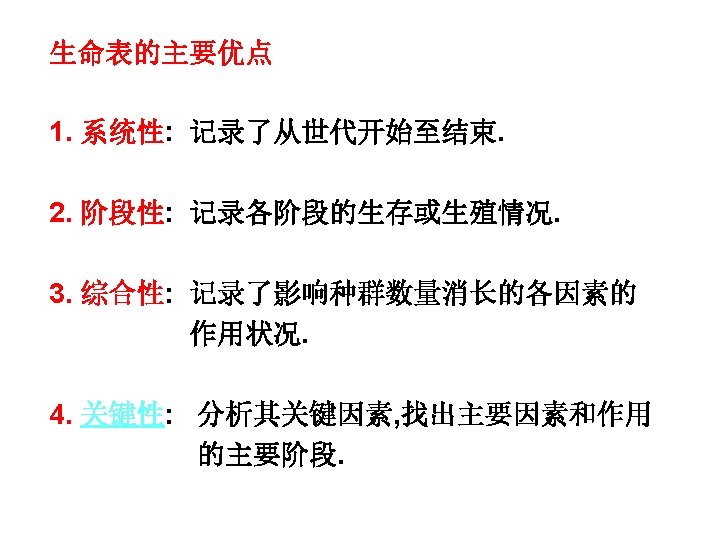
 Definition of life table (2) Types of life table (3) Excellences")


")


 A time lag between")
 Overcompensating density dependence. This can lead to dampened oscillations, stable limit cycles (regular")
- Slides: 69
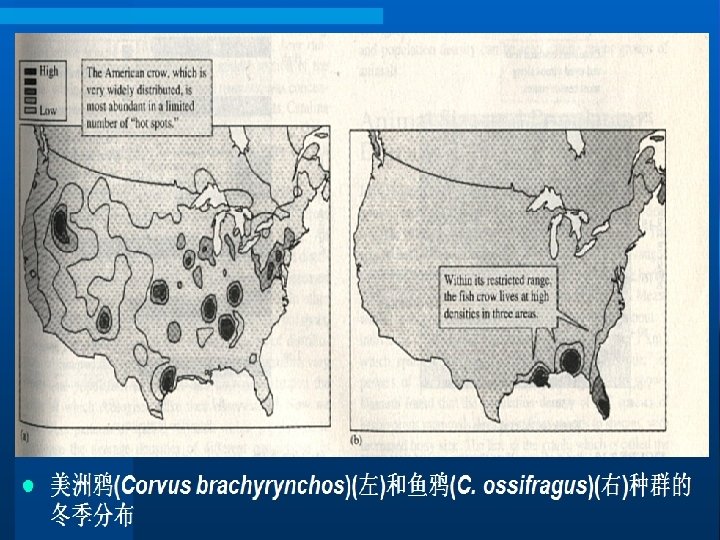
POPULATIONS AND POPULATION STRUCTURE A population is a group of organisms of the same Population species which occupies a given area. The boundaries between populations can be arbitrary. 种群是一定区域内同种生物个体的集合。种群间 种 群 的边界可以是任意的。
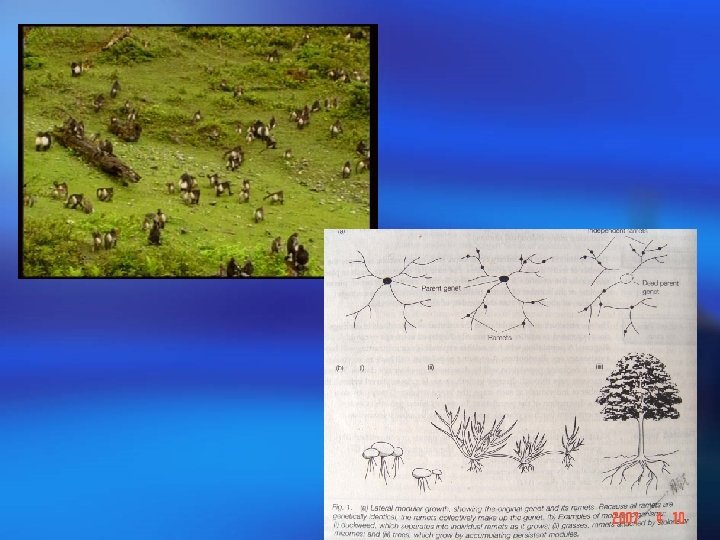
Populations may be categorized as consisting of either unitary or modular organisms. In unitary populations, each zygote gives rise to a single individual. In modular organisms, the zygote develops into a unit of construction which gives rise to further modules and a branching structure. The structure may then fragment producing many individual ramets. 种群可以根据组成种群的生物是单体生物还是构件生物进行分类。 在单体生物种群中,每一受精卵发育成一单个个体。在构件生物 种群中,受精卵发育成一个结构单位,这一结构单位再形成更多 的构件和分支结构。然后这些结构可能分裂,形成许多无性系分 株。
The population size for unitary organisms, such as mammals, is simply the number of individuals in a given area. For modular organisms, such as plants and corals. The Population size situation is more complex. In this case the number of ‘pieces’ (ramets) or the number of shoots (modules) may give a more meaningful indication of abundance than the number of different individuals. 对于单体生物和种群如哺乳类,其种群大小就是一定区域 种群大小 内个体的数量,非常简单。对于构件生物,如植物和珊瑚, 情况就较复杂。对于这些种群,“断片”(无性系分株)或 枝条(构件)的数目比不同个体的数量更有意义代表多度。
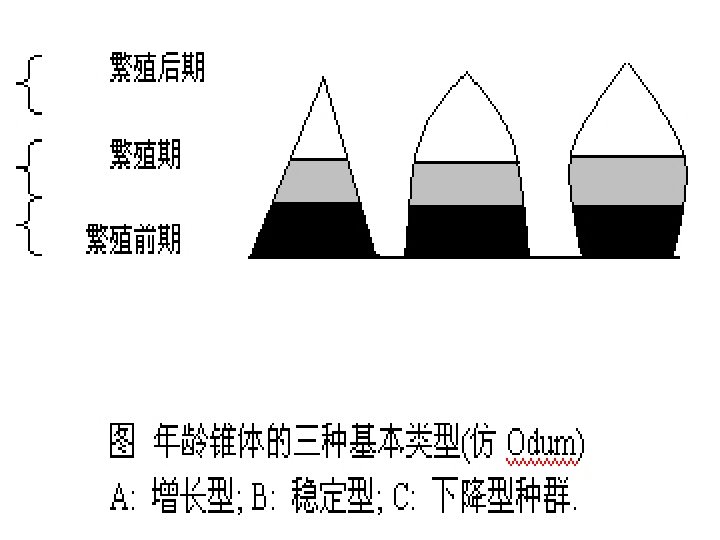
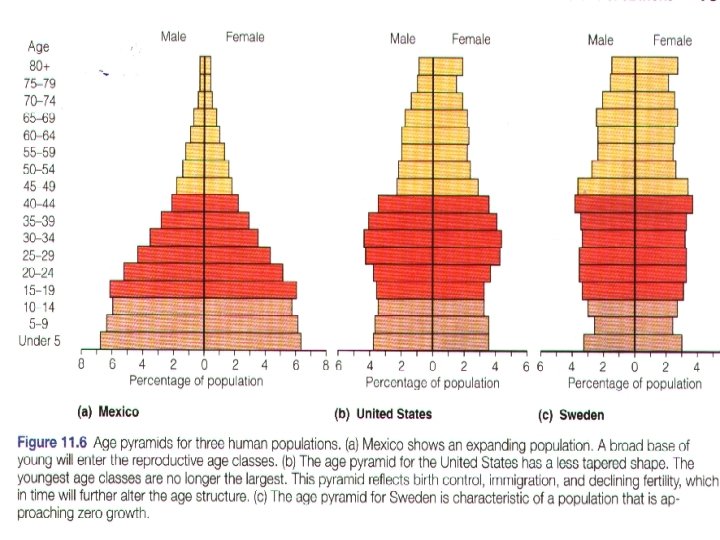
The age structure of a population is the number of Age and stage structure individuals in each age class expressed as a ratio, and is usually displayed as an age pyramid diagram. A population which is neither expanding nor contracting will have a stationary age distribution. A growing population will have more young. While a declining population will be dominated by older age classes. 种群的年龄结构是每一年龄阶段个体数目的比率, 年龄和时期 结构 通常以年龄金字塔图来表示。既不增长也不下降的 种群有稳定的年龄分布。增长型的种群有更多的年 轻个体,而在下降型种群中年老的个体占优势。
Where organisms pass through discrete growth stages (e. g. insect larval instars), the number of individuals at each stage (the ‘stage structure’) may provide a useful description of the population. In species where growth rates are indeterminant (such as plants), size classes may be more informative. 当种群经历离散和发育时期(如昆虫的龄期)时,每一时期 个体的数目(“时期结构”)可以对种群进行有效的描述。对 于生长率无法预测的物种(如植物),根据大小分类可能更 有意义。
NATALITY, MORTALITY AND POPULATION GROWTH Key Notes Natality is the birth of new individuals. The realized natality is the actual successful reproduction per female over a period of time. The age-specific birthrate is the number of offspring produced per unit time by females in specific age classes. 出生率就是新个体的产生,实际出生率就是一 出 生 率 段时间内每个雌体实际的成功繁殖量。特定年 龄出生率就是特定年龄组内雌体在单位时间内 产生的后代数量。
The death rate, or mortality rate, is the number of mortality individuals dying during a given time interval divided by the average population size over that time interval. This is an instantaneous rate and be estimated for the population as a whole or for specific age classes to give the age specific mortality rate. The probability of dying is the number dying per individual present at the start of the time period. 死亡率是在一定时间段内死亡个体的数量除以该时 间段内种群的平均大小。这是一个瞬时率,可用来 死 亡 率 估价整个种群的死亡率或特定年龄群的特定年龄死 亡率,死亡的概率是死亡个体数除以在每一时间段 开始时的个体数。
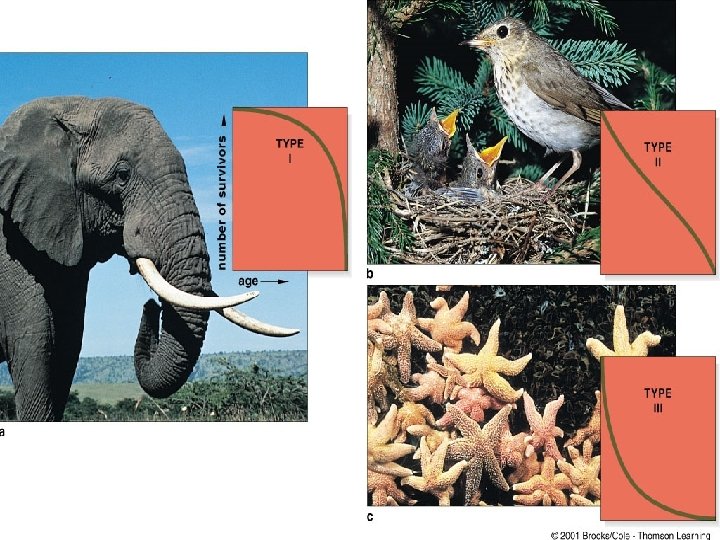
Survivorship is the converse of mortality. Survivorship data are often shown as a survivorship Survivorship curve for a particular population; a graph showing the proportion of survivors on a logarithmic scale through each phase of life. 存活率是死亡率的倒数。对于一个特定种 存 活 率 群,存活率的数据通常以存活曲线的形式 来表示;存活曲线表示的是在每一个生活 期存活个体所占的比率的对数值。
There are three generalized patterns of age-specific survivorship depending on whether the probability of dying is highest later in life (Type I), constant through life (Type II) or highest for young stages (Type III). 根据各种生活期死亡率的高低,特定年龄存活曲线一般有三种模式:后期死 亡率最高(类型I),各期死亡率相等(类型II),早期死亡率最高(类型 III)。
Life Table (1) Definition of life table (2) Types of life table (3) Excellences of life table
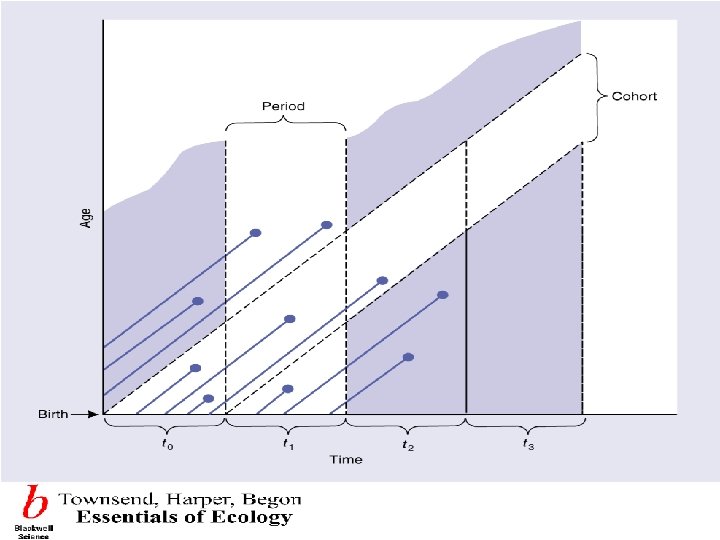
Dynamic life tables summarize the fate of a group of Dynamic and static life tables individuals born at approximately the same time from birth to the end of the life cycle. Such a group is known as a cohort and investigation of this kind is termed cohort analysis. Static life tables summarize the age structure born at special time. 动态生命表总结了一组出生时间大体相同的个体从出 动态和静态 生到死亡的命运,这样的一组个体称为同生群,这样 生命表 的调查称为同生群分析。静态生命表根据某一特定时 间对种群作一年龄结构调查资料
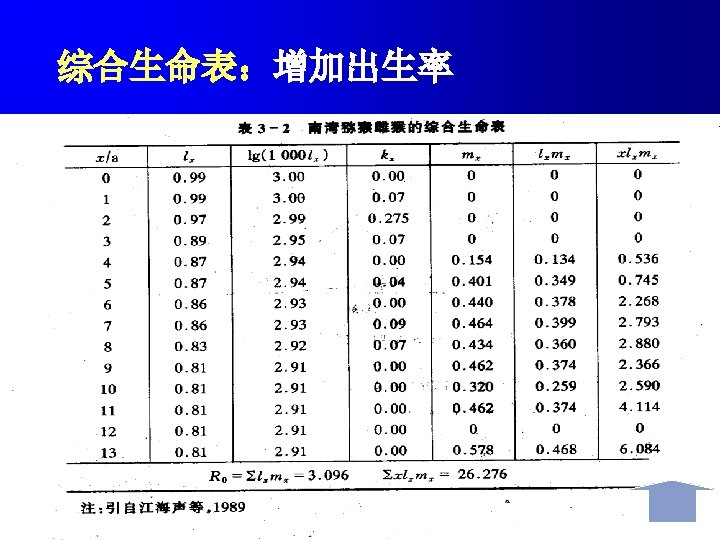
Life tables show the number of individuals present at different life stages or ages together with age-specific survival rates and age-specific mortality rates calculated for each stage. Mortality at each stage is expressed by k-values which are derived from logarithms and can be summed to give total mortality 生命表表示存在于不同生命阶段或年龄个体的数量,以及每 一阶段的年龄特定存活率和年龄特定死亡率。每一阶段的死 亡率用k值表示,k是通过对数函推导出来的,并且可以相加 得出总死亡率。
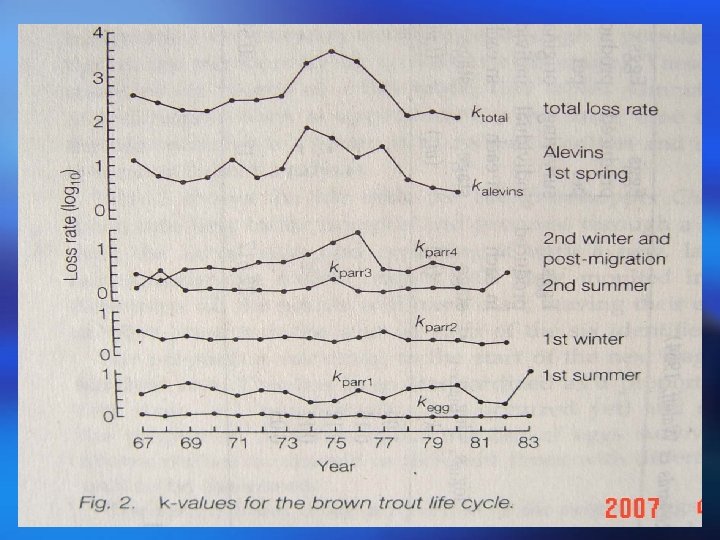
This technique allows the identification of key factors contributing to mortality. Stage-specific k-values k-Factor analysis obtained over successive years are compared to the values for total mortality (ktotal). K-Factor analysis highlights those stages suffering the greatest mortality which are responsible for fluctuations in loss rate and hence population size. 这一方法可以辩明关键因子对死亡率的作用。连续 K-因子分析 几年获得的特定阶段k值与总死亡率(k )相比。 总 K因子分析强调那些死亡率最高的阶段,这些阶段 是种群丧失率和种群大小波动的关键。
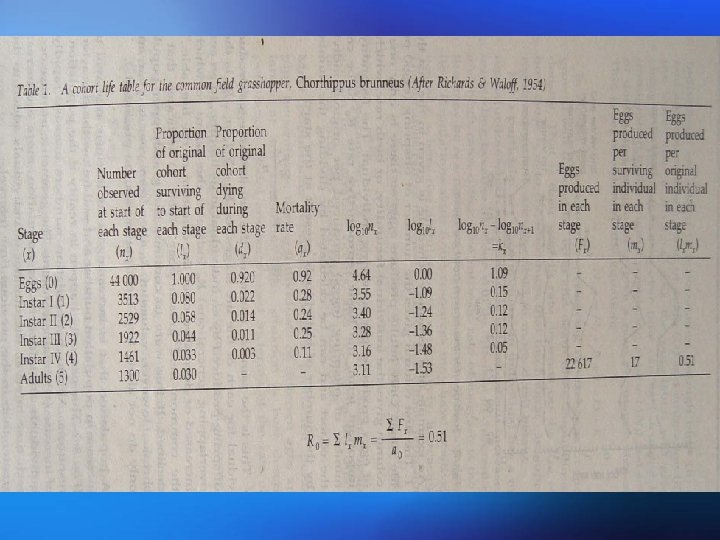
Fecundity is the number of eggs, seeds, or offspring in the first stage of the life cycle produced by an The fecundity schedule individual. The fecundity schedule allows the calculation of the basic reproductive rate R 0. This is the number of offspring produced per original individual by the end of the cohort. In an annual population, it indicates the overall extent to which the population has increased or decreased over that time. 生殖力是指同一个体生产的卵、种子或处于生活史第一阶 生殖力表 段后代的数目。生殖力表可计算基础生殖率R 0。R 0是在同 生群结束时每个亲体产生后代的数量。在一年生种群中, R 0表示在这段时间内,种植增长或下降的总的程度。
The changes in population size over time can be calculated by adding birth (B) and the number of population immigrants (I)to the original population at time t, (Nt ), growth and subtracting the number of deaths (D) and emigrants (E) to give a new population size an the time t+1(Nt+1). This is represented by the equation; N t+1 = N t +B + I – D – E 种群增长 种群大小随时间的变化可以按如下方法计算:t时间种 群原来数量(Nt),加上新出生的个体数(B)和迁入 个体数(I),减去死亡个体数(D)和迁出的个体数 (E),就可得到t+1时间种群的数量(N t+1),这可 用以下方程表示。 N t+1= Nt +B + I – D – E
For a particular set of conditions, an individual has a maximum potential for reproduction which is its intrinsic natural rate of increase, r. This is theoretical maximum that may be reached in a given environment if the population is not resource-limited. 在一组特定条件下,一个体具有最大的生殖潜力,称为内 禀自然增长率r。这是种群在不受资源限制的情况下,于一 定环境中可达到的理论最大值。 r = ln. R 0/T (T – 世代时间)
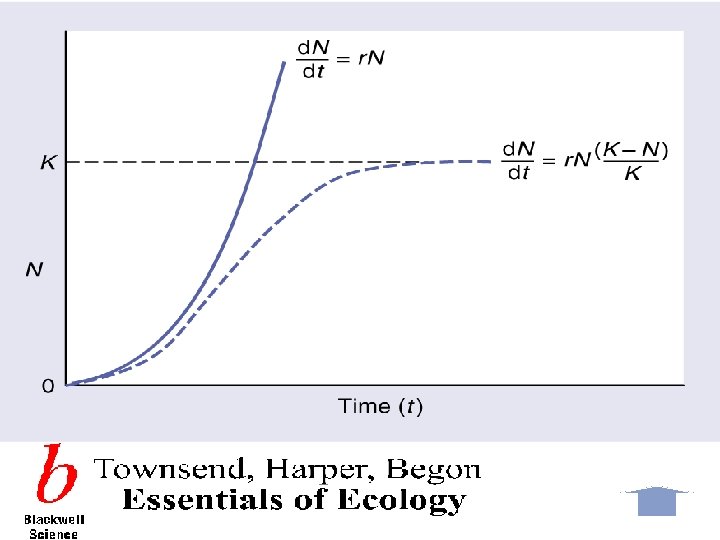
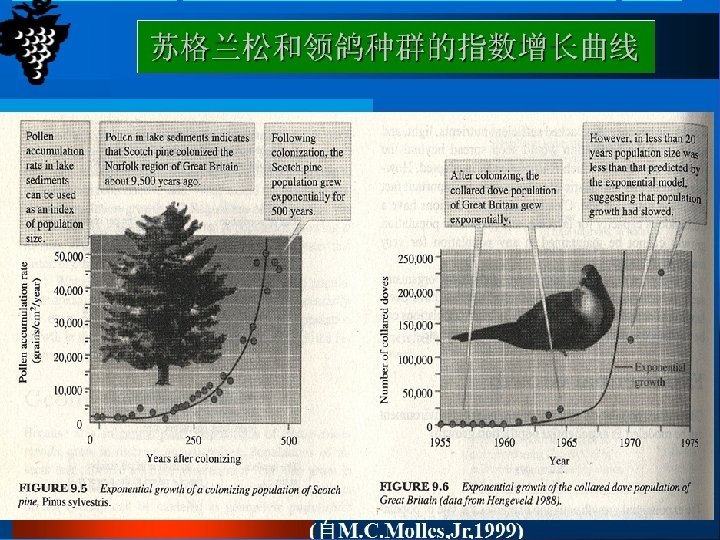
Densityindependent population growth Unlimited growth of this kind is described by a continuous population model and expressed in terms of the rate of change in population numbers at time t: Rate of change of population Size at time t = Intrinsic rate of increase × population size d. N/dt = r. N 这种无限增长可用连续型种群模型来描述,以在t时间 非密度制约性 种群增长 时,种群数量的变化率来表示: t时间种群大小的变化率=内禀增长率×种群大小 d. N/dt = r. N r>0种群上升;r=0种群稳定;r<0种群下降
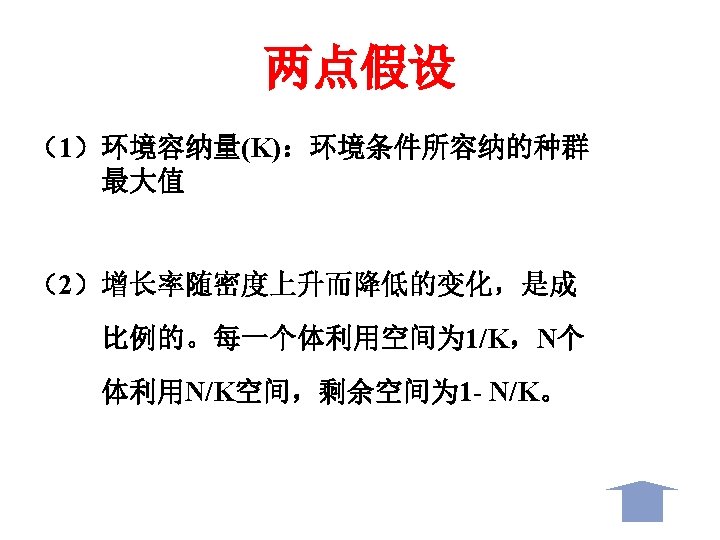
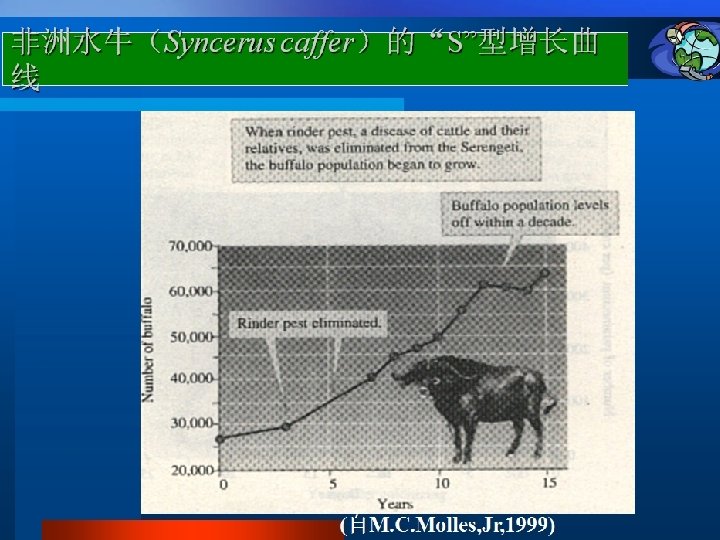
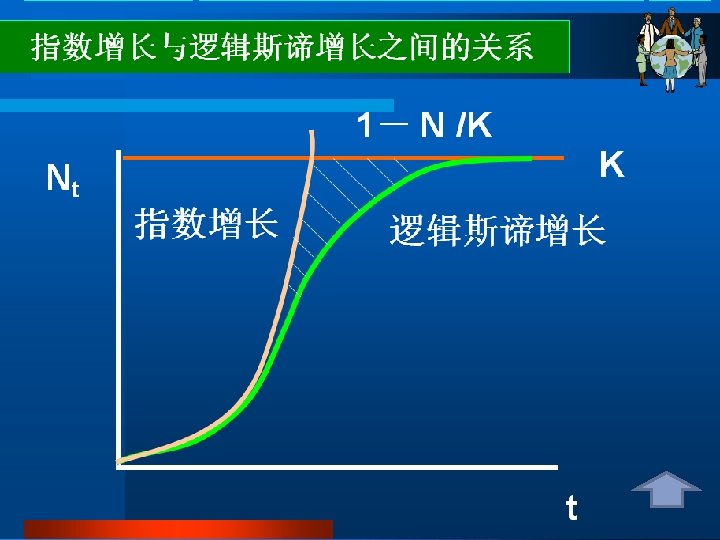
Density-dependent growth-the logistic equtation 密度制约性 种群增长: 逻辑斯谛方程 The logistic equation describes the growth of a simple population in a confined space, where resources are not unlimited. In the early stages resources are abundant, the death rate is minimal and reproduction can take place as fast as possible allowing the individuals to attain their intrinsic rate of increase. The population increases geometrically until the maximum number of individuals the environment can sustainably support is approached. This maximum number is called the carrying capacity (K). The population growth rate declines to zero as the population becomes more crowded and the population size stabilizes. 逻辑斯谛方程描述的是一个在有限资源空间中的简单种 群的增长。在早期,资源丰富,死亡率最小,繁殖尽可 能的快,种群内个体可达到内禀增长率。种群呈几何式 增长,直到种群数量达到环境可持续支持的最大程度, 即环境容纳量(K)。当种群更加拥挤时,种群增长率 减少到零,种群大小处于稳定状态。
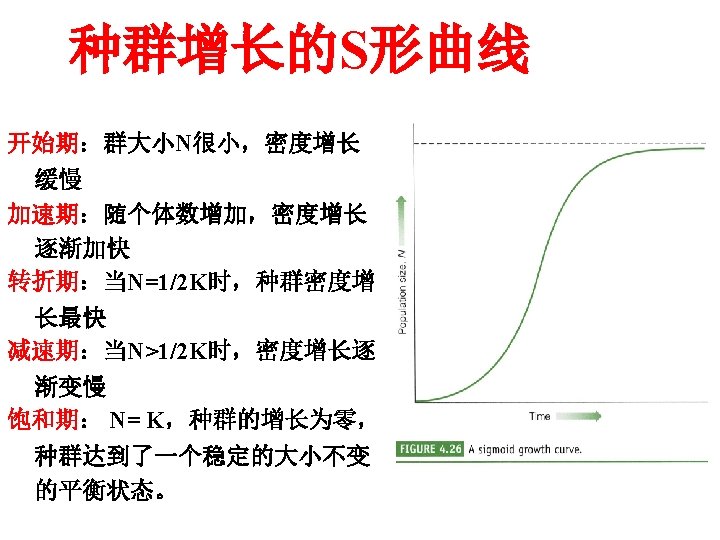
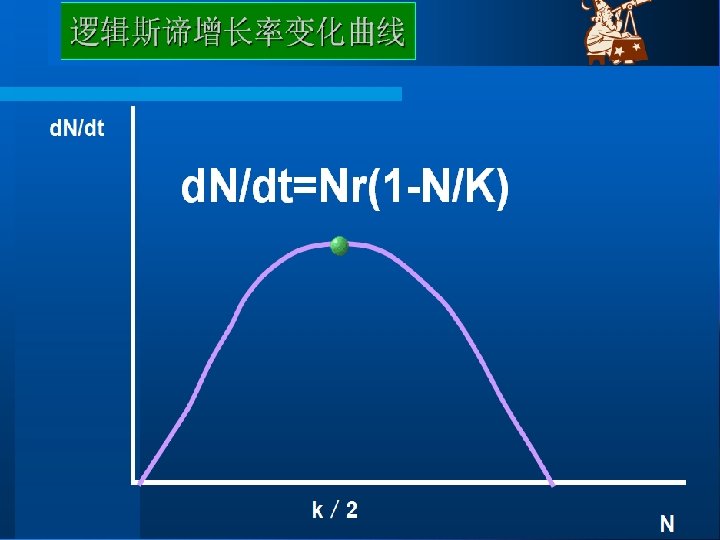
This can be described as the logistic equation : Rate of change of Population size at time t Intrinsic rate = of increase Population × size × Density dependent factor Dn/dt=r. N(1 -N/K) Where the density-dependent factor, (1 -N/K)approaches zero as the population approaches the carrying capacity and intraspecific competition becomes more intense. This equation predicts growth of a population over time to be sigmoidal, as is commonly observed in real populations. 这可用逻辑斯谛方程来表示: T时间种群大小变化率=内禀增长率×种群大小×密度制约因子 d. N/dt = r. N(1 - (N/K)) 当种群达到环境容纳量,种间竞争变得更激烈时,密度制约因子(1 - (N/K)) 会接近零。该方程预测种群的增长随时间变化呈现出“S”形,如在真实种群中 通常所观察的那样。
Exceeding carrying capacity can damage the ecosystem, reducing its ability to support population - Reindeer example.
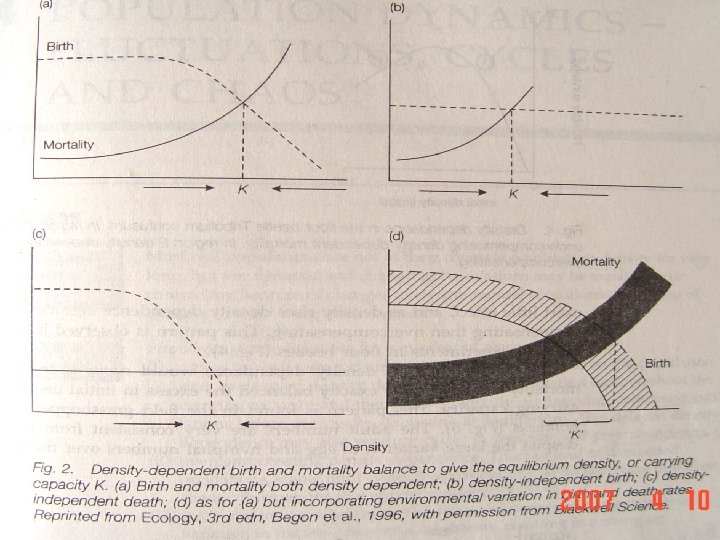
The equilibrium population density occurs when the per capita death rate exactly balances the per capita Equilibrium birth rate such that the density is neither increasing nor population decreasing. The equilibrium population density is density equivalent to the carrying capacity K. 当单位个体出生率正好平衡单位个体死亡率,种群 平衡种群 密度 密度既不增加也不减少时,此时的种群密度为平衡 种群密度。平衡种群密度与环境容纳量K值相等。
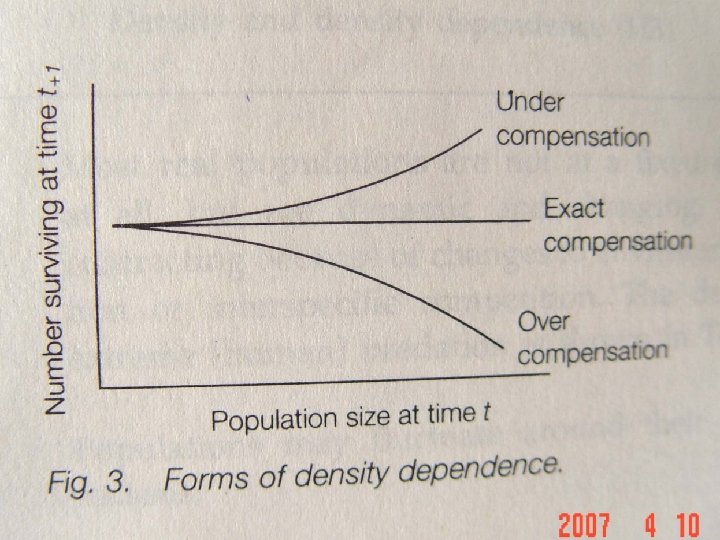
There are three types of density dependence: overcompensating, under compensating and exactly compensating. If a decline in numbers due to density dependence does not outweigh or Compensation and density balance the initial increase in numbers, density dependence is dependence under compensating. Overcompensating density dependence occurs where the effect of increased density more than outweighs the initial augmentation. If the decline in numbers exactly balances the initial increase in density, density dependence is said to be exactly compensating. 密度制约有三种形式:过度补偿,补偿不足和准确补偿。如 果密度制约引起的数量下降,没有超过或等于开始增加的个 补偿和密度 制约 体数量,则密度制约是补偿不足。当密度制约的效应超过了 开始种群数量的增加,称为过度补偿。如果下降个体数与开 始增加的个体数相等,则称密度制约为准确补偿。
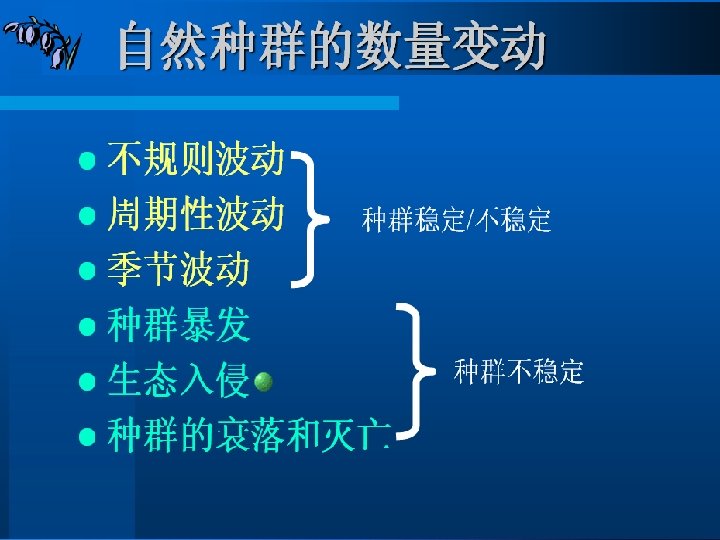
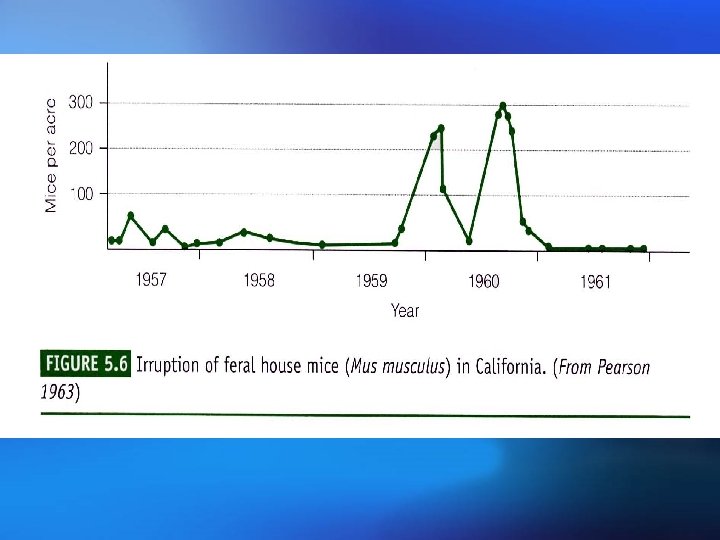
POPULATION DYNAMICS – FLUCTUATIONS AND CYCLES Most real populations are not at their constant Expanding and contracting populations equilibrium density for very long, but are dynamic and changing. Populations may be expanding or contracting because of changes in environmental conditions or because of changes to their biotic environment. 大多数实际种群并不是在平衡密度停留很长时间, 增长种群和 收缩种群 而是动态的不断的发生变化。由于周围环境的变 化或生物因子的影响,种群可能会增长或收缩。
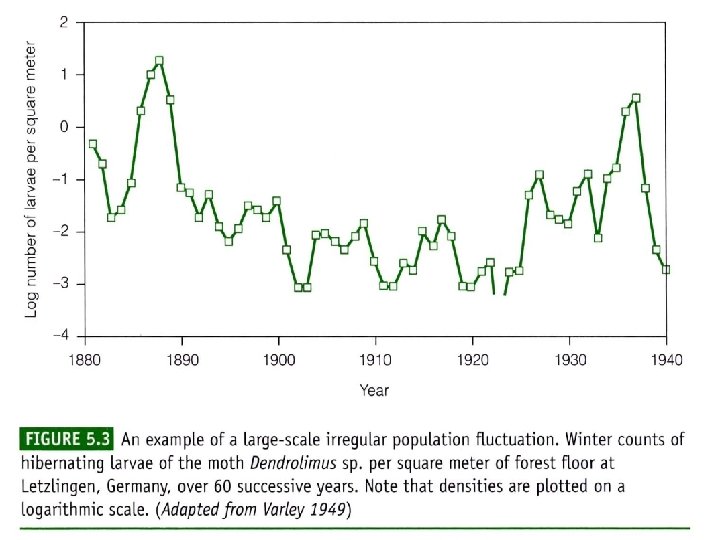
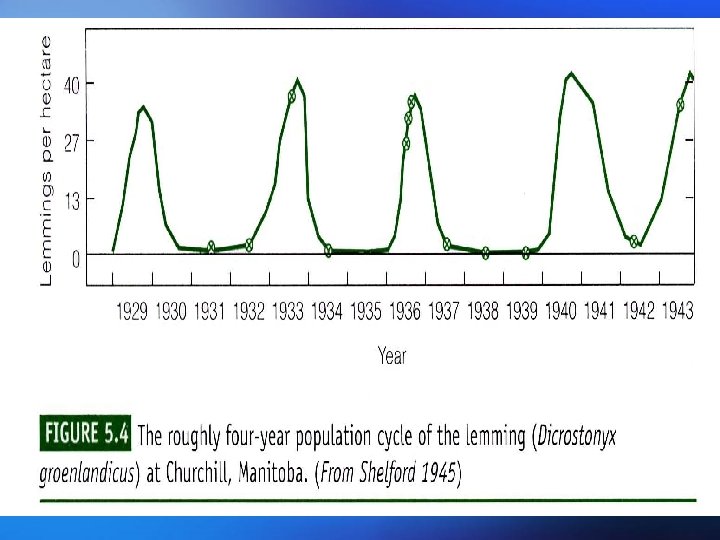
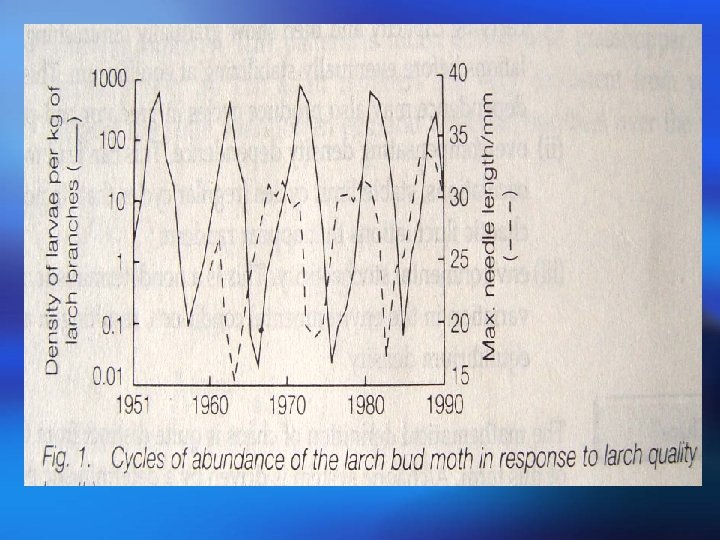
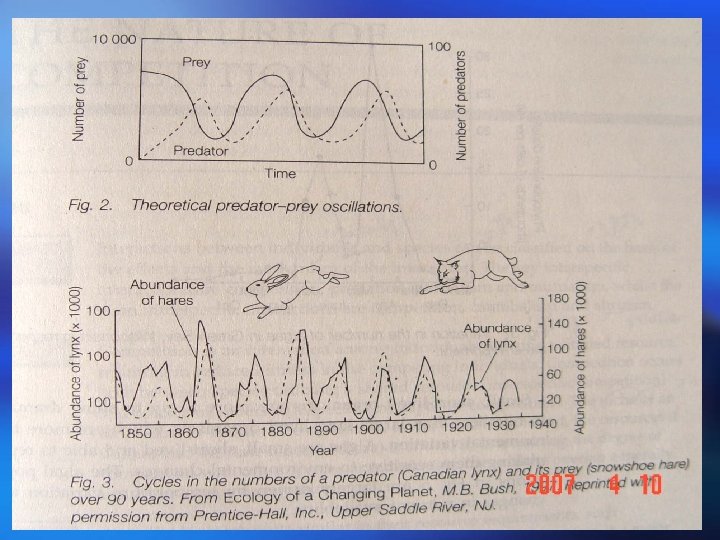
Populations may fluctuate for a number of reasons: Populations (i) A time lag between a change in density and its effect on fluctuations the population size, or delayed density dependence, The population can overshoot the carrying capacity and then show gradually diminishing, dampened oscillations before eventually stabilizing at equilibrium. This delayed density dependence may also produce cycles in predator and prey abundance; 种群波动可能有以下几个原因: (i )时滞或称为延缓的密度制约,存在于密度变化及其对 种群波动 种群大小的影响之间。种群可能超过环境容纳量,然后 逐渐减少,在最终达到平衡之前呈现减幅振荡。这种延 缓的密度制约可能使捕食者和猎物多度之间产生周期。
(ii) Overcompensating density dependence. This can lead to dampened oscillations, stable limit cycles (regular cycles that do not damp down) or chaotic fluctuations that appear random; (iii) Environmental stochasticity. This is a nondeterministic, unpredictable variation in the environmental conditions, resulting in a changing equilibrium density. (ii)过度补偿性密度制约。其可能导致减幅振荡、稳定极限 环(非减幅振荡的有规律周期变化)或无规则随机振荡。 (iii)环境随机变化。环境条件非确定性的、不可预见性的 变化会导致平衡密度的变化。