Population surveys n n n Provide more detailed


 http:")


 Lindau ST, Laumann EO, Levinson W, Waite LJ. Perspectives")


 AGE 57 -64 65 -74 75 -85 RACE/ETHNICITY White African-American")


 UC Cytopathology (Cytology) “Laboratory Without Walls” Jordan Clinical")

 log(estradiol) Units: pg/ml log(progesterone) log(testosterone)")


 n Epstein-Barr Virus (EBV) Antibody Titers Thanks,")


 Men ( 39%) % 100 АД>=140/90 мм рт.")
 Men (63, 2%) 60 40. 20")
 100 90")

")

 HLE Disability")


")


 n Lxh = L x x π x")


 First question: “Within the past 2")


- Slides: 88
Population surveys n n n Provide more detailed information on specific topics compared to censuses Cover relatively small proportion of population (usually several thousand) Population-based survey – random sample of the total population; represents existing groups of population
International Surveys in Russia and FSU n n Russia Longitudinal Monitoring Survey (RLMS) http: //www. cpc. unc. edu/rlms/ Demographic and Health Surveys (DHS) are nationally-representative household surveys that provide data for a wide range of monitoring and impact evaluation indicators in the areas of population, health, and nutrition. http: //www. measuredhs. com
http: //www. cpc. unc. edu/projects/rlms 16 раундов обследования
Demographic and Health Surveys n n n n Child Health - vaccinations, childhood illness Education - highest level achieved, school enrollment Family Planning knowledge and use of family planning, attitudes Female Genital Cutting - prevalence of and attitudes about female genital cutting Fertility and Fertility Preferences - total fertility rate, desired family size, marriage and sexual activity Gender/Domestic Violence - history of domestic violence, frequency and consequences of violence HIV/AIDS Knowledge, Attitudes, and Behavior - knowledge of HIV prevention, misconceptions, stigma, higher-risk sexual behavior HIV Prevalence - Prevalence of HIV by demographic and behavioral characteristics Household and Respondent Characteristics- electricity, access to water, possessions, education and school attendance, employment Infant and Child Mortality - infant and child mortality rates Malaria - knowledge about malaria transmission, use of bednets among children and women, frequency and treatment of fever Maternal Health - access to antenatal, delivery and postnatal care Maternal Mortality - maternal mortality ratio Nutrition - breastfeeding, vitamin supplementation, anthropometry, anemia Wealth/Socioeconomics - division of households into 5 wealth quintiles to show relationship between wealth, population and health indicators Women's Empowerment - gender attitudes, women’s decision making power, education and employment of men vs. women
DHS sample designs The sample is generally representative: n At the national level n At the residence level (urban-rural) n At the regional level (departments, states) The sample is usually based on a stratified two-stage cluster design: n First stage: Enumeration Areas (EA) are generally drawn from Census files n Second stage: in each EA selected, a sample of households is drawn from an updated list of households n
Biomarkers in Population-Based Aging and Longevity Research Natalia Gavrilova, Ph. D. Stacy Tessler Lindau, MD, MAPP CCBAR Supported by the National Institutes of Health (P 30 AG 012857) NSHAP Supported by the National Institutes of Health (5 R 01 AG 021487) including: National Institute on Aging Office of Research on Women's Health Office of AIDS Research Office of Behavioral and Social Sciences Research
n Goals: Foster interdisciplinary research community n Establish means of exchanging rapidly evolving ideas related to biomarker collection in population-based health research n Translation to clinical, remote, understudied areas n
Why? n n Need for move from interdisciplinary data COLLECTION to integrated data ANALYSIS Barriers Models/methods n Rules of academe n Reviewers/editors n
Why? n Growing emphasis on value of interdisciplinary health research NIH Roadmap Initiative n NAS report n n Overcome barriers of unidisciplinary health research Concern for health disparities n Response bias in clinical setting n Self-report in social science research n
What is needed? n n Methods and models for analytic integration Streamlining data collection Advances in instruments n Minimally invasive techniques n Best practices n Concern for ethical issues n Central coordination? n
Outline n NSHAP study as an example of a population-based study collecting biomarkers n Theoretical Foundations for Integrated Health Research n CCBAR website
Introduction to:
Public Dataset http: //www. icpsr. umich. edu/NACDA/
NSHAP Collaborators n Co-Investigators n n n n Linda Waite, PI Ed Laumann Wendy Levinson Martha Mc. Clintock Stacy Tessler Lindau Colm O’Muircheartaigh Phil Schumm NORC Team n Stephen Smith and many others n n n Collaborators n David Friedman n Thomas Hummel n Jeanne Jordan n Johan Lundstrom n Thomas Mc. Dade Ethics Consultant n John Lantos Outstanding Research Associates and Staff
Affiliated Investigators and Labs LAB SPECIMENS ASHA Test results Lundstrom, Sweden Olfaction Hummel, Germany Gustation Magee Women’s Hospital, Jeanne Jordon Vaginal Swabs, TM Orasure Mc. Clintock Lab, Univ. Chicago Vaginal Cytology Mc. Dade Lab, Northwestern Univ. Blood Spots Salimetrics Saliva USDTL* Urine
Corporate Contributions and Grants Item Company/Contact Information Smell pens Martha Mc. Clintock, Institute for Mind and Biology at the University of Chicago Ora. Sure collection device Orasure Technologies Digital scales Sunbeam Corporation Blood pressure monitors A & D Lifesource Vision charts David Freidman, Wilmer Eye Institute at the Johns Hopkins Bloomberg School of Public Health Filter paper for blood spot collection Schleicher & Schuell Bioscience Blood pressure cuff (large size) A & D Lifesource Ora. Sure Western Blot Kit Biomerieux Company HPV kits Digene Laboratory Boxes of swabs Digene Laboratory 2 -point discriminators Richard Williams
Study Timeline n Funding: NIH / October, 2003 n Pretest: September – December, 2004 n Wave I Field Period: June 2005 – March 2006 n Wave I Analysis: Began October, 2006
He, W. , Sengupta, M. , Velkoff, V. A. , De. Barros, K. A. (2005). 65+ In the United States: 2005. Current Population Reports: Special Studies, U. S. Census Bureau.
The Interactive Biopsychosocial Model (IBM) Lindau ST, Laumann EO, Levinson W, Waite LJ. Perspectives in Biology & Medicine. (2003)
Conceptual Framework INTERACTIVE BIOPSYCHOSOCIAL MODEL Sexuality Health Biological/ Physiological Mechanisms TIME HYPOTHESIS: Positive sexual relationships promote health and mitigate illness as people age.
Integrated Health Research Social Factors Biological / Physiologica l Mechanisms Health TIME Social Factors Biological / Physiologic al Mechanisms
NSHAP Design Overview n n Interview 3, 005 community-residing adults ages 57 -85 Population-based sample, minority over-sampling 75. 5% weighted response rate 120 -minute in-home interview Questionnaire n Biomarker collection n n Leave-behind questionnaire
Est. Pop. Distributions (%) AGE 57 -64 65 -74 75 -85 RACE/ETHNICITY White African-American Latino Other RELATIONSHIP STATUS Married Other intimate relationship No relationship SELF-RATED HEALTH Poor/Fair Good Very good/Excellent Men (n=1455) Women (n=1550) 43. 6 35. 0 21. 4 39. 2 34. 8 26. 0 80. 6 9. 2 7. 0 3. 2 80. 3 10. 7 6. 7 2. 2 77. 9 7. 4 14. 7 55. 5 39. 0 25. 5 27. 5 47. 0 24. 2 31. 5 44. 3
Domains of Inquiry n Demographics n n n Basic Background Information Marriage Employment and Finances Religion n n Social n n n Networks Social Support Activities, Engagement Intimate relationships, sexual partnerships Physical Contact Medical n n Physical Health Medications, vitamins, nutritional supplements Mental Health Caregiving HIV Women’s Health n n Ob/gyn history, care Hysterectomy, oophorectomy Vaginitis, STDs Incontinence
NSHAP Biomeasures n Blood: hgb, Hgb. A 1 c, CRP, EBV n Saliva: estradiol, testosterone, progesterone, DHEA, cotinine n Vaginal Swabs: BV, yeast, HPV, cytology n Anthropometrics: ht, waist n Physiological: BP, HR and regularity n Sensory: olfaction, taste, vision, touch n Physical: gait, balance
NSHAP Biomeasures Cooperation
Principles of Minimal Invasiveness n Compelling rationale: high value to individual health, population health or scientific discovery n In-home collection is feasible n Cognitively simple n Can be self-administered or implemented by single data collector during a single visit n Affordable n Low risk to participant and data collector n Low physical and psychological burden n Minimal interference with participant’s daily routine n Logistically simple process for transport from home to laboratory n Validity with acceptable reliability, precision and accuracy Lindau ST and Mc. Dade TW. 2006. Minimally-Invasive and Innovative Methods for Biomeasure Collection in Population-Based Research. National Academies and Committee on Population Workshop. Under Review.
Applying Biomeasures in NSHAP Uses of Biomeasures Population-Based Sample Clinic-Based Sample ++ ++ -- ++ To determine effectiveness of intervention ++ + To identify biological correlates or mechanisms of social/environmental conditions ++ -- To detect and monitor risk for disease, pre-disease, mortality OR to quantify and monitor function To recruit or exclude people from study To determine efficacy of intervention ++ = Very well suited -- = Poorly suited
Applying Biomeasures in NSHAP Uses of Biomeasures Population-Based Sample Clinic-Based Sample To detect and monitor risk for disease, pre-disease, mortality OR to quantify and monitor function RISK: Genital HPV Tobacco use Obesity FUNCTION: Mucosal integrity Sex hormone metabolism ++ -- ++ Future public health interventions: e. g. smoking cessation, HPV vaccine, new hearing devices + To recruit or exclude people from study To determine efficacy of intervention To determine effectiveness of intervention To identify biological correlates or mechanisms of ++ = Very well suited social/environmental Hypertension Impaired Glucose -- = Poorly suited --
Disciplinary Use of Biomeasures Population-Based Sample Clinic-Based Sample To detect and monitor risk for disease, pre-disease, mortality OR to quantify and monitor function RISK: Genital HPV Tobacco use Obesity EPIDEMIOLOGY FUNCTION: Mucosal integrity Sex hormone metabolism ++ -- ++ Future public health EPIDEMIOLOGY + To recruit or exclude people from study To determine efficacy of intervention To determine effectiveness of intervention BIOMEDICINE Uses of Biomeasures interventions: e. g. smoking cessation, HPV vaccine, new hearing devices BIODEMOGRAPHY/ANTHROPOLOGY To identify biological correlates or mechanisms of social/environmental ++ = Very well suited Hypertension Impaired Glucose Metabolism -- = Poorly suited --
NSHAP Biomeasures Mc. Clintock Laboratory (Cytology) UC Cytopathology (Cytology) “Laboratory Without Walls” Jordan Clinical Lab Magee Women’s Hospital (Bacterial, HPV Analysis) Salimetrics (Saliva Analysis) Mc. Dade Lab Northwestern (Blood Spot Analysis)
Salivary Biomeasures n Sex hormone assays n Estradiol n Progesterone n DHEA n Testosterone n Cotinine
Frequency Salivary Sex Hormones (preliminary analysis) log(estradiol) Units: pg/ml log(progesterone) log(testosterone)
Salivary Cotinine n Nicotine metabolite n Objective marker of tobacco exposure, including second-hand n Non-invasive collection method (vs. serum cotinine)
Distribution of Salivary Cotinine Classification of Smoking Status by Cotinine Level in Females Cut-points based on distribution among smokers. 2 Occasional Fraction . 15 Nonsmoker Passive Regular . 1 10 ng 15 ng 34 ng 10% M 103 ng 30% M 344 ng M . 05 0 -5 0 log(Cotinine) M = mean cotinine among female who report current smoking Bar on left corresponds to cotinine below level of detection 5 10
Dried Blood Spots n C-Reactive Protein (CRP) n Epstein-Barr Virus (EBV) Antibody Titers Thanks, Thom and Mc. Dade Lab Staff!
Self-Report Measures n Demographic Variables: n Age n Race/Ethnicity n Education n Insurance Status
Self-Report Measures n Social/Sexuality Variables: n Spousal/other intimate partner status n Cohabitation n Lifetime sex partners n Sex partners in last 12 months n Frequency of sex in last 12 months n Frequency of vaginal intercourse n Condom use
Self-Report Measures n Health Measures: n Obstetric/Gynecologic history n Number of pregnancies n Duration since last menstrual period n Hysterectomy n Physical health n Overall health n Co-morbidities n Health behaviors n Tobacco use n Pap smear, pelvic exam history n Cancer
Challenges
Human Subjects Issues in Data Analysis n Additional HPV testing considered “future use” n Genotyping of Hybrid Capture 2 negative specimens n Consent for additional genotyping? n Commercial availability of genotyping assays (experimental vs. FDA-approved)
Specimen Storage First enrollment July, 2005 Last enrollment March 2006 Specimens collected and sent to lab When does a study end? Initial storage (pre-assay) Interim storage (post-assay) Continued storage (post-assay) Destruction? Storage for future use?
More Information on Biomarkers is Available at the CCBAR website http: //biomarkers. uchicago. edu/
CCBAR Website Objectives n n n Central resource for collecting, monitoring, and disseminating the most recent developments Virtual research collaborative, establishing a means of exchanging rapidly evolving ideas related to all aspects of biomarker collection in population-based research Educate public about integrated population -based health research
Studies Collecting Biomarkers in Population Settings Local, regional, national and international studies and investigators involved in populationbased health research involving collection of biological and physical measures.
Web-based search of studies collecting specific biomarkers
Studies collecting C-reactive protein
Measures of Population Health
Self-Rated Health Information from population surveys
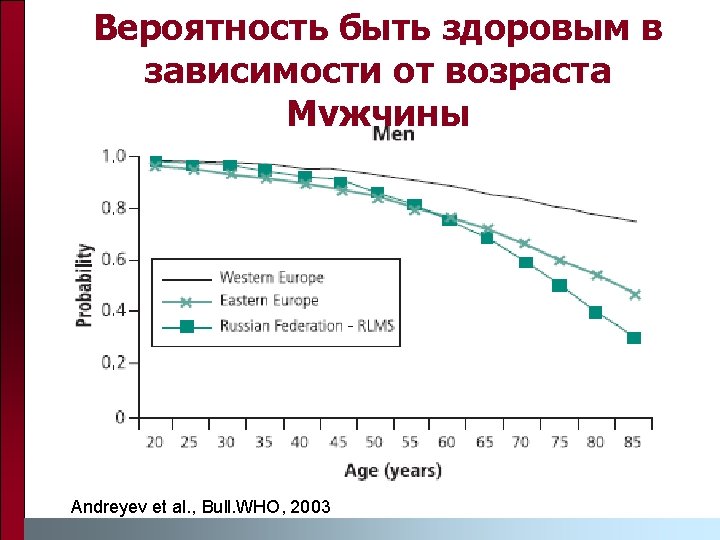
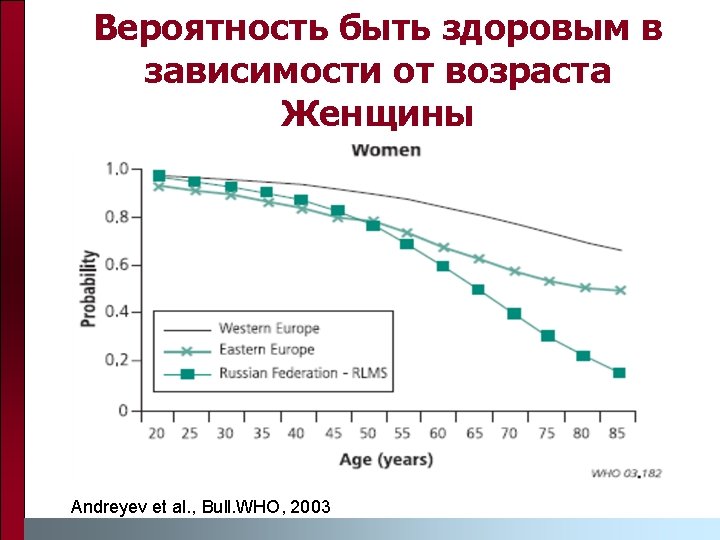
Healthy Life Expectancy in Russia and USA
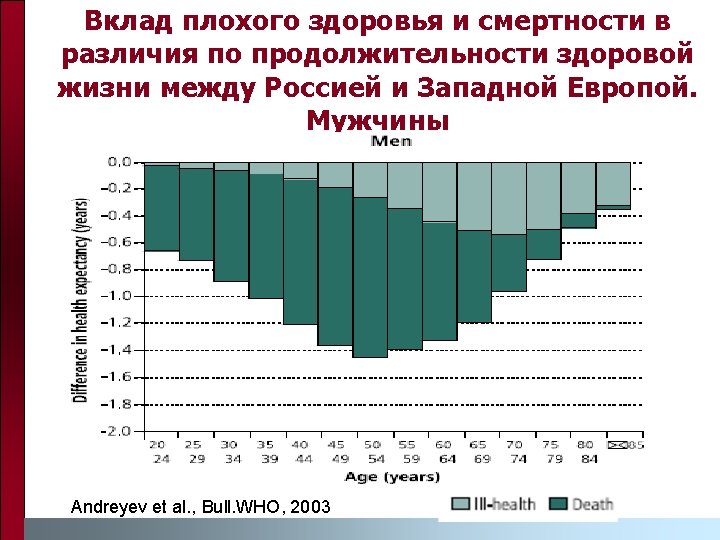
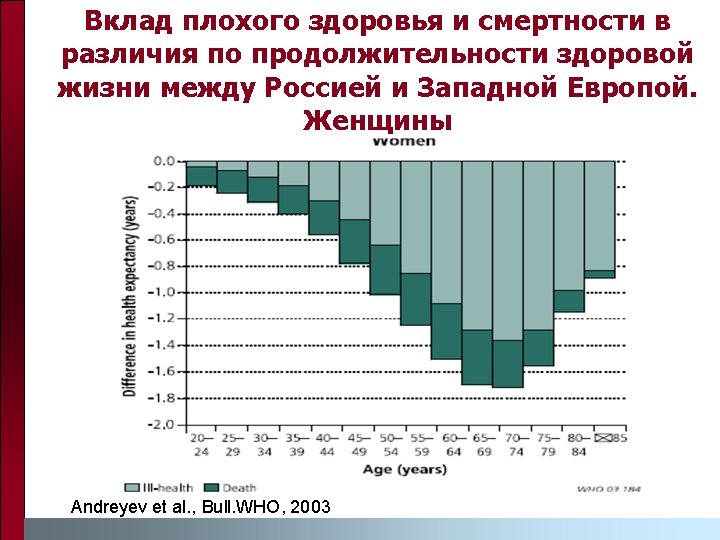
Expected Years in Poor Health
Russia vs. Canada: Health Status
Self-reported health. Both sexes 60 50 40 Very good/good 30 Medium 20 Poor/very poor 10 0 Ukraine 2000 Russia 1998
Risk factors including lifestyle
Survival of men by alcohol consumption level 1 Survival 0, 75 Life span: 0, 5 -3, 8 0, 25 -5, 0 0 40 45 50 . 55 60 65 70 75 Age Never Moderate High(>168 g/week ) Russian Lipid Clinics Study 80
Survival of women by alcohol consumption level Survival 1 0, 75 Lifespan: 0, 5 -2, 5 0, 25 -8, 6 0 40 44 48 . 52 56 В о з р а с т Never 60 64 68 72 76 80 д о ж и т и я (г о д ы) Moderate High (>84 g/week) Russian Lipid Clinics Study 84
Prevalence of hypertension Women ( 41%) Men ( 39%) % 100 АД>=140/90 мм рт. ст. 80 60 40 . 20 0 20 -29 30 -39 40 -49 50 -59 60 -69 70 -79 80 -89 90+ Age groups (years) Russian representative sample
Prevalence of smoking 80 % Women (9, 7%) Men (63, 2%) 60 40. 20 0 20 -29 30 -39 40 -49 50 -59 60 -69 70 -79 Age group Russian representative sample 80 -89
Responses of smokers and non-smokers about health effects of active smoking (Ukraine) 100 90 80 70 % 60 Non-smokers 50 Smokers 40 30 20 10 0 Good for health Helps to relax No effect Sometimes causes disease Bad for health
Living longer but healthier? n Keeping the sick and frail alive n n Delaying onset and progression n n expansion of morbidity (Kramer, 1980). compression of morbidity (Fries, 1980, 1989). Somewhere in between: disability but less severe n dynamic equilibrium (Manton, 1982). more
WHO model of health transition (1984)
Quality or quantity of life? Health expectancy n partitions years of life at a particular age into years healthy and unhealthy n adds information on quality n is used to: n n monitor population health over time compare countries (EU Healthy Life Years) compare regions within countries compare different social groups within a population (education, social class)
What is the best measure? Health Expectancy Healthy LE (self rated health) HLE Disability free LE DFLE Disease free LE Dem. FLE Cog imp-free LE Active LE (ADL) Many measures of health = many health expectancies!
What is the best measure? Depends on the question n Need a range of severity n n n Performance versus self-report n n dynamic equilibrium cultural differences Cross-national comparability n translation issues
Cross-sectional versus longitudinal data
X-sectional versus longitudinal data n The simplest method of calculating a health expectancy is Sullivan’s method (Sullivan 1971) with: n n n prevalence of the health state from a cross-sectional survey a standard life table for the same period Multi-state life tables require longitudinal data on transitions between health states and death
HE with cross-sectional data Mortality data Age specific prevalence of ill-health (e. g. disability) Life table Life expectancy LE free of disability LE with disability
HE with longitudinal data Baseline No disability Disability Follow-up No disability Dead
X-sectional versus longitudinal n Cross-sectional + easiest for trends - life tables not available for subgroups n Longitudinal + explicitly estimates incidence and recovery providing better future forecasts - cost, attrition Not either/or but must include institutional population
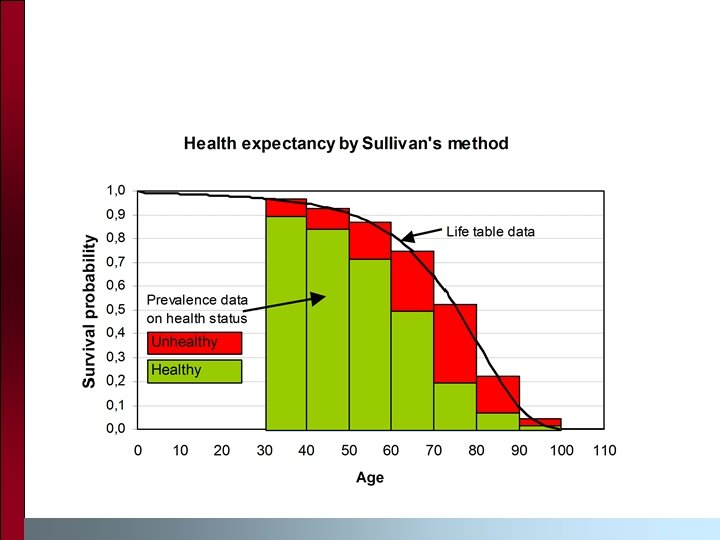
Estimation of health expectancy by Sullivan’s method
Life expectancy 1. 0 Survival probability 0. 9 0. 8 0. 7 0. 6 0. 5 0. 4 Life expectancy 0. 3 0. 2 0. 1 0. 0 0 10 20 30 40 50 60 Age 70 80 90 100 110
Calculation of health expectancy (Sullivan method) n Lxh = L x x π x n Where πx - prevalence of healthy individuals at age x Lxh - person-years of life in healthy state in age interval (x, x+1) n
Choice of health expectancy indicators
Self-rated health Interview question: “How do you rate your present state of health in general? ” Answer categories: § Very good § Good § Fair § Poor § Very poor } } Dichotomised
Long-standing illness Interview question: “Do you suffer from any long-standing illness, longstanding after-effect of injury, any handicap, or other long-standing condition? ”
Long-lasting restrictions (if “yes” to the following questions) First question: “Within the past 2 weeks, has illness, injury or ailment made it difficult or impossible for you to carry out your usual activities? ” Second question: “Have these difficulties/restrictions been of a more chronic nature? By chronic is meant that the difficulties/restrictions have lasted or are expected to last 6 months or more”
Total survival, survival without disability and survival without chronic disease, France 1981 -1991, females
Future potential of HLE n Are social and regional inequalities widening? n n Diseases more or less disabling? n n effect of greater access to education in new cohorts saving lives v reducing disability Living longer healthier? n new cohorts with more ethnic minority elders
Issues Must have total population including those in institutions n Cultural differences in self-report? n Accurate translation to underlying concepts for cross national comparability n