Population Species A group of organisms so similar


- Slides: 22
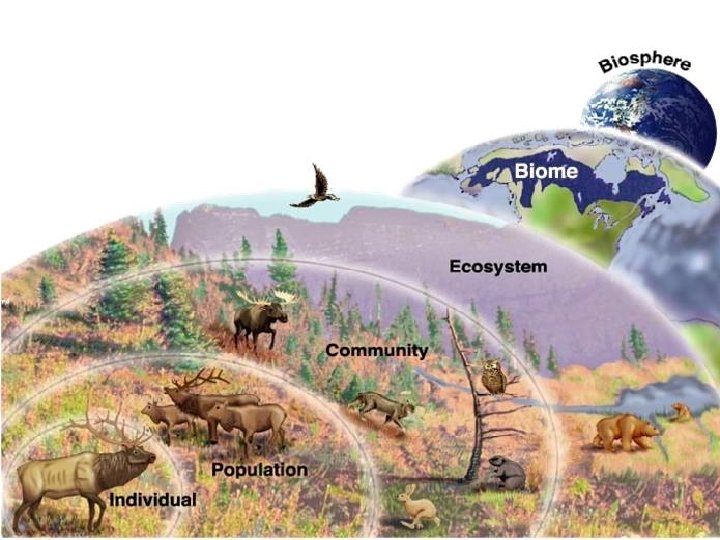
Population
Species • A group of organisms so similar to one another that they can breed and produce fertile offspring.
Population • All members of a species that live in the same geographic area.
Habitat vs. Niche • Habitat - the area where a species lives. • Niche – how a species lives (function) in that habitat
What is the coyote habitat and niche?
What determines a niche? • The niche is influenced by biotic factors (food, predators, mates) and abiotic factors (temperature, sunlight, water). • The number of different niches is determined by the abiotic factors in an environment.
How do predators impact a niche? • Predators increase niche diversity by decreasing prey population size. • A predator that promotes a great niche diversity is called a keystone predator. • A predator without its own predator is called an apex predator
Community • All the different populations that live and interact in the same area.
Ecosystem • Includes all the communities in an area, as well as the abiotic factors in the environment. • Biotic factors: Living factors (predation, competition etc. ) • Abiotic: Non-living factors (temperature, disease etc. )
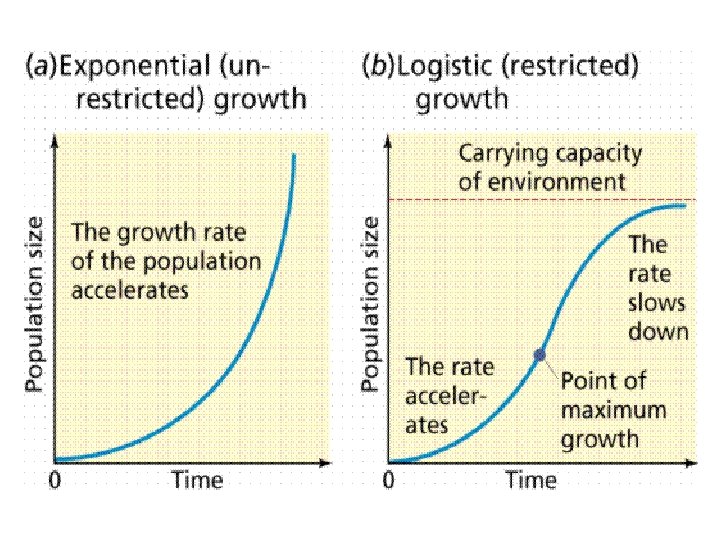
Population Control • Populations have the reproductive ability to produce unrealistically large populations. – This is called exponential growth • Some populations sizes are restricted by a carrying capacity - the maximum population size of the species that the environment can sustain – This is called logistic growth
What factors limit population growth? • Biotic potential is the maximum capacity of an individual or population to reproduce under optimal environmental conditions. • Limits to the biotic potential are caused by: – Disease – Predation – Restricted food resources
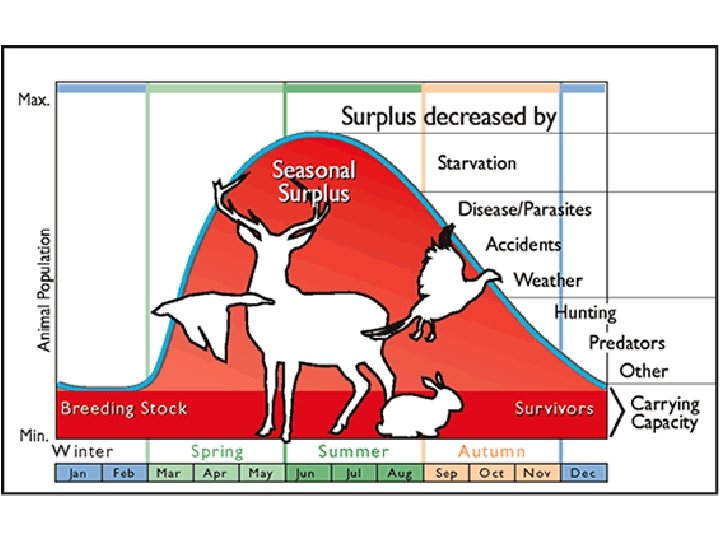
Carrying Capacity • Most populations stop growing when they reach their carrying capacity. Limiting factors include: – Density-dependent factors: predation, parasitism, disease, food competition, living space, water availability – Density-independent factors: climate, human disturbance, natural disasters
What are some limiting factors for human populations? • Famine, Disease, War, Birth control • 3 surges of human growth due to… – Tool development (efficient hunting) – Agriculture (dependable food supplies) – Health care, industrialization, and technology Humans are the only species that have been able to grow so large due to our ability to manipulate the environment
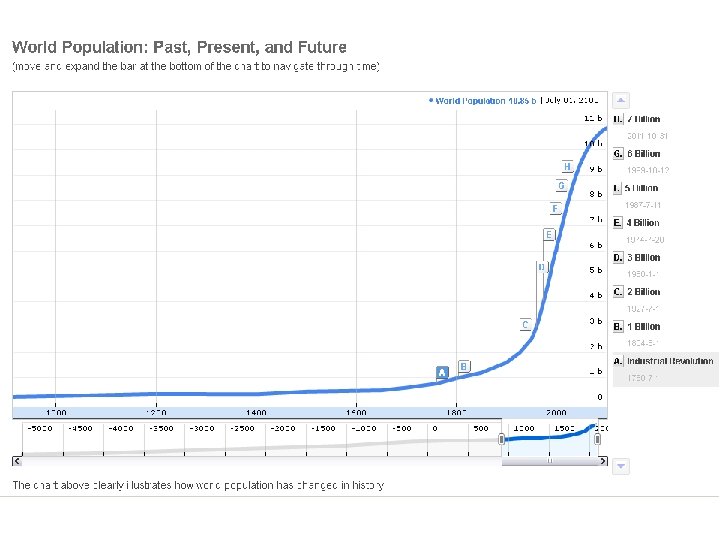
Exponential Growth Although it had taken all of human history until around 1800 for world population to reach one billion, • • the second billion was achieved in only 130 years (1930) the third billion in less than 30 years (1959) the fourth billion in 15 years (1974) the fifth billion in only 13 years (1987) Currently at: 7, 279, 955, 575 @ 3: 30 pm 12/9/14
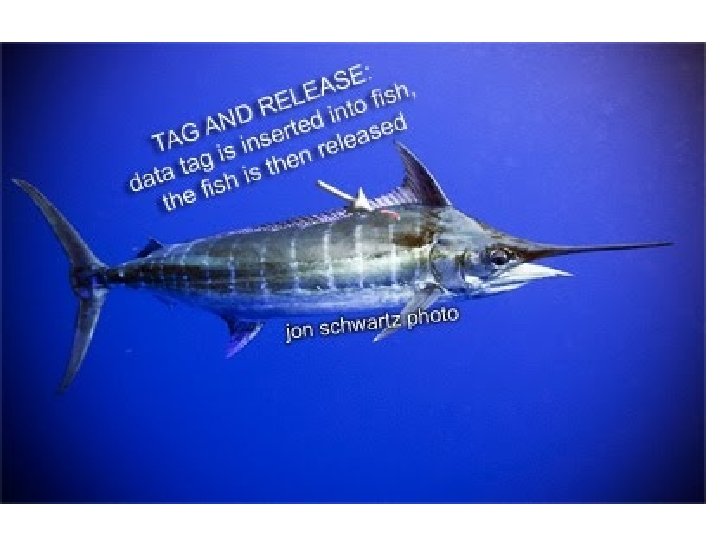
Estimating Population Size 1. Tag and Release or Mark and Recapture 2. Quadrant Sampling – Random (reduce bias) – Representative (large so the estimate is as accurate as possible) 10 quadrants = 10% of actual area 3. Census
Population Histograms - useful for studying human populations because they help us see trends in population data and they help us make predictions • How would you describe the following population growth? Young population with rapid growth Stable population with slow growth Declining population with negative growth
World Histograms • Check out the following link for histograms of countries around the world http: //www. worldlifeexpectancy. com/worldpopulation-pyramid