Population Science Scenarios Hua Min Ph D Fox


 - Rick Moser (NCI) •")
 - Rick Moser (NCI) • Goal: •")

")


 – Abdul Shaikh (DCCPS), Catherine")

, Catherine Loria (NHLBI) • The GEI Exposure Biology")


- Slides: 30
Population Science Scenarios Hua Min, Ph. D. Fox Chase Cancer Center November, 2008
Collaborators • • Richard Moser Abdul Shaikh Gene Kraus Mark Hornbrook Lewis Frey Eric Ross Paul Courtney Riki Ohira • Catherine Loria Frank Hartel Brian Davis Mary Cooper Dianne Reeves
Motivation • Understanding Requirements of Pop. Sci from VCDE Point of View • Best Support Pop. Sci from VCDE
Six Import Scenarios • Scenario 1: Grid-enabled Measures (GEM) - Rick Moser (NCI) • Scenario 2: The Genes, Environment and Health Initiative (GEI) – Abdul Shaikh (DCCPS), Catherine Loria (NHLBI) • Scenario 3: SEER-Medicare (HMO) – Gene Kraus, Mark Hornbrook, Yu-Ning Wong (FCCC) • Scenario 4 & 5: Pop. Sci enterprise use cases— Psychosocial influence on tumor progression – Paul Courtney (BAH) • Scenario 6: Utah Registry SEER project - Lewis Frey (U. of Utah)
Scenario 1: Grid-enabled Measures (Behavioral Research Project) - Rick Moser (NCI) • Goal: • The idea for the GEMS is to get researchers to use the exact same measure from different studies, thus allowing researchers to combine data across disparate sets. • The professional organizations (e. g. , Society of Behavioral Medicine; American Psychological Association) will be used to provide ‘gold standard’ measures for others to use with input from the community (i. e. , feedback received from those who use the database) to tell us if they agree or disagree.
Questions for XCWS • What are measures and survey? How are they related? • Does GEMS concentrate on measures, data collected by measures or both? • How atomic the data that have been downloaded? • Do they want to use the ca. Grid to aggregate and analyze the GEMS data? • Security issues? Copy rights?
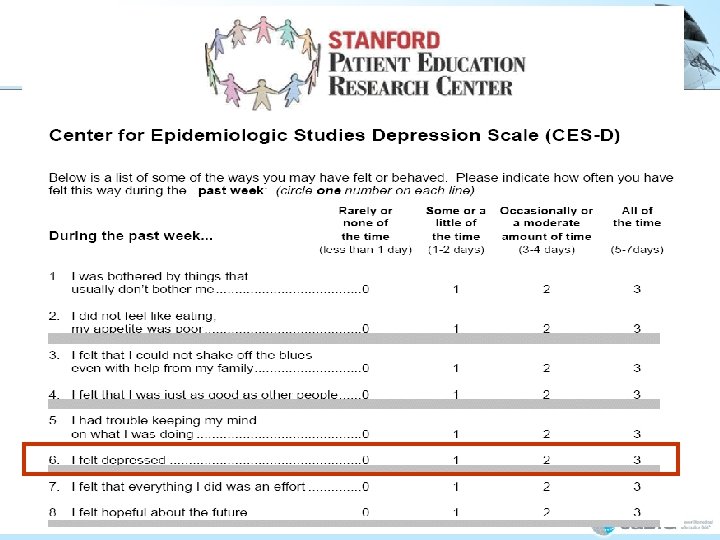
What are Measures? • Depression measures: • Center for Epidemiologic Studies Depression Scale (CES-D) • The Beck Depression Inventory (BDI) • Geriatric Depression Scale (GDS) • Hamilton Depression Rating Scale (HDRS) • Hospital Anxiety and Depression Scale (HAD) • The Zung Self-Rating Depression Scale (SRS) • Center for Epidemiologic Studies Depression Scale (CES-D) • 20 items • Score is the sum of the 20 items • A score of 16 or greater is considered depressed
What are Survey Instruments? • Survey Instrument may contain several measures or single item • Demographic • Medical History • How do you like to make decision? (Degner, 1 item) • How is your current health? (Ware, 7 items) • How have you been felt? (CES-D, 20 items) • … Instrument Measure Item
Scenario 1 Description • GEMS deals with measures not the survey instruments • Multiple people can post multiple different measures up on a web site. • Many other people can download these different measures. • People can use these measures on their own • People can develop new measures and upload to the web site • People can provide feedback of measures to public —that is, they could say good or bad things about it for others to see; this is akin to giving feedback on a site like Amazon. com about any product
Scenario 1 Description • Measures: • • The measures will reside on the contractor’s server that is maintaining the application. The measures themselves will be available to download unless it is a proprietary measure and then GEMS will provide a link to attain the measure. • Data: • • • The data that will eventually be shared (using the common measures) will reside on each user’s local server. The data that contain results from using the measures will be available through the grid. The grid will be used to aggregate the data The data that can be shared will ostensibly contain single items and/or multi-item measures. People may be interested in the individual items that make up a measure or final scores obtained from combining the items together
Scenario 2: The Genes, Environment and Health Initiative (GEI) – Abdul Shaikh (DCCPS), Catherine Loria (NHLBI) • Goal: The improved devices developed by the GEI can be used to collect data on the same individuals with genotyping data to evaluate whether associations between genetics and complex diseases are modified by environmental factors, such as diet, physical activity, and environmental toxins. • GEI has two programs: • GEI Exposure Biology Program • GEI Genetics program
Questions for the XCWS: • What are devices? • What are data?
Scenario 2: GEI– Abdul Shaikh (DCCPS), Catherine Loria (NHLBI) • The GEI Exposure Biology Program is focused on developing devices (environmental sensors) to more precisely measure physical activity and diet that can be used in large-scale studies. • motion or physiologic sensors, monitors, imaging methods, cellular telephone and wireless technologies, as well as bioinformatics tools and database solutions.
Scenario 2: What are GEI data? • Auto. Sense: • Wireless Skin Patch Sensors to detect blood alcohol concentration, ECG, Respiration Rate, Skin Conductance, Temperature, and Accelerometer • Sensors are attached to a wireless sensor computing platform with a wireless radio that can host a variety of sensors, collect data from these sensors, process them using customized algorithms, and transmit the processed information on secure wireless channels. • Sensors can be monitored remotely via the platform and software running on the entire system can be updated/replaced over the wireless channel.
Scenario 2: GEI • The GEI Genetics program is collecting genetics data, mainly from studies that have stored data on outcomes and environment • development of “fingerprints” (markers) of biological response that are indicative of activation of common pathogenic mechanisms such as epigenetic modifications and DNA damage • GWAS integrates two datasets together
Scenario 3: SEER-Medicare – Gene Kraus, Mark Hornbrook, Yu-Ning Wong • Goal: • Find the patterns of care for persons with cancer before a cancer diagnosis, over the period of initial diagnosis and treatment, and during long-term follow-up. • Examine the use of cancer tests and procedures and the costs of cancer treatment.
Questions for XCWS: • What are Patterns of Care? • What are Data Sources? • Does ca. SEER have this link?
What are Data Sources? • There are two datasets: SEER and Medicare. They could be linked. • The SEER/Medicare data sources are two large population-based sources about elderly persons with cancer • The Surveillance, Epidemiology and End Results (SEER) program: clinical, demographic and cause of death for persons with cancer • The Medicare (HMO): Medicare claims for covered health care services from the time of a person's Medicare eligibility until death • Individual identifier could be used to link SEER and Medicare together
Scenario 3 Description • To estimate the association between treatment (radiation therapy or radical prostatectomy) compare with observation and overall survival in men with low and intermediate risk prostate cancer • Data: SEER and Medicare databases (Two data services on Grid) • SEER: Tumor histology, size, grade (Tumor grade and stage) • Medicare: medical and surgical claims data (Treatment) • Survival: interval from the date of diagnosis (SEER) to the date of death (Medicare) • Yu-Ning Wong, et. al. , JAMA 2006 296(22): 2683 -2693
Scenario 3 Description • SEER Data and data standards: • SEER data are collected and stored separately by States. They exported and merged to create a master copy of data (usually takes 4 years). • Current standard: North American Association of Central Cancer Registries (NAACCR) • Some of NAACCR data is represented by Metadata in the ca. DSR • Medicare Data and data standards: • International Classification of Disease, Ninth Revision (ICD-9) and Healthcare Common Procedure Coding System
Scenario 4: Pop. Sci enterprise use cases— Psychosocial influence on tumor progression – Paul Courtney • • • Intro: Dr. Smith, a Population Scientist, hypothesizes that psychological stress influences tumor progression via biological correlates within the tumor microenvironment. Dr. Smith would like to submit an R 01 grant application, but needs some preliminary data to explore the hypothesis. Scenario: Dr. Smith uses data mining techniques to “crawl” through a series of databases on the Grid, and finds three that contain measures of stress, tumor characteristics and/or biological correlates. None of the databases contains all three types of variables. Dr. Smith identifies the variables of interest in the source datasets and exports an analysis dataset. Results suggest that psychological stress is related to cortisol and that cortisol levels are related to tumor progression. However, Dr. Smith is unable to test the direct relationship between psychological stress and tumor progression because there isn’t an existing dataset will all of the necessary measures. The results, however, are strong enough to submit a proposal to test the hypothesis. Conclusion: Based on the results of these preliminary explorations, Dr. Smith plans an R 01 grant to conduct a clinical study to test this hypothesis. The study will include measures of psychological stress, biological correlates, and tumor progression.
Scenario 4: Pop. Sci enterprise use cases— Psychosocial influence on tumor progression • Dr. Smith is unfamiliar with the best measures of psychological stress. Prior to submitting the grant, he/she refers to the behavioral measures database (GEMs), which contains information about various measures of stress and their psychometric properties. He/she uses the database to select the best measure of stress for this study. • A lot of stuff here • The grant is funded, the study protocol is approved and the study is completed. • The Statistician communicates the clinical significance of and evidence for prediction of tumor progression based on biomarker hormone mediation of psychological stress • Dr. Smith and statistician write a scientific paper reporting the results • De-identified data from the study are made available to other researchers via the ca. Grid.
Scenario 5: Pop. Sci enterprise use cases— Psychosocial influence on tumor progression • • • A suspicious lump is detected on Ms. Lang’s annual mammogram. Her PCP, Dr. Mackey, sends her to a radiologist at the Central Medical Center for a more thorough diagnostic imaging The radiologist’s report indicates a mass in Ms. Lang’s left breast and Ms. Lang is referred to a breast surgeon. Prior to surgery Ms. Lang completes questionnaires on family history, health status, comorbidities, and various functional status measures. She also has blood drawn for genetic analysis and biomarkers. Ms. Lang has biopsy taken by surgeon and goes to the Blood Lab for blood draw Biopsy is sent to Pathologist, who takes part of the sample and sends it to genomic lab service Lab service runs labs and sends the results back to the pathologist (FSH, IHC, Gx. P, SNP, et al. ) Pathologist collates result from labs and his/her analysis of the tissue and send the pathology report back to the oncologist. Based on Ms. Lang’s tumor and other reports, she has several treatment options available to her.
Scenario 5: Pop. Sci enterprise use cases— Psychosocial influence on tumor progression • • • Based on integration of population data from cancer registries and EHR’s, the oncologist knows that in addition to survival, quality of life during treatment as well as late effects are correlated with patient genetic predisposition, specific chemotherapeutic agents and the patient support system. The oncologist uses the reports to discuss treatment options with Ms. Lang using a shared decision making model, which includes discussion of the following factors: • Family History and Genetics • Age, anthropometrics and lifestyle history – BMI, smoking history, exercise & physical fitness • Presence or absence of supportive psycho-social factors – family, community, economics (job, health insurance, etc. ), spiritual support • Population data regarding survival after different surgical, chemo- and radiotherapies • Known late effects of different treatment options Data related to Ms. Lang’s tumor characteristics, treatment, medical information, psychosocial status and lifestyle factors are entered into a database that can be used for research purposes and long-term follow-up.
Scenario 6: Utah Registry SEER Project— Lewis Frey • Goal: • Promote excellent clinical care of patients with cancer • Establish best clinical practice standards for patient with cancer • Coordinate clinical trials across institutions • Develop and implement clinical practice guidelines and report outcomes • Develop infrastructure for outcomes research personalized patient data https: //cabig. nci. nih. gov/workspaces/ICR/popscisig/workspaces/ICR/ popscisig/Pop. Sci_F 2 F 08
Scenario 6: Questions for the XCWS • Where is data stored? Data stored in hospitals separately? • List a sample question that need data from different sources. • Do they use the Grid to aggregate and analyze the data?
Scenario 6: Data Sources – Utah Registry SEER project • Utah Multi-Institution Collaboration • Utah Cancer Registry • Huntsman Cancer Institute (HCI) • Intermountain Healthcare (IHC) • 20 Hospitals, more than 100 clinics • Located across state of Utah • Utah Cancer Specialists • Distributed data repository • The repository will be used to examine details of clinical care for patients with colorectal cancer across Utah
Scenario 6: Data Sources and Standard – Utah Registry SEER project • Distributed Data Repository • • • Physical data resides at institutions Data stored in same structure Same data entry application Reports created that can retrieve data from databases Aggregate and non-identifiable patient data combined • Data Standard: • North American Association of Central Cancer Registries (NAACCR) • Some of NAACCR data is represented by Metadata in the ca. DSR • ca. BIG™ infrastructure
Scenario 6: Utah Registry SEER project • Is race associated with stage at diagnosis? • Utah Cancer Registry Colorectal Study Database (Table Subset)