Population Sampling and Standard Deviation Population Steps to


- Slides: 15
Population, Sampling, and Standard Deviation
Population •
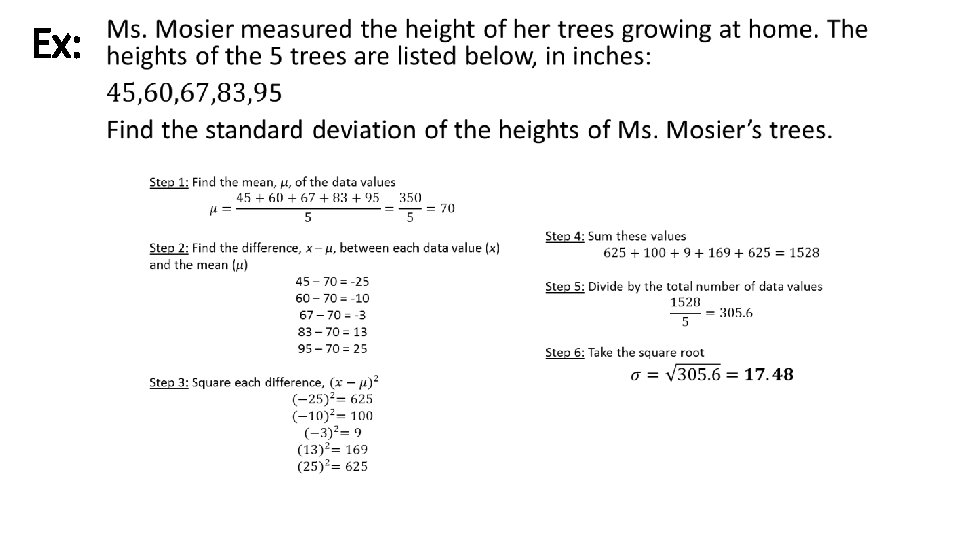
Steps to Calculate the Population Standard Deviation: •
On Your Own: The table displays the number of hurricanes in the Atlantic Ocean from 1992 to 1997. What are the mean and standard deviation? Answer: Mean = μ = 35/6 = 5. 83 Standard deviation = σ = 3. 34
Sampling • A sample is part of a population. • If you determine a sample carefully, the statistics for the sample can be used to make general conclusions about the larger population. • Suppose you want to know what percent of high school students in the US use Twitter everyday. It likely would be impossible to get that answer from every student. So instead you select a sample of the students (like at South Miami High) to estimate the percentage who use Twitter everyday. • It’s always better though to obtain a random sample. In a random sample, all members of the population are equally likely to be chosen. Therefore, using only South Miami students is not going to give you an accurate portrayal of students using Twitter. • A sample has a bias when a part of a population is overrepresented or underrepresented. A bias is a systematic error introduced by the sampling method. • Ex: If I want to conduct a survey on how many hours a high school student studies a day, and I only administer the survey to AP students, it’s not going to give an accurate portrayal of all the students in a high school.
Sample Standard Deviation •
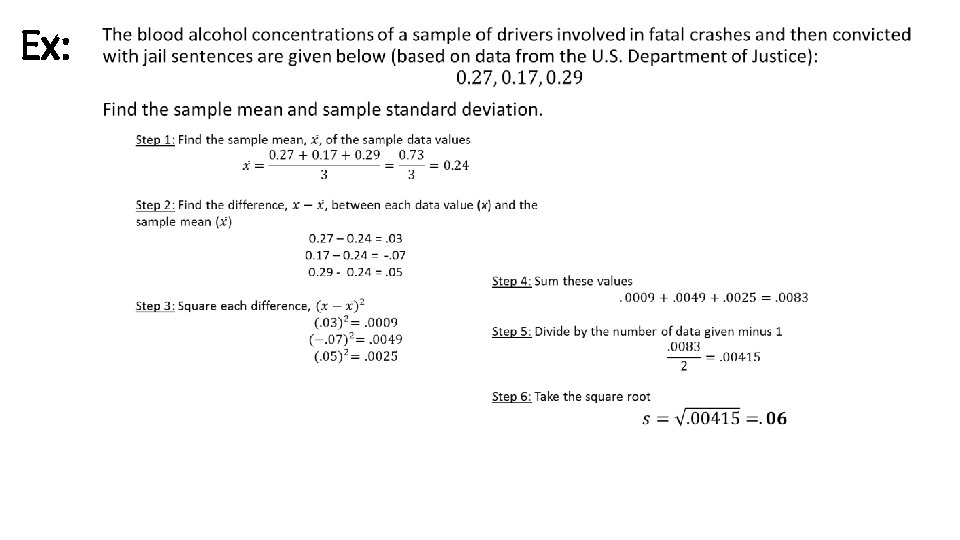
Steps to Calculate the Sample Standard Deviation: •
Interpreting and Understanding Standard Deviation • As stated earlier, standard deviation measures the variation among values. Values close together will yield a small standard deviation, whereas values spread farther apart will yield a larger standard deviation. • Many common statistics (such as human height, weight, or blood pressure) gathered from samples in the natural world tend to have a normal distribution about their mean. A normal distribution has a symmetric bell shape centered on the mean. • We will develop a sense for values of standard deviations using the Empirical Rule. This only works for normal distributions!!!
Interactive • http: //www. shodor. org/interactivate/activities/Normal. Distribution/ • Questions to ask: • What happens to the curve as the standard deviation gets larger? • What happens to the data as the number of trials increases? • What does this remind you of that we discussed?
Ex: IQ scores of normal adults on the Weschler test have a bell-shaped distribution with a mean of 100 and a standard deviation of 15. What percentage of adults have IQ scores between 55 and 145? mean Let’s first draw the distribution. Since the mean is 100, we put 100 in the center. With a standard deviation of 15, we know that between 85 and 115, we are within 1 standard deviation from the mean. Similarly, we know that between 70 and 130, we are within 2 standard deviations from the mean. 1 s. d Finally, between 55 and 145, we are within 3 standard deviations from the mean. Now to answer the question. If we want to know the percentage of adults who have IQ scores between 55 and 145, we need to remember the Empirical Rule in that 99. 7% of data fall within 3 standard deviations from the mean. 2 s. d’s Therefore, the answer is 99. 7% 3 s. d’s
Ex: The table displays the number of U. S. hurricane strikes by decade from the years 1851 to 2000. Let’s say we’re given that the mean is 17. 6 and the standard deviation is 3. 5. How many standard deviations from the mean do all the values fall?
Ex:
On Your Own: For an English class, the average score on a research project was 82 and the standard deviation of the normally distributed scores was 5. Sketch a normal curve showing the project scores and three standard deviations from the mean.