Population Pyramids What do they show Population Pyramid


 Rapid c) Moderate d) Shrinking")


 Rapid c) Moderate d) Shrinking")


 Rapid c) Moderate d) Shrinking")


 Rapid c) Moderate d) Shrinking")


 b)")

 b)")
 Soviet Union, 1989 Affects both men and women")
 b)")

 b)")

 b)")


 + (% pop. 65 & up) %")


- Slides: 68
Population Pyramids What do they show?
Population Pyramid l Shows age structure l Shows sex structure Of a place
What type of growth does this show? Slow b) Rapid c) Moderate d) Shrinking a)
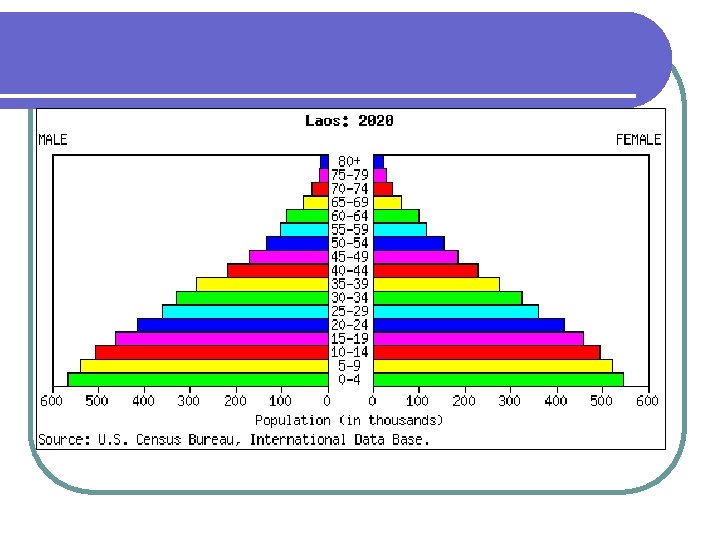
Rapid l Triangular shaped
Rapid l Triangular shaped l Wide base
Rapid l l Triangular shaped Wide base Example: l Laos l Angola l LDCs
Rapid l l Triangular shaped Wide base Example: l Laos l Angola What do these places have in common? l LDC/Developing Nations (3 rd world)
What type of growth does this show? Slow b) Rapid c) Moderate d) Shrinking a)
Moderate l Extended triangle l Base isn’t as wide
Moderate l l Extended triangle Base isn’t as wide Example: l Mexico l Brazil
Moderate Extended triangle l Base isn’t as wide Example: l Mexico l Brazil l Mexico City What do these places have in common l Sao Paulo, Brazil More developed than LDCs, not as developed as others
What type of growth does this show? Slow b) Rapid c) Moderate d) Shrinking a)
Slow l l Column shaped Population is neither increasing or decreasing Example: l United States
Slow Column shaped l Population is neither increasing or decreasing Example: l United States l What is the U. S. considered economically? l MDC
What type of growth does this show? Slow b) Rapid c) Moderate d) Shrinking a)
Shrinking l Top is wider than the base
Shrinking l Top is wider than the base Population is aging l People having less kids l
Shrinking l l l Top is wider than the base Population is aging People having less kids Example: l Italy l Latvia
Shrinking Top is wider than the base l Population is aging l People having less kids Example: l Italy l Latvia l What do these countries have in common? l Europe l MDC
More advanced
What can you tell by this place based on the population pyramid? a) b) c) d) e) College town External War Internal War, famine, epidemic Retirement community Immigrant workers
College town • • What populations are highest? Because college students are usually between the ages of 17 -23
What can you tell by this place based on the population pyramid? a) b) c) d) Soviet Union, 1989 e) College town External War Internal War, famine, epidemic Retirement community Immigrant workers
Internal War, famine, epidemic a) Soviet Union, 1989 Affects both men and women
What can you tell by this place based on the population pyramid? a) b) c) d) e) College town External War Internal War, famine, epidemic Retirement community Immigrant workers
Retirement community • • Lots of old people Very few young people
What can you tell by this place based on the population pyramid? a) b) c) d) e) College town External War Internal War, famine, epidemic Retirement community Immigrant workers
Immigrant workers • • • Most immigrant workers are men What type of work? Construction What type of immigrant work do females do? House work
What can you tell by this place based on the population pyramid? a) b) c) d) e) College town External War Internal War, famine, epidemic Retirement community Immigrant workers
External War • • Less men than women Men usually fight in wars
Age-Dependency Ratio
Age-Dependency Ratio l Working population must support the non -working population. l What ages are considered non-working? l 0 -14, 65 & up
Age-Dependency Ratio Formula (% pop. 0 -14) + (% pop. 65 & up) % pop between 15 -64 X 100
Age-Dependency Ratio Formula l The answer tells us how many dependents there are per 100 people working l For example:
Age-Dependency Ratio Formula Example: Mali - Africa l l l l Population <15: 48 Population 65+: 3 Population 15 -64: 49 48 + 3 = 51 51/49 = 1. 04 x 100 = 104 This means that for every 100 people that work, they have to support 104 people. That’s bad!!!
Disadvantages l Wide base means there a lot of kids l l Young kids can’t support themselves Large burden on society, especially their mothers l l Have to support large families rather than working LDC
Age-Dependency Ratio Formula Example: Germany - Europe l l l l Population <15: 14 Population 65+: 20 Population 15 -64: 66 14 + 20 = 34 34/66 = 5. 15 x 100 = 51. 5 This means that for every 100 people that work, they have to support 52 people. l That’s better, but look how many older people there are than younger people.
Disadvantages What are the two largest percentages of age ranges? l What problem do you think Germany will have in 15 -20 years? l People will start to retire, working population will have a hard time supporting them. l
Disadvantages How can Germany support these people even though they aren’t having many children? l Immigration! l
The Demographic Transition Model
The Demographic Transition Model
The Demographic Transition Model
Stage 1 – Low Growth l CBR and CDR are high l What does this mean for population growth? l Low
Stage 1 - Low Growth l Why are the birth rates and death rates so high?
Sweden’s DTM
CDR - Poor Medicine/Doctors Before modern medicine l Did not sanitize l l l Dr. Nick Did not know about germs No antibiotics
CDR - Infant Mortality Poor medicine/doctors l People had to have more kids because chances were that at least ½ would die l
CBR - Infant Mortality l Most people lived on farms l l Needed kids to work on the farm People had to have more kids because chances were that at least ½ would die
Stage 2 – High Growth Birth Rate still high l Death rate falling l l What dos this mean for population growth? l Rising
Stage 2 – High Growth l Why is the birth rate still high but the death rate declining?
High CBR – Farms and rural areas l Needed free help to work on the farm
High CBR – Little or No Birth Control
Low CDR - Better Medicine/Doctors More sanitary medical facilities l Better trained doctors l Antibiotics l
Population Pyramid for Stage 2 Pyramids for stage two look like triangles l High birth rates l Third World Countries (LDCs) l
Stage 3 – Moderate Growth Birth Rate falling l Death rate falling l l What dos this mean for population growth? l Still rising
Declining CBR - Industrialization l l l Industrialization of economy Less farmers People moving to the city for jobs Less room Smaller families
Declining CBR - Industrialization People moving to the city for jobs l Less room l Smaller families l
Declining CBR – Women’s Place in Society Women have more rights l Better education l Stay in school longer l Have careers l
Population Pyramid for Stage 3 Pyramids for stage three aren’t as wide at the bottom l People living longer l Developing Countries l
Stage 4 – Low Growth Birth Rate steadying l Death rate steadying l l What dos this mean for population growth? l Steadying
Low, Steady CBR – Developed Countries are developed. l People have less kids: l l Women’s rights l l See stage three Kids are expensive
Population Pyramid for Stage 4 Pyramids for stage four are bell shaped l People living longer l Developed Countries l
A th 5 Stage? Most DTMs you will see only have 4 stages. Some demographers believe there is or will be a 5 th.
Stage 5 – Negative Growth Birth Rate declining l Death rate steady l l What dos this mean for population growth? l Declining
Steady CDR l Medicine hasn’t advanced enough since stage 4 to make a difference
Declining CBR l Aging population l People having even less children l European countries rewarding people for having babies.
Population Pyramid for Stage 5 Pyramids for stage five are diamond or upside-down triangular shaped l People having less children l Death rate higher than birth rate l Mostly European Countries l