Population Pyramids Population Pyramid or AgeSex Ratio 1931


- Slides: 40
Population Pyramids
Population Pyramid or Age-Sex Ratio
1931 -1935
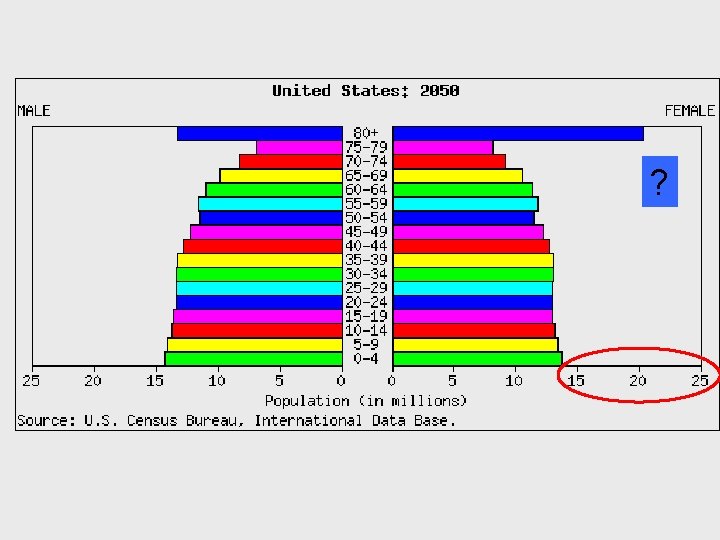
1946 -1950 Echo Boom
1946 -1950 Echo Boom
1. The baby boom a. occurred in the years immediately following World War I b. was a result of free love during the 1960’s c. was fostered by economic prosperity and relative peace d. was limited to California and the West
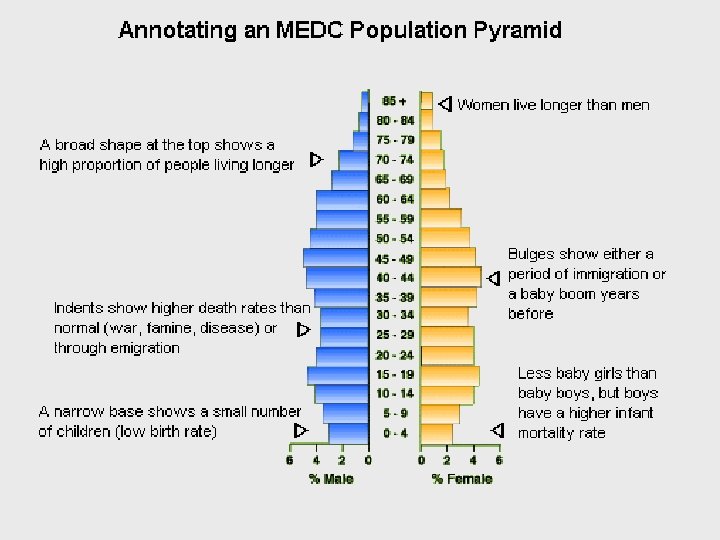
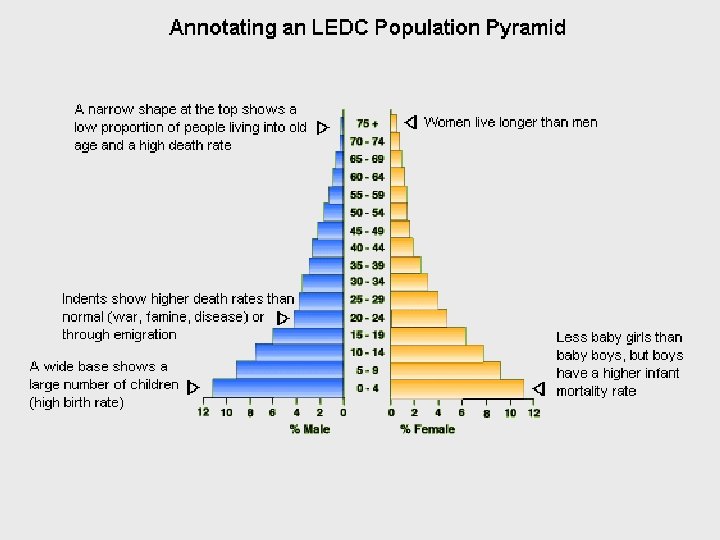
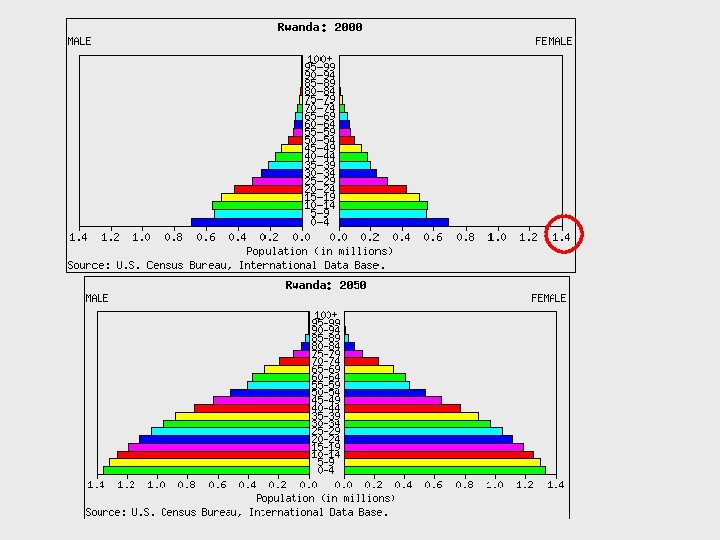
Typical pyramids
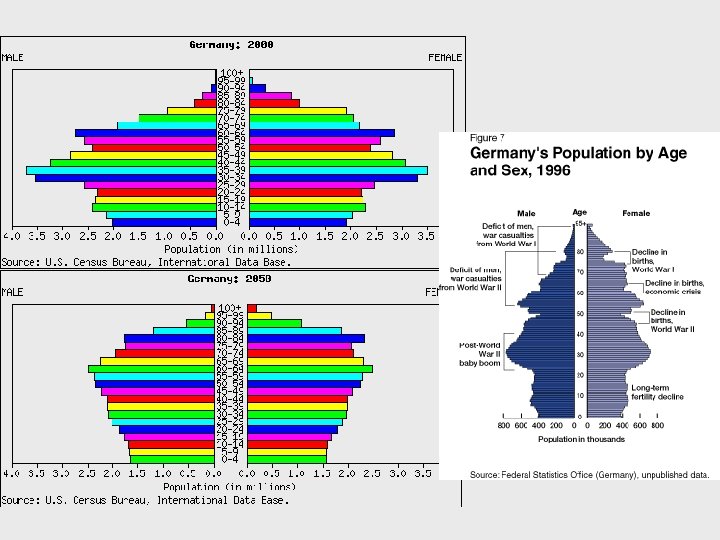
Indicates: • Women live longer A E • Lower CBR • High Life Expectancy • Disease, plague or gender specific deaths • A baby boom C B D http: //geographyfieldwork. com/Population. Structure. htm
http: //ecp 3113 -01. fa 01. fsu. edu/lively_introduction/fig 7. gif
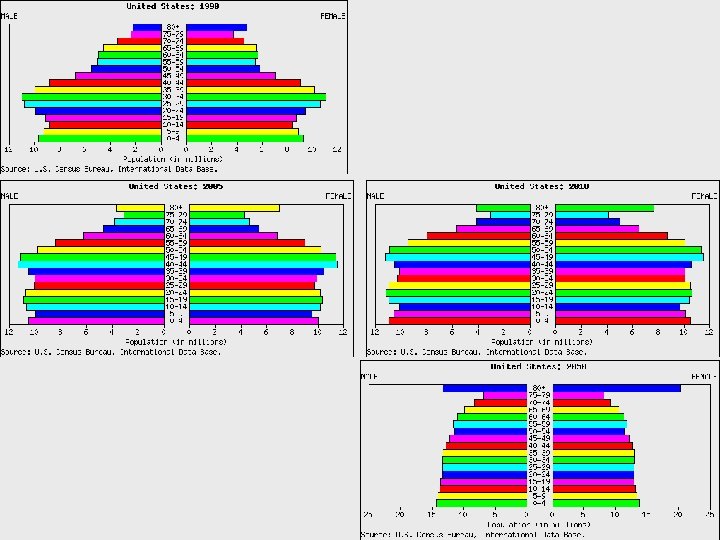
A C B D Which population pyramid is from the least developed country?
A C B D Which population pyramid is from the most developed country?
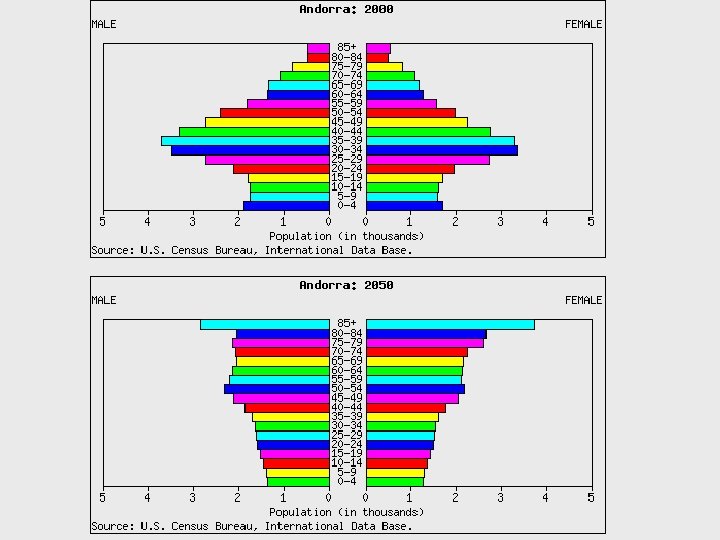
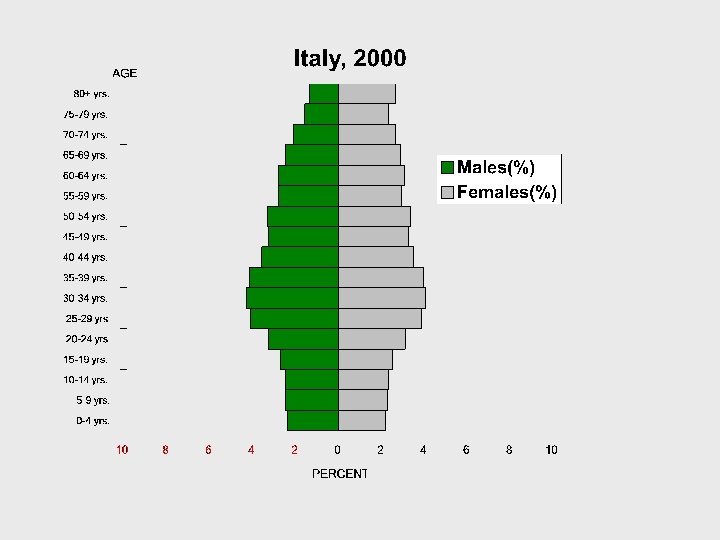
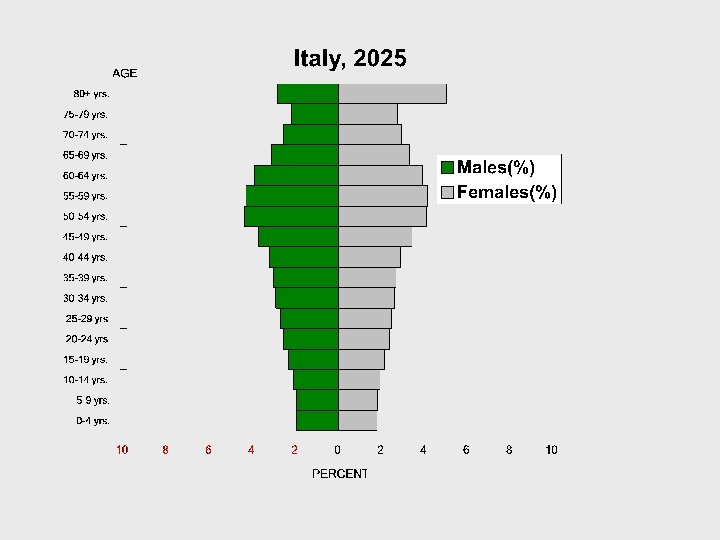
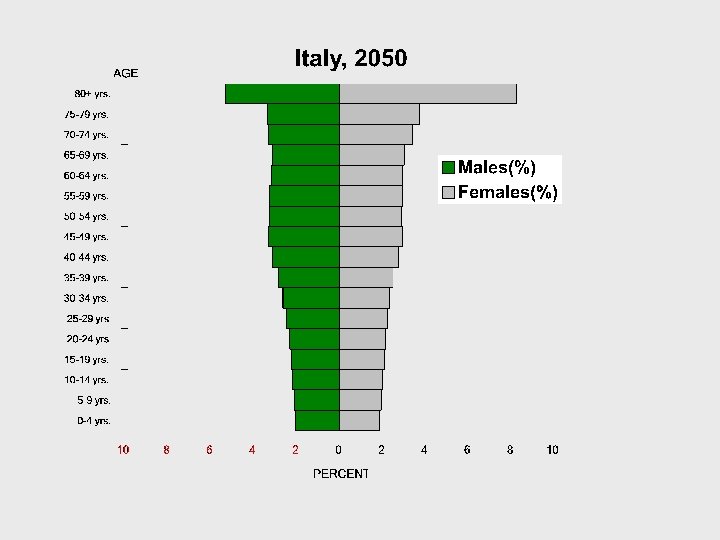
Analysis of Italy’s Population Pyramid • • 1. Decline in Birth Rate 2. Baby Boom 3. Fewer men due to World War I and II 4. More women due to: a. longer life expectancy and b. World Wars (I and II) • 5. More 75 -79 yrs than 0 -4 yrs. Signs of a future worker shortage and an overall declining population.
Aging population… …declining birth rate
Mammoni: “Mama’s Boy” http: //marketplace. publicradio. org/display/web/2007/11/22/why_italian_men_wont_leave_the_nest/#
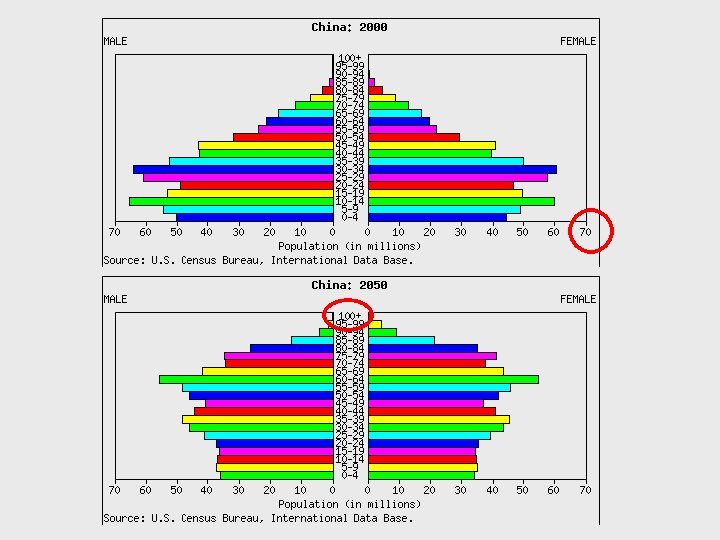
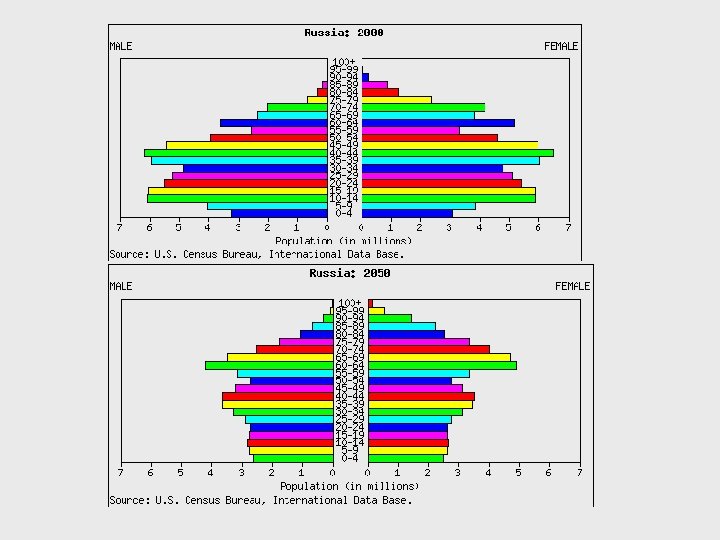
How is this population pyramid different from Italy’s?
http: //www. townsendchamber. org
• http: //bcs. wiley. com/hebcs/Books? action=resource&bcs. Id=3206& item. Id=0471701211&resource. Id=8133
Typical pyramids 2. LDC? 3. High CBR? 4. High Life Expectancy? 5. High Population Growth? 6. Stage 4/5?
A B C 7. Stage 1? D 2? 3? 4?
8. A population pyramid with a wide base and narrow top is indicative of a. developed countries. b. b. countries in Stage IV of the demographic transition. c. developing countries. d. low infant mortality. 9. A developed country that has reached a stage where the population is most stable will develop a population pyramid that is _____. a. bell shaped b. pear shaped c. rectangular shaped d. cone shaped
10. The country with the narrowest population pyramid is [hint: You probably will not know what that exact country’s population pyramid looks like, but stop and think about. Why were these countries chosen? What do they represent? ] a. Niger b. Chile c. Denmark d. United States
11. What significant population problem does the United States, as well as other MDCs, facing? a. high infant mortality b. high CDR c. high CBR d. an aging population e. an out of balance sex ratio 12. The population pyramid of Naples, Florida is “upside down, ” because the city has a large percentage of a. females b. infants c. elderly people d. young people
Changes in Size of Household in China http: //www. npfpc. gov. cn/en/detail. aspx? articleid=090430103634500835 http: //www. ined. fr/en/everything_about_population/graph_month/fertility_mortality_africa/