Population Pyramids Global Geography 12 Population Pyramids n

Population Pyramids Global Geography 12

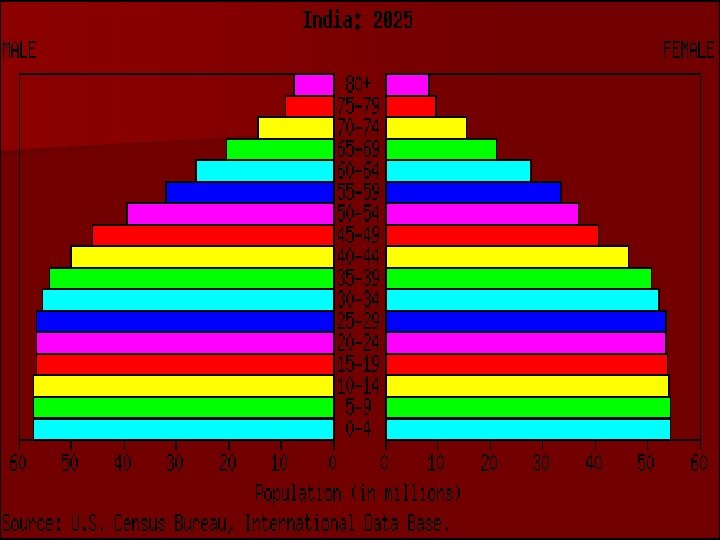
Population Pyramids n A graph that shows the age-sex composition of a population.

Cohorts A specific portion of the population that is combined together in an age group for the purposes of simplifying a population pyramid. Five-year cohorts are commonly used in population pyramids.
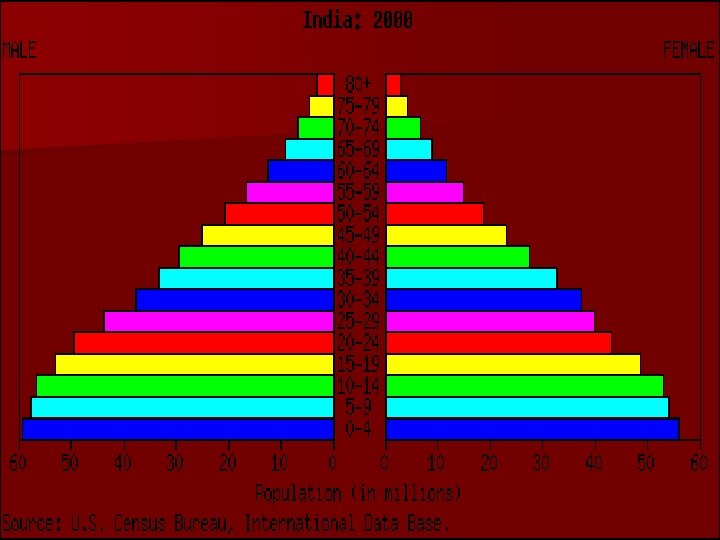
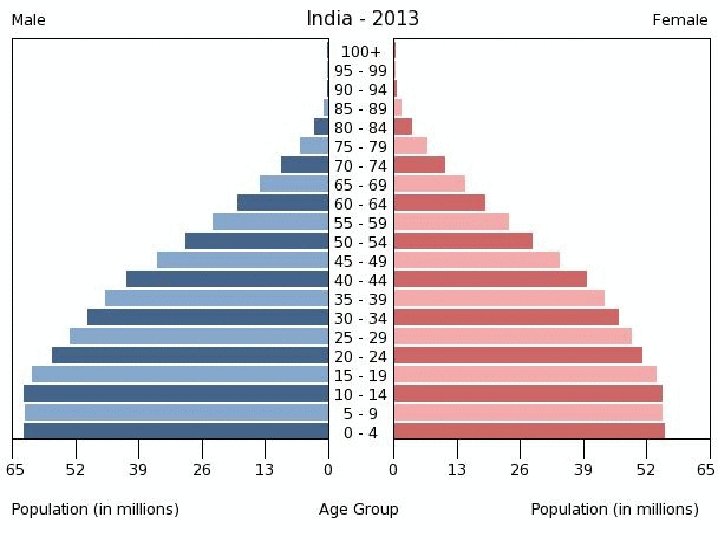
 Expansive: An age-sex structure with a wide base")
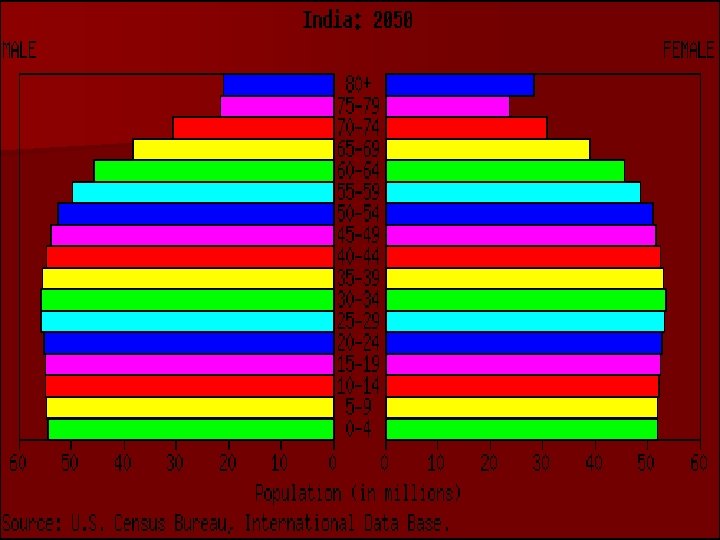
2 Types of Population Pyramids 1) Expansive: An age-sex structure with a wide base and narrower top. This indicates a high birth rate and an expanding population. 2) Stationary: An age-sex structure that indicates no or very little population growth. The pyramid is characterized by relatively straight sides.

What can we learn from Population Pyramids? n Economic Dependants n Baby Booms n Population Growth or Decline n Gender Imbalance

What happens next?
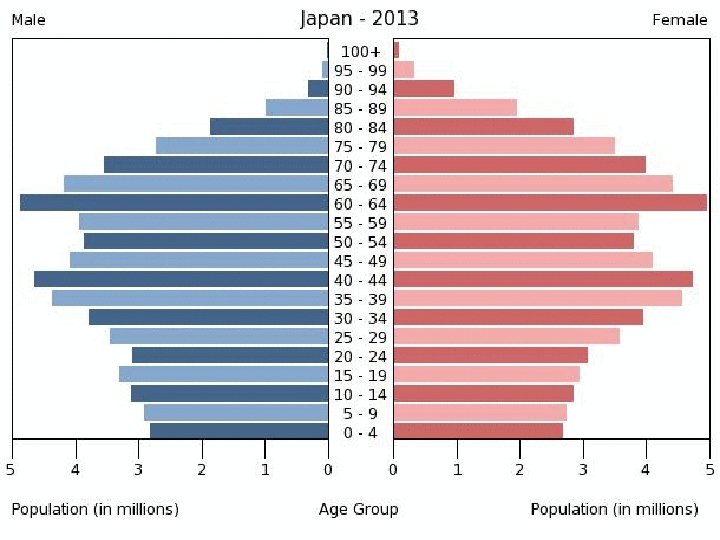
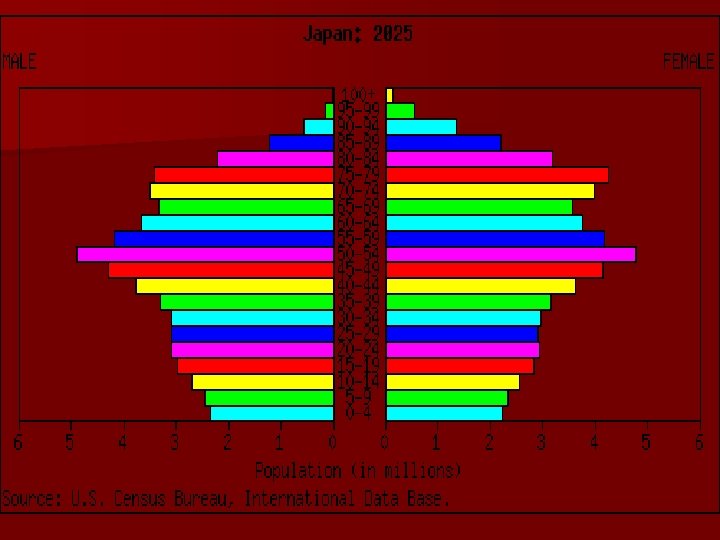

What is going to happen to Japan’s population in the future?

Demographic Transition Model

Demographic Transition Model n The DTM describes a sequence of changes in the relationships between births and death rates. n It suggests that the population growth rates for all countries can be divided into 5 stages.

Stage 1 – High Stationary n Birth Rate – Very High n Death Rate – Very High n Natural Increase – Population is steady n Example: No countries are currently in this stage. Isolated Brazilian tribes are often used an example.


Stage 2 – Early Expanding n Birth Rate – Very High n Death Rate – Falling Rapidly n Natural Increase – Very Rapid Increase n Example: Egypt, Kenya, India
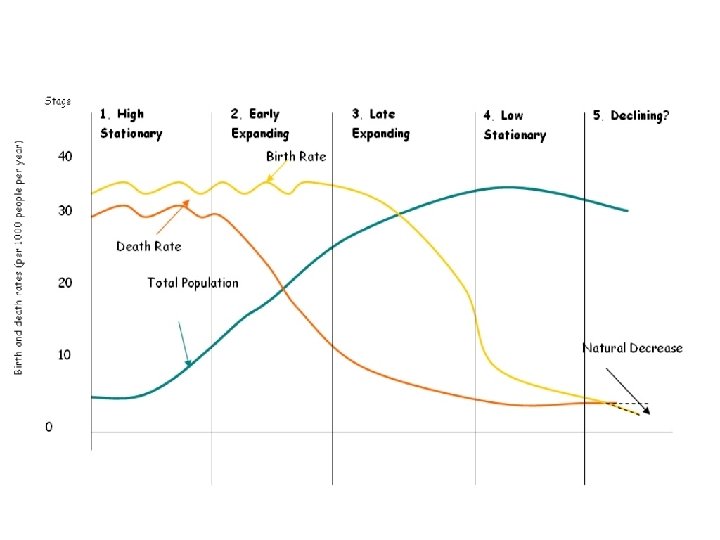

Stage 3 – Late Expanding n Birth Rate – Falling rapidly n Death Rate – Falling more slowly n Natural Increase – Rapid increase n Example: Brazil


Stage 4 – Low Stationary n Birth Rate: Falling more slowly n Death Rate: Slight fall n Natural Increase: Very slow increase n Example: USA, Japan, France, UK


Stage 5 - Declining n Birth Rate: Slight fall n Death Rate: Stable n Natural Increase: Gentle decrease n Example: Germany (in the future)

- Slides: 25