Population Pyramids Demographic Transition Model High Birth Rate

Population Pyramids

Demographic Transition Model

High Birth Rate Falling Birth Rate Low Birth Rate Falling Birth Rate High Death Rate Falling Death Rate Low – Slightly increasing Death Rate Basic technology Growth in technology Improving technology Established technology New and emerging technology Low natural increase Rising natural increase Rapid Natural Low natural increase Low – negative natural increase Isolated Indigenous communities The Gambia Brazil Japan USA
 Australia has a low birth rate,")
Fill in the gaps in the following. a) Australia has a low birth rate, low death rate, low natural increase rate and established technology. This means it is at Stage _________ on the model. b) In 1900 most countries in South East Asia were at Stage 1. This meant they had _________ birth rates, _________ death rates, _________ natural increase rates and _________ technology. c) By 2010, Japan was at Stage 5. This meant it had a _________ birth rate, a _________ death rate, a _________ natural increase rate, and _________ technology.
 a population")
Write down the stage to which the following most likely belong. a) a population explosion because of sudden improvement in health _____ b) high urbanisation, not a lot of new babies being born, lots of new technology and education, with small families _____ c) rural society of poor farmers and large families _____

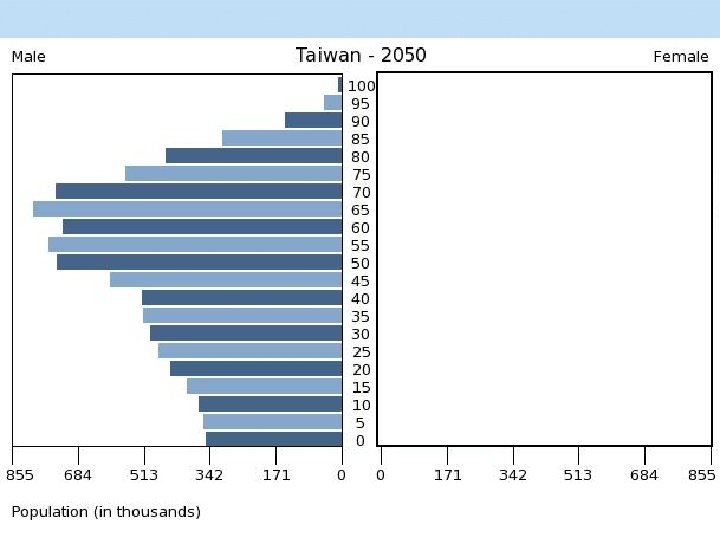
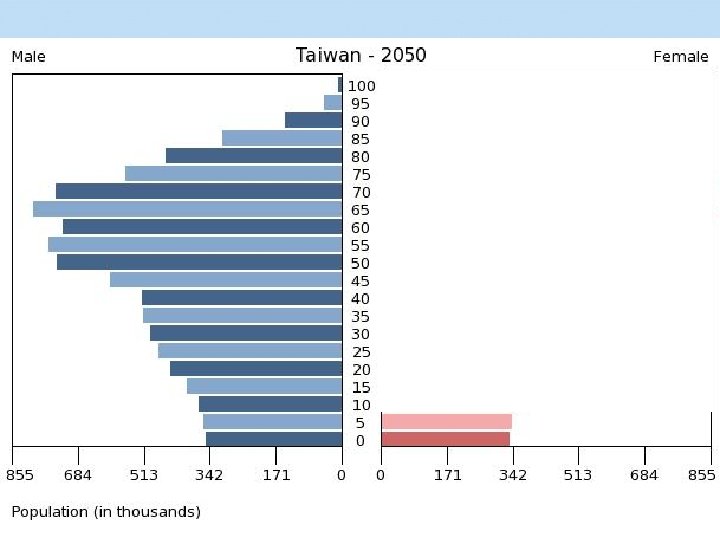
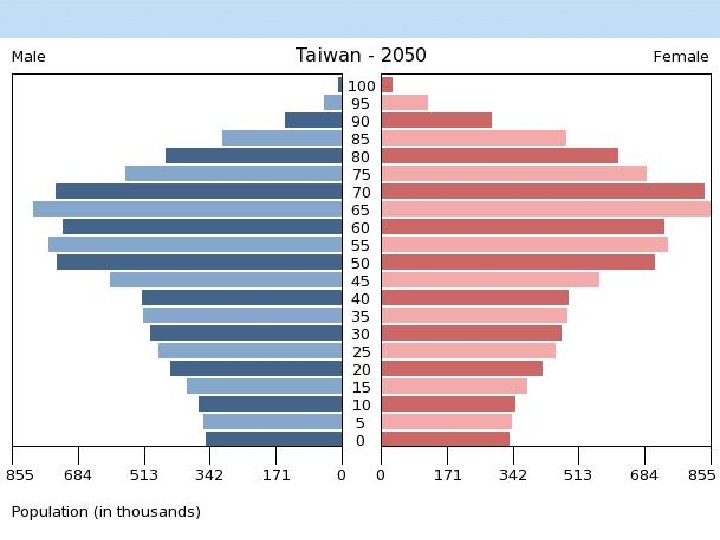
Population Pyramids A pyramid-shaped graph illustrating the age distribution of a population: the youngest are represented by a rectangle at the base, the oldest by one at the top

Youthful Dependents

Aged Dependents

Working/ Economically Active Population

Dependency Ratio Aged Dependents Working/ Economically Active Population Youthful Dependents How many working people are supporting how many dependents

Pyramid Growing Box Stable Cup/Coffin Declining

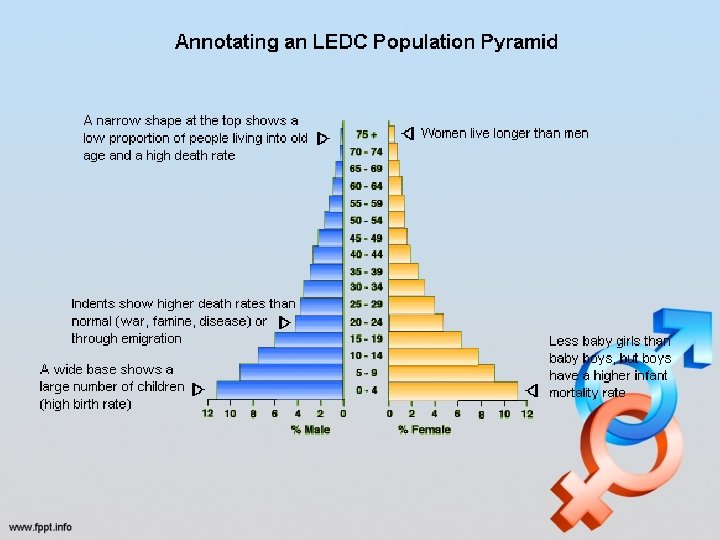
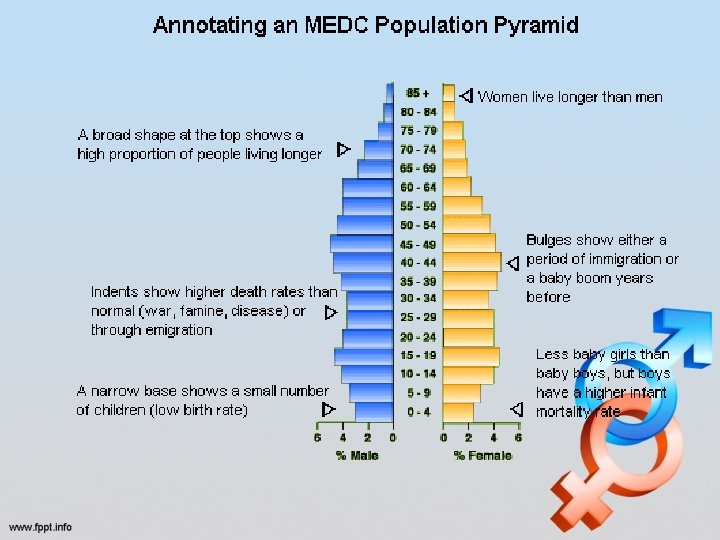
Key things to know • The shape can tell us information about birth and death rates as well as life expectancy. • A population pyramid tells us how many dependants there are. There are two groups of dependants; young dependants (aged below 15) and elderly dependants (aged over 65). • Dependants rely upon the economically active for economic support. • Many LEDCs have a high number of young dependants, whilst many MEDCs have a growing number of elderly dependants.

Change over time • Over time, as a country develops, the shape changes from young to intermediate to old • If a country has a lot of young people it will become larger more quickly • Improvements in health will straighten the sides and add height • Conflict will cause an imbalanced pyramid with more women than men • Baby Booms will cause a sudden increase in birth rates • Disease can cause a sudden drop in different age groups • Migration will cause a bulge from 20 s to 40 s
 the total number of children aged 0– 4 is b) the number of")
a) the total number of children aged 0– 4 is b) the number of males aged 35– 39 is c) the number of females aged 65– 69 is d) Which age group has the largest number of people?

Activities • Complete Population Pyramid Sheet • Population Pyramids Explained • Complete Brazil Sheet
- Slides: 22