Population Pyramids and Demographic Transition Model 1 Population


 The three key components to pay attention to in")


 Stage A Both high birth rates and death rates")

 Stage B Birth rates remain high, but death rates")

 Stage C Birth rates now fall rapidly while death")

 Stage D Both birth rates and death rates remain")

 Stage E? A stage 5 was not originally thought")
 countries’ populations will")


- Slides: 20
Population Pyramids and Demographic Transition Model 1. Population changes over time and space. 2. Population change can be shown on two models.
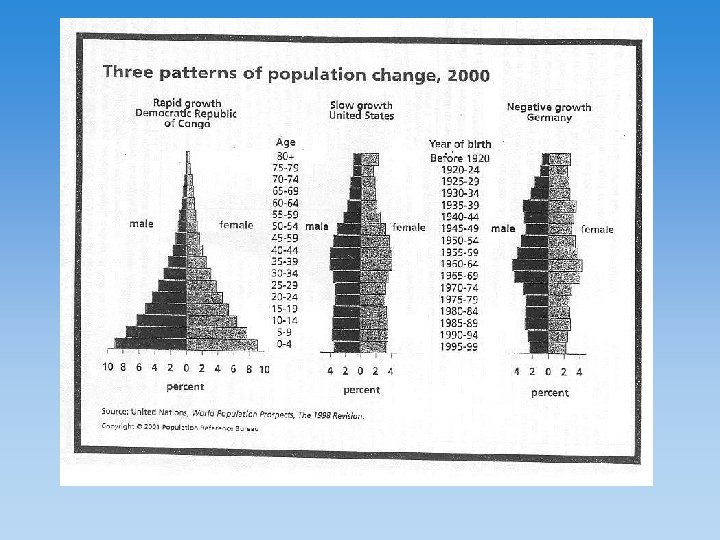
POPULATION STRUCTURE The population pyramid displays the age and sex structure of a country or given area OLD DEPENDANTS Population in Five Year Age bands ECONOMICALLY ACTIVE YOUNG DEPENDANTS MALES To the left Usually, but not always, in % to make for easier comparisons between countries FEMALES To the right
What Population Pyramids Show Us Economically More Developed Country Economically Less Developed Country KEY slope of pyramid indicate the death rate width of the base is related to birth rate/fertility rate proportions of men and women can suggest male or female migrations height of graph can indicate life expectancy (ignore the very thin end of the wedge as occurs on graph B as these people are a definite minority) "kinks" indicate dramatic reductions in birth rate or increases in death rate in the past area of graph indicates total population - compare areas of different population age groups or different sex on one graph The overall shape of the population pyramid can indicate whether it is an Economically More Developed Country or Economically Less Developed Country
The DTM (Demographic Transition Model) The three key components to pay attention to in the Demographic Transition Model are: 1. Birth Rates 2. Death Rates 3. Total Population The vertical on the graph is rate per 1000 and the horizontal is time.
Demographic Transition • • Demographers call the sequence of stages in population growth the demographic transition model. The FOUR stages are: 1. Low-Growth Stage - HIGH birth rate and HIGH death rate lead to a population that varies over time, with little long-term population growth. 2. High-Growth Stage - HIGH birth rate and DECLINING death rate lead to sustained and significant population increase. 3. Moderate-Growth Rate – DECLINING birth rate combined with already-low death rate lead to continuing population growth. 4. Low-Growth or Stationary Stage - LOW birth rate and LOW death rate lead to a very LOW rate of growth.
Demographic Transition • The transition in the demographic transition occurs in stages 2 and 3, when death rates decline and then birth rates decline. • When the death rate and birth rate fall, the country transitions from a high growth rate to a low or sustained growth rate.
The DTM (Demographic Transition Model) Stage A Both high birth rates and death rates fluctuate in the first stage of the population model giving a small population growth (shown by the small total population graph).
Stage 1: Low Growth • The low population growth rate of stage 1 is marked by much human suffering. With incredibly high birth rates and equally high death rates, population increases slowly. • Epidemics and plagues keep the death rates high among all sectors of the population. • During the 1300 s, the Black Death (bubonic plague) hit Europe in waves beginning in Crimea on the Black Sea, diffusing through trade to Sicily and other Mediterranean islands, and moving through contagious diffusion and the travel of rats (who hosted the vector, the flea, that spread the plague) north from the Mediterranean. • Famines also limited population growth. Records in India and China during the 18 th centuries document millions of people perishing.
The DTM (Demographic Transition Model) Stage B Birth rates remain high, but death rates fall rapidly causing a high population growth (as shown by the total population graph).
Stage 2: High Growth • 1700 s = beginning of the Industrial Revolution. Sanitation facilities made towns and cities safer from epidemics, and modern medical practices diffused. • Disease prevention through vaccination introduced a new era in public health. • Also marks the Second Agricultural Revolution – more efficient farming methods decreased the number of people needed in farming and the food supply increased, thereby supporting a higher population. • 1750 = DR in Europe of 35/1000, 1850 = 16/1000 • When European and North American countries moved into stage 2 in the 1800 s, their populations took off, inflating worldwide population. • European colonization of Africa and Asia in late 1800 s brought those areas into stage 2. New alarms and cautions of worldwide population rang.
The DTM (Demographic Transition Model) Stage C Birth rates now fall rapidly while death rates continue to fall. The total population begins to peak and the population increase slows to a constant.
Stage 3: Moderate Growth • Europe and North America entered stage 3 in the first half of the 1900 s. • Stage 3 is marked by continuing , but slower, decline in death rates coupled with a significant decline in birth rates. The result is continued growth in the population but at a much slower rate. • In the second half of the 1900 s, many countries in Latin America and Asia entered stage 3, which has helped slow the global population growth rate. • Why do birth rates decline, allowing a country to move into stage 3? – Low birth rates with greater urbanization, wealth, and medical advances. – Opportunity for women were not compatible with large families, delaying marriage and childbearing. – Medical advances lowered infant and child mortality rates, lessening the sense that multiple children were necessary to sustain a family. – Diffusion of contraceptives, the accessibility to abortions, and woman’s conscious decision to have fewer children at a later age all lower birth rates within a country.
The DTM (Demographic Transition Model) Stage D Both birth rates and death rates remain low, fluctuating with 'baby booms' and epidemics of illnesses and disease. This results in a steady population.
Stage 4: Low Growth • The countries experiencing exceptionally low TFRs are in the fourth stage of the demographic transition. • Having achieved low (if not too low) birth rates along with low death rates puts the countries in a position of low to zero population growth. • Birth rates are lowest in the countries where women are the most educated and most involved in the labor force. • A country reaches stage 4 when the CBR declines to the point where it equals the CDR, and the NIR approaches zero. • This condition is called ZPG (Zero Population Growth), a term often applied to stage 4 countries. • Italy and France – Western European countries.
The DTM (Demographic Transition Model) Stage E? A stage 5 was not originally thought of as part of the DTM, but some northern countries are now reaching the stage where total population is declining where birth rates have dropped below death rates.
Future Population Growth • Many agencies suggest most (if not all) countries’ populations will stop growing at some time during the 21 st century, reaching a so-called stationary population level (SPL). • This would mean the world’s population would stabilize and the major problems to be faced would involve the aged rather than the young. • In 2004, the United Nations predicted that world population would stabilize at 9 billion in 300 years.
Demographic Transition
Combining Both Models
Population Pyramids related to the Demographic Transition Model Stage 1 IMPLICATIONS Both birth rates and Death rates are High, so population growth rates are slow but population Is usually restored Due to high birth Rate. Short life Expectancy EXAMPLES: Afghanistan, Ivory Coast Stage 2 Stage 3 IMPLICATIONS Population continues to grow but at slower rate. Low C Death Rate. Dramatically declining Crude Birth Rate. Low Crude Birth Rate and Crude Death Rate Higher dependency ratio and longer life expectancy Crude Death Rate does Rise slightly because of The ageing population Population starts to grow at an exponential rate due to fall in Crude Death Rate. More living In middle age. Life expectancy rises Infant mortality rate falls. EXAMPLES: Ireland, China, New Zealand EXAMPLES: Jordan, Thailand Stage 4 EXAMPLES: United States, Japan There is some merit in including or considering a Stage 5 today with a declining population