POPULATION PROJECTIONS AND ESTIMATES WHY ARE THESE IMPORTANT


- Slides: 11
POPULATION PROJECTIONS AND ESTIMATES WHY ARE THESE IMPORTANT IN EDUCATION WORK?
Indicators • Many education indicators refer to a population, including: • • Share of population 15+ with a qualification Literacy of 15 to 24 years olds Net enrolment and gross enrolment rates Proportion of out of school children • When we are using all data from the same collection it is not an issue, but …
The reliability of enrolment rates and out-of-school rates depends on the population estimates used
Why can’t we just use the census counts?
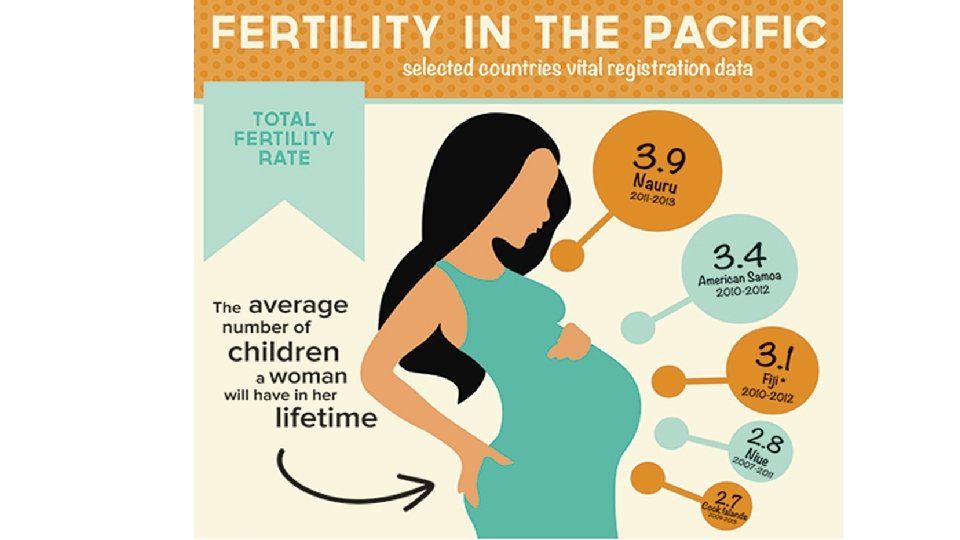
Balancing equation The population of a geographic area grows or declines through the interaction of three factors: 1. fertility, 2. mortality, and 3. migration. Population. Yr 2 = Population. Yr 1 + (Births – Deaths) + (In-migrants – out-migrants)
Standard population distributions
Information needed for a projection by age, sex 1. Age-specific fertility rates (start and end of period) 2. Age-sex-specific probabilities of dying (life table) 3. Life expectancy by sex (start and end of period) 4. Net migration (start and end of period) 5. Age-sex-specific migration rates (fixed)
Presenting projections • Growth rates • Proportion of youth • Median age • Age-sex distributions (pyramids) • …. .
New Caledonia
PNG