
POPULATION Population Pyramids Learning Outcomes By the end
POPULATION Population Pyramids

Learning Outcomes By the end of this lesson you should be able to… • Explain what a population pyramid is.
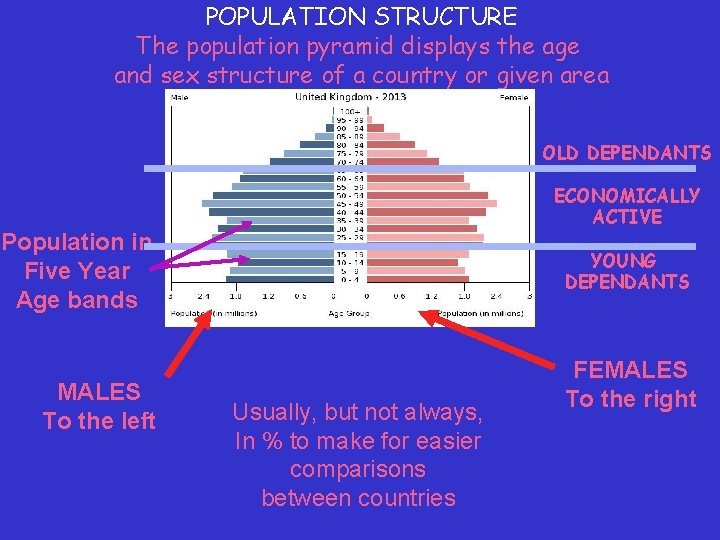
POPULATION STRUCTURE The population pyramid displays the age and sex structure of a country or given area OLD DEPENDANTS ECONOMICALLY ACTIVE Population in Five Year Age bands MALES To the left YOUNG DEPENDANTS Usually, but not always, In % to make for easier comparisons between countries FEMALES To the right
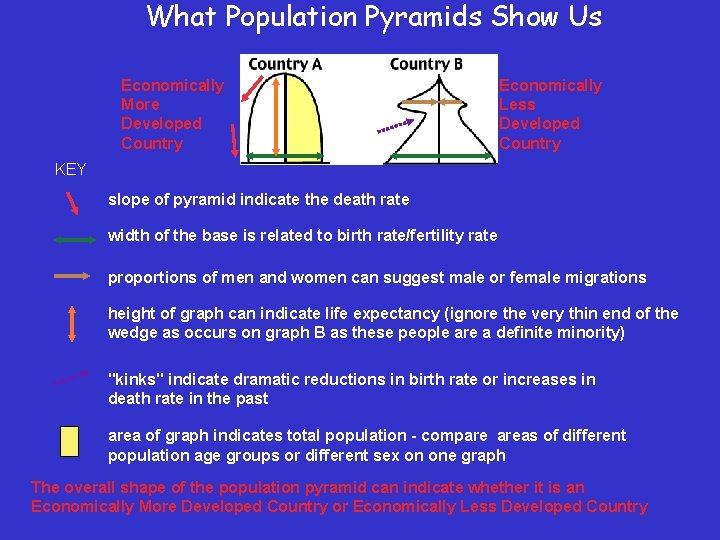
What Population Pyramids Show Us Economically More Developed Country Economically Less Developed Country KEY slope of pyramid indicate the death rate width of the base is related to birth rate/fertility rate proportions of men and women can suggest male or female migrations height of graph can indicate life expectancy (ignore the very thin end of the wedge as occurs on graph B as these people are a definite minority) "kinks" indicate dramatic reductions in birth rate or increases in death rate in the past area of graph indicates total population - compare areas of different population age groups or different sex on one graph The overall shape of the population pyramid can indicate whether it is an Economically More Developed Country or Economically Less Developed Country
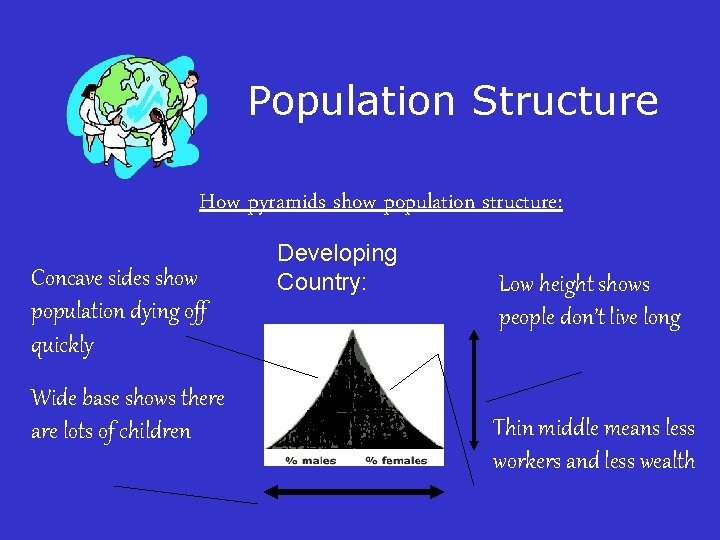
Population Structure How pyramids show population structure: Concave sides show population dying off quickly Wide base shows there are lots of children Developing Country: Low height shows people don’t live long Thin middle means less workers and less wealth
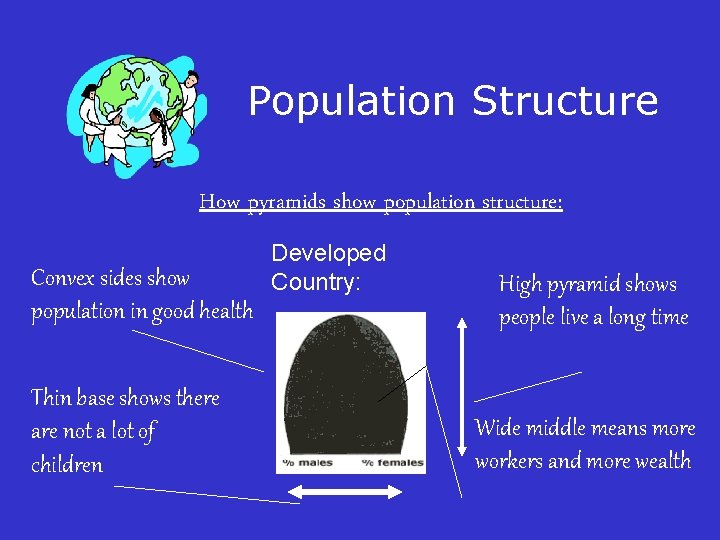
Population Structure How pyramids show population structure: Convex sides show population in good health Thin base shows there are not a lot of children Developed Country: High pyramid shows people live a long time Wide middle means more workers and more wealth

Dependency Ratio ‘A measure of the portion of a population which is composed of dependents (people who are too young or too old to work)‘ population under age 15 and above age 65 working-age population (those aged 15 -64)
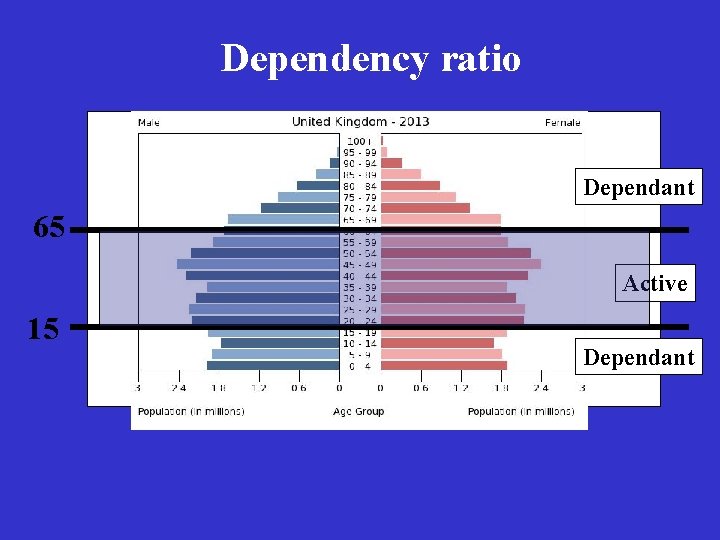
Dependency ratio Dependant 65 Active 15 Dependant

Next 2 slides • Use the worksheet to add the correct labels to the population pyramids.

Population Pyramids -features of LEDC The population between the yellow lines is the working population. In a poorer country there will be a higher dependant population of young putting greater pressure on the working population to provide adequate food, clothes, shelter etc. Sharp decline in the percentages for older people show that there is a high death rate and a low life expectancy Very wide base shows that there is a high birth rate 0 male An indent in the figures will tell you that the population has fallen for one of several reasons. If it is on the male side it might be soldiers dying in a conflict but is more likely to be workers moving away to get jobs 1 2 3 4 5 female 6
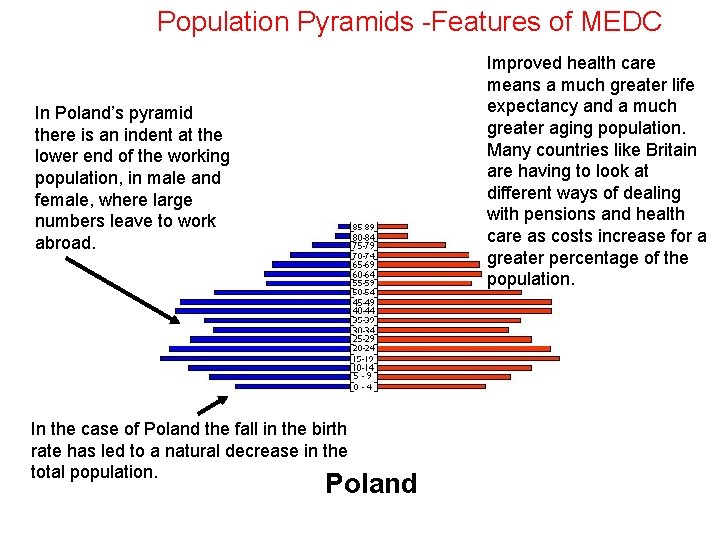
Population Pyramids -Features of MEDC Improved health care means a much greater life expectancy and a much greater aging population. Many countries like Britain are having to look at different ways of dealing with pensions and health care as costs increase for a greater percentage of the population. In Poland’s pyramid there is an indent at the lower end of the working population, in male and female, where large numbers leave to work abroad. In the case of Poland the fall in the birth rate has led to a natural decrease in the total population. Poland
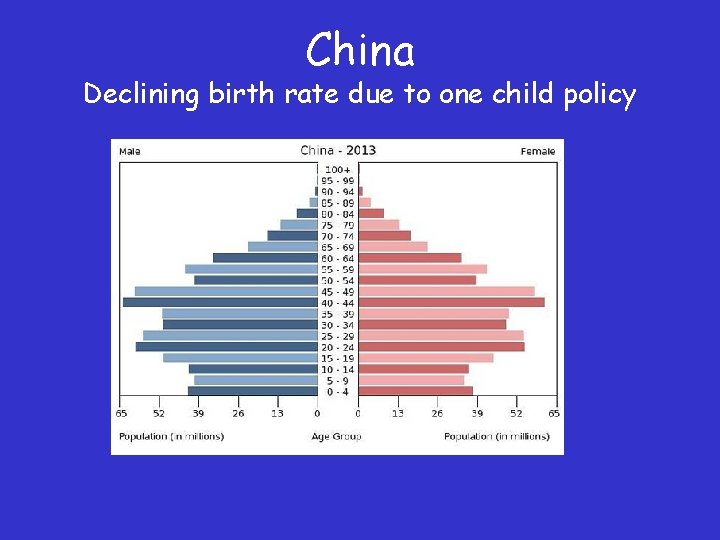
China Declining birth rate due to one child policy
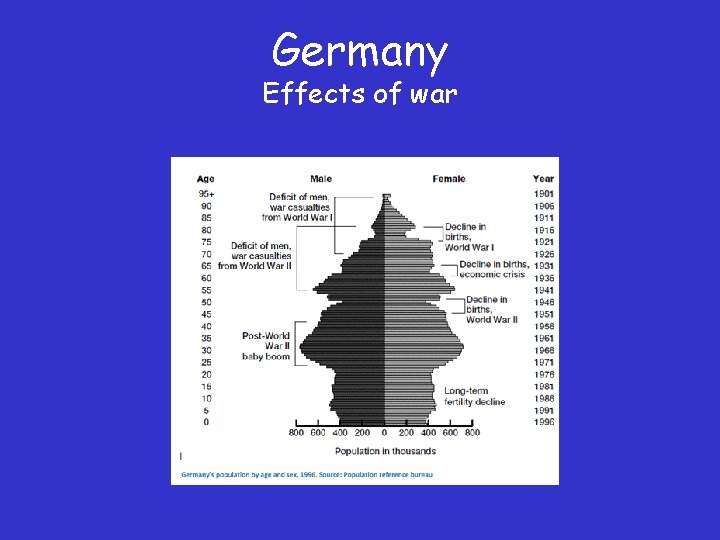
Germany Effects of war
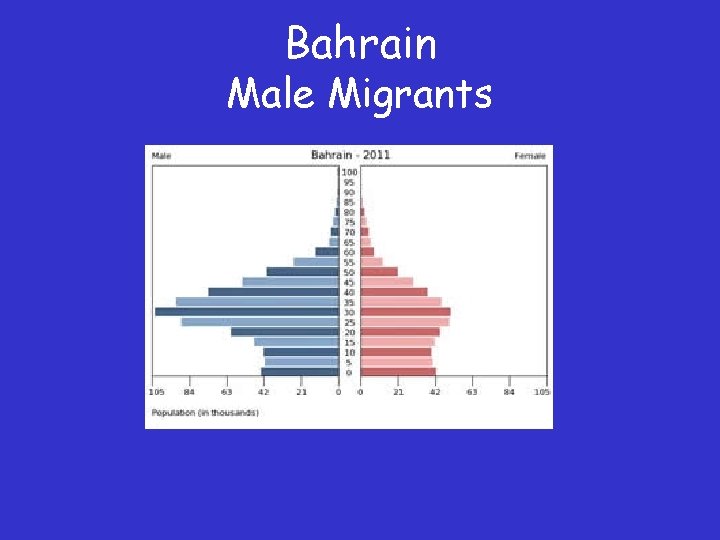
Bahrain Male Migrants
Consequences of Age Structure • In Developed countries the main issue linked to the population structure is that of ageing and in some cases even population decline. • Demographers state that women should have 2. 1 children on average to sustain population replacement level. However in many developed countries this is not happening. • In the UK the 2017 estimate is 1. 9, Japan 1. 4, Italy 1. 42. • However the opposite is true in developing countries.
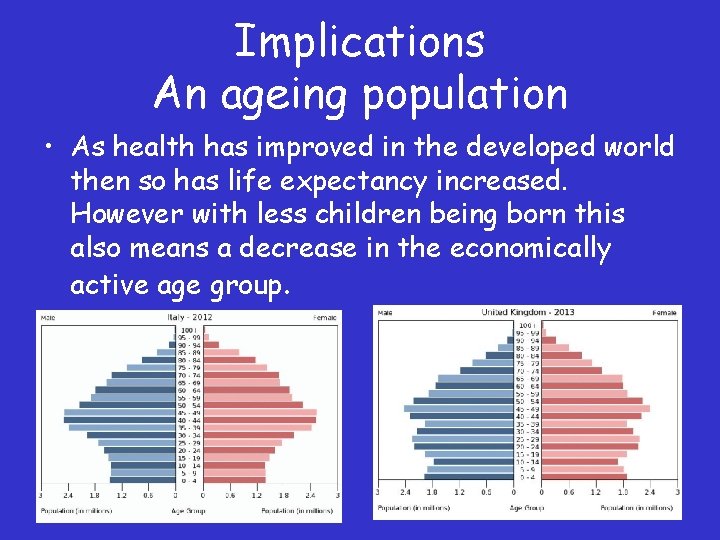
Implications An ageing population • As health has improved in the developed world then so has life expectancy increased. However with less children being born this also means a decrease in the economically active age group.
Implications (Contd) • The government must therefore consider pension provision and encouragement of private pension schemes. • Access to good health care and care services e. g. geriatric wards, ‘meals on wheels’ services, day centres as well as sheltered housing and medical technology. • It is also likely that there will be a greater demand for public transport.
• With fewer younger dependents this will mean issues based around the closure of schools and maternity wards. • There will be fewer people in the workforce and so the pension age will have to be raised e. g. UK. • The dependency ratio could be decreased by encouraging more immigrants and easing access for asylum seekers.
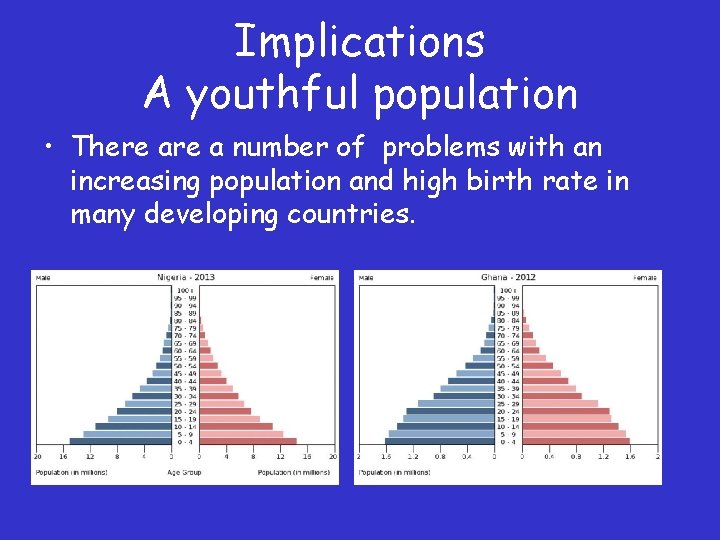
Implications A youthful population • There a number of problems with an increasing population and high birth rate in many developing countries.
Implications Youthful populations • Where there is a high dependency ratio e. g. Kenya, Tanzania then these countries have to spend a disproportionately large sums of money on education and child healthcare. (Such countries have to invest in education as this is key in reducing fertility rates). • As these young dependents move into the 1549 year age cohorts (population momentum) then this puts a greater strain on services e. g. housing, infrastructure provision and jobs. In many developing countries the unemployment is high despite a slight decrease in birth rate.
• Population momentum also carries through to old dependents. This can be viewed in two ways; 1. that they are dependent on the younger working age cohort and so problems associated with this or 2. that a healthy elderly group are a resource for their communities, families and the economy.
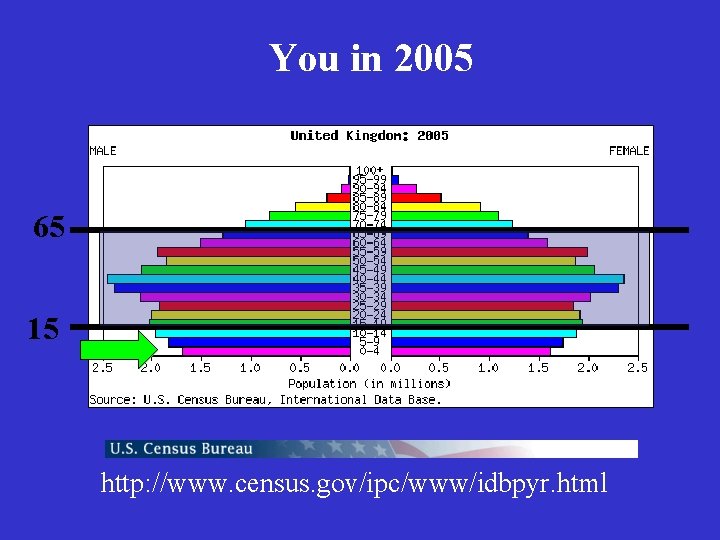
You in 2005 65 15 http: //www. census. gov/ipc/www/idbpyr. html
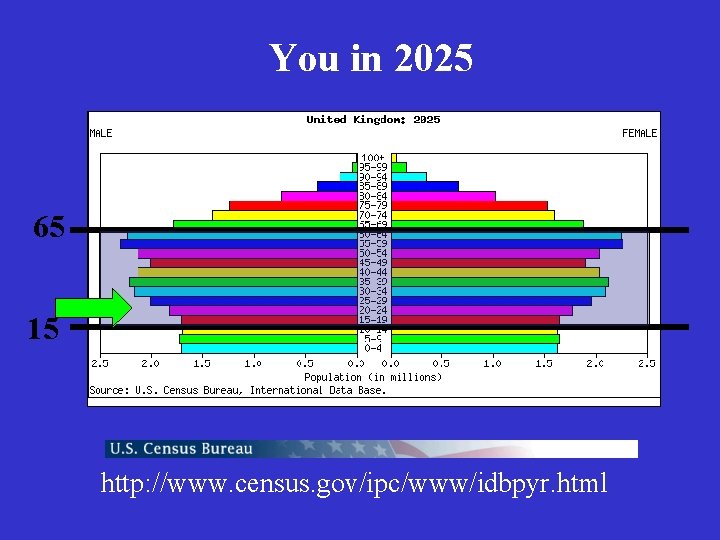
You in 2025 65 15 http: //www. census. gov/ipc/www/idbpyr. html
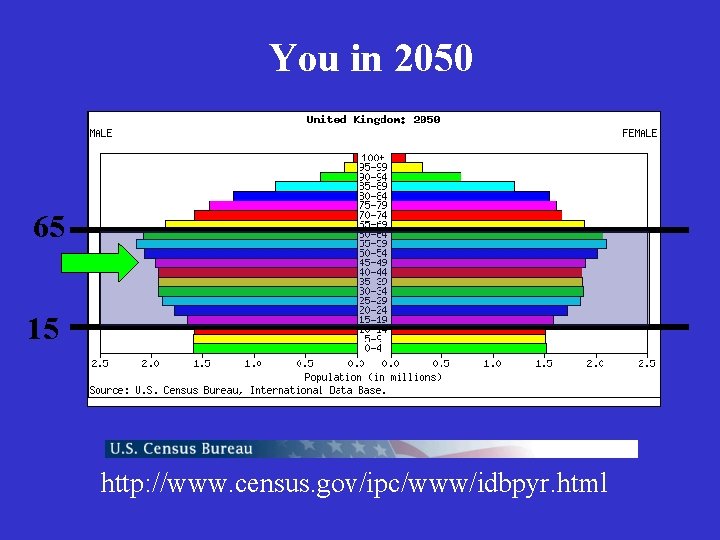
You in 2050 65 15 http: //www. census. gov/ipc/www/idbpyr. html
- Slides: 24