Population Measures Courtesy of NASA Will the World


.")


: 1950 -2050")


 is the total")
 is the total")
 is the percentage")
 is the number")


- Slides: 22
Population Measures Courtesy of NASA
Will the World Face an Overpopulation Problem? • Malthus theory vs. reality • Carrying Capacity: Carrying capacity is the maximum number of a species an environment can support indefinitely. It is very difficult to calculate human carrying capacity. Humans are a complex species. We do not reproduce, consume resources and interact with our living environment uniformly. World health threats • Epidemiological transitions
Food & Population Malthus vs. Actual Trends Fig. 2 -20: Malthus predicted population would grow faster than food production, but food production actually expanded faster than population in the 2 nd half of the 20 th century.
World Population Cartogram Fig. 2 -1: This cartogram displays countries by the size of their population rather than their land area. (Only countries with 50 million or more people are named. )
World Population Density
Population Density – measure of total population relative to land size (arithmetic population density).
Arithmetic Population Density Fig. 2 -4: Arithmetic population density is the number of people per total land area. The highest densities are found in parts of Asia and Europe.
Physiological Density Fig. 2 -5: Physiological density is the number of people per arable land area. This is a good measure of the relation between population and agricultural resources in a society.
Agricultural Density Fig. 2 -6 Agricultural density is the number of farmers per arable land area.
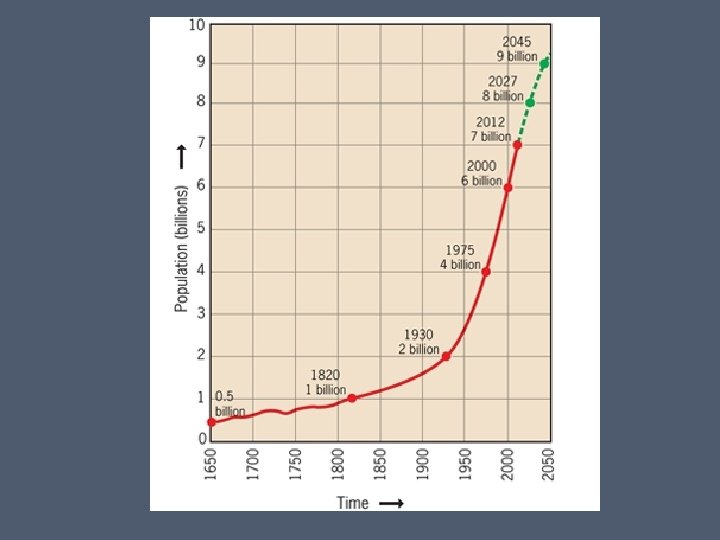
Global Population Growth Is Driven by Developing Countries. World Population (in Billions): 1950 -2050 Source: United Nations Population Division, World Population Prospects
Population Pyramid – Less Developed Population by Age and Sex, Less Developed Countries Source: United Nations Population Division, World Population Prospects
Population Pyramid – More Developed Population by Age and Sex, More Developed Countries Source: United Nations Population Division, World Population Prospects
Figure 2. 16 Age–Sex Population Pyramids for Countries with High Population Growth Rates. Countries with high total fertility rates, high infant mortality rates and low life expectancies will have population pyramids with wide bases and narrow tops. Data from: UN, World Population Prospects Figure 2. 17 Age–Sex Population Pyramids for Countries with Low Population Growth Rates. Countries with lower total fertility rates and longer life expectancies have population pyramids shaped more uniformly throughout. Data from: UN, World Population Prospects
Data from: Population Reference Bureau
Population Pyramids in U. S. cities Fig. 2 -16: Population pyramids can vary greatly with different fertility rates (Laredo vs. Honolulu), or among military bases (Unalaska), college towns (Lawrence), and retirement communities (Naples).
Crude Birth Rates Fig. 2 -8: The crude birth rate (CBR) is the total number of births in a country per 1000 population per year. The lowest rates are in Europe, and the highest rates are in Africa and several Asian countries.
Crude Death Rates Fig. 2 -12: The crude death rate (CDR) is the total number of deaths in a country per 1000 population per year.
Natural Increase Rates Fig. 2 -7: The natural increase rate (NIR) is the percentage growth or decline in the population of a country per year (not including net migration). Countries in Africa and Southwest Asia have the highest current rates, while Russia and some European countries have negative rates.
Total Fertility Rates Fig. 2 -9: The Total fertility rate (TFR) is the number of children an average woman in a society will have through her childbearing years. The lowest rates are in Europe, and the highest are in Africa and parts of the Middle East.
Infant Mortality Rates Fig. 2 -10: The infant mortality rate is the number of infant deaths per 1000 live births per year. The highest infant mortality rates are found in some of the poorest countries of Africa and Asia.
Life Expectancy at birth Fig. 2 -11: Life expectancy at birth is the average number of years a newborn infant can expect to live. The highest life expectancies are generally in the wealthiest countries, and the lowest in the poorest countries.