Population LO understand the concepts of distribution and

Population LO – understand the concepts of distribution and density. By the end of the lesson you should be able to define each of the concepts and using maps to demonstrate where the world’s population is distributed.

Population distribution – how people are spread out over an area. There are 7500 million people spread out across the Earth’s surface and the distribution is uneven. Some places are crowded whilst others have hardly any people living in them. LO – understand the concepts of distribution and density. By the end of the lesson you should be able to define each of the concepts and using maps to demonstrate where the world’s population is distributed.

LO – understand the concepts of distribution and density. By the end of the lesson you should be able to define each of the concepts and using maps to demonstrate where the world’s population is distributed.

Density – the measure of how crowded a place is. Worked out by dividing the total population by the area. Sparsely populated Places with few people and a low population density are said to be sparsely populated. Densely populated Places that are crowded and have a high population density are said to be densely populated. LO – understand the concepts of distribution and density. By the end of the lesson you should be able to define each of the concepts and using maps to demonstrate where the world’s population is distributed.

There are many reasons for population distribution. Those that encourage people are called positive factors and those that discourage are called negative factors. Densely populated – positive factors Sparsely populated – negative factors • Pleasant climate • Too hot or too cold • Flat land • Too wet or too dry • Good soil (crops) • Steep slopes • Good food supply • Poor soils • Good water supply • Dense forests • Money available • Poor water supply • Good roads, rail, ports • Few natural resources • Natural resources • Poor transport • Industry and jobs • Little industry • Lack of investment LO – understand the concepts of distribution and density. By the end of the lesson you should be able to define each of the concepts and using maps to demonstrate where the world’s population is distributed.

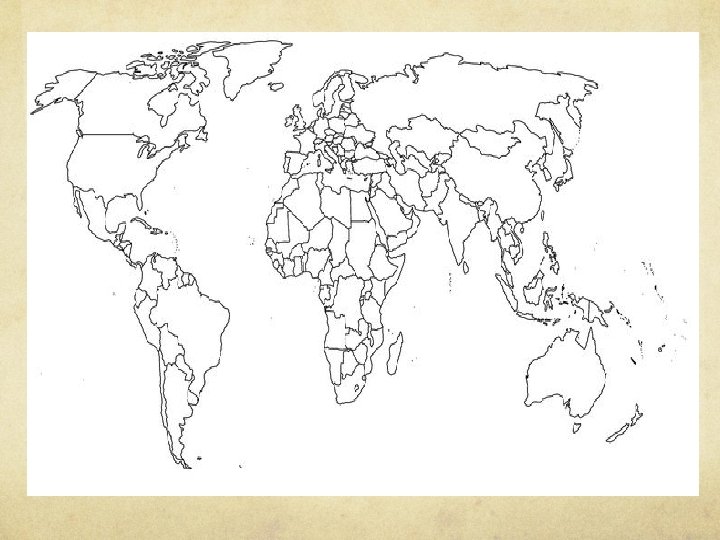
Using the images below explain the factors which have encouraged or discouraged development . LO – understand the concepts of distribution and density. By the end of the lesson you should be able to define each of the concepts and using maps to demonstrate where the world’s population is distributed.

Population growth LO: understand how and why the world’s population has grown over the past 350 years and be able to interpret the Demographic Transition Model (DTM). Skills - be able to plot and draw a population graph, use key terminology appropriately and interpret graph (DTM).

Population growth Skill Using the above information draw a line graph which shows the population growth from 1750 to 2100. Describe the population growth from 1750 to 2100. Guide: Growth was slow Growth was steady Grown faster Rapidly increased

Population growth Does your graph look like this? Population growth has not been even throughout the world – it has been rapid in some countries. The fastest growth has been in the world’s poorer countries whilst growth in the richer countries is now very slow. Some nations in NW Europe have zero population growth e. g. Video – watch the embedded Bulgaria. video clip

Population change on a global scale Areas with highest population growth are in: Asia Africa Latin America Areas with the slowest rates of increase are in: Europe North America Australasia Within regions population change is the result of variations in natural increase and migration.

Population change Key terms Birth rate – is the average number of births per 1000 people. Death rate – is the average number of deaths per 1000 people. The difference between birth rate and death rate = natural increase Hans Rosling video

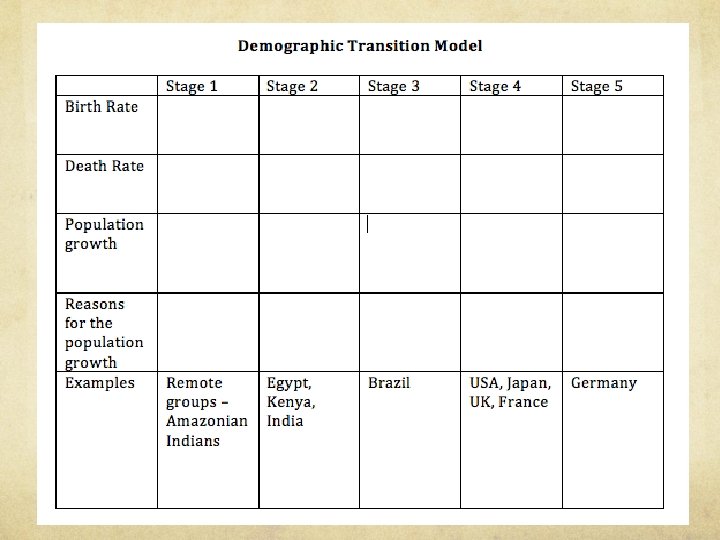
The Demographic Transition Model The demographic transition model shows population change over time. It studies how birth rate and death rate affect the total population of a country.
.")
Changes in population rates can be shown on the Demographic Transition Model (Population Change). It is divided into five, stages: Stage 1 - High Stationary Stage 2 - Early Expanding Birth Rate and Death rate are both high. Population growth is slow and fluctuating. Birth Rate remains high. Death Rate is falling. Population begins to rise steadily. Reasons Death Rate is falling as a result of: Birth Rate is high as a result of: Lack of family planning, High Infant Mortality Rate, Need for workers in agriculture, Religious beliefs Death Rate is high because of: High levels of disease, Famine, Lack of clean water and sanitation, Lack of health care, War, Competition for food Typical of Britain in the 18 th century and the Least Economically Developed Countries (LIC's) today. Youthful population owing to falling death rates – stage 2 Improved health care (e. g. Smallpox Vaccine), Improved Hygiene (Water for drinking boiled), Improved sanitation, Improved food production and storage, Improved transport for food, Decreased Infant Mortality Rates Typical of Britain in 19 th century; Bangladesh; Nigeria

Stage 3 - Late Expanding Stage 4 - Low Stationary Birth Rate starts to fall. Death Rate continues to fall. Population rising. Birth Rate and Death Rate both low. Population steady. Reasons: Typical of USA; Sweden; Japan; Britain Family planning available, Lower Infant Mortality Rate, Increased mechanization reduces need for workers, Increased standard of living, Changing status of women Stage 5 - Declining Population Typical of Britain in late 19 th and early 20 th century; China; Brazil Birth Rate remains low. Death rate begins to rise slightly, resulting in a declining population Death rate rises slightly due to lifestyle choices such as a poor diet and smoking Examples: Germany, Scotland Stage 4 – ageing population because owing to better health, diet etc. however less children being born.

Video

Population pyramid video Population structure can be shown as a population pyramid. Features of a population pyramid. Population is divided into 5 year age groups. Population is divided into males and females. The percentage of each age /sex group is given.

Typical Pyramids The structure and shape of a population pyramid can give a clear indication of a country's development.

Population pyramids & the DTM

HIC LIC

You. Tube videos population issues Overpopulation explained – discussion includes DTM Video The science of overpopulation - Video What happened if only 100 people lived? - Video What if everyone lived in just one city - Video

Do now - write down the following key words Life expectancy Child mortality Demographic Transition Model Population pyramids Sparsely populated Densely populated

Population – changing structures Changing population structures Not only does the total population change but the number of people in different age groups. This can cause problems. Children under 15 The map shows the percentage of young people living in each LO: that around the world there are countries with youthful and ageing of be theaware world’s populations. countries. Understand the reasons and the consequences of these changing

Changing population structures – the elderly People aged over 65 Higher living standards and better health care mean people are living longer. Life expectancy in the USA and Europe today is 80 whereas it was 65 in 1950. In HICs life expectancy continues to rise quickly. This means that soon a high proportion of elderly people will be dependent on younger people The average life expectancy in HICs is rising. This is due to: improvements in health care and medicine increased leisure and recreation time improved knowledge about the importance of a balanced diet and regular exercise improved living standards and quality of life

Population trends Different countries face varying problems when attempting to manage population change. LICs have to manage rapid population growth. HICs have to manage slow or negative growth and an ageing population. Grace in Ghana – video China’s lost girls -

LICs – youthful population Most LICs are experiencing rapid population growth. Most LICs are in stage 2 or 3 of the demographic transition model. This means that they have falling death rates, due to improving health care, while birth rates remain high.

Youthful population The high birth rate in LICs results in a high proportion of the population under 15. The problems include: Young children need health care - for example, immunisations. Expensive for a country to provide. Young people need to be educated - providing schools and teachers are expensive. In the future, more children will reach child bearing age, putting To control a spiraling youthful population anti-natalist policies need to be introduced.

Managing population change Case study: China - Video In the late 1970 s, the Chinese government introduced a number of measures to reduce the country's birth rate and slow the population growth rate. The most important of the new measures was a one-child policy, which decreed that couples in China could only have one child. Previous Chinese governments had encouraged people to have a lot of children to increase the country's workforce. But by the 1970 s the government realised that current rates of population growth would soon become unsustainable. The one-child policy, established in 1979, meant that each couple was allowed just one child. Benefits included increased access to education for all, plus childcare and healthcare offered to families that followed this rule.

Impact of the policy The birth rate in China has fallen since 1979. Impacts Long-term implications China's one-child policy has been somewhat relaxed. There have been negative impacts too - due to a traditional preference for boys, large numbers of female babies have ended up homeless or in orphanages, and in some cases killed. China's population is now rising more slowly but China faces new problems, including: As a result, the gender balance of the Chinese population has become distorted. Today it is thought that men outnumber women by more than 60 million. fewer people of working age to support the growing number of elderly dependants - in the future China could have an ageing population the falling birth rate - leading to a rise in the relative number of elderly people

China – population pyramid

HICs – ageing populations Population change in MEDCs Most HICs are experiencing slow rates of population growth and some are experiencing population decline. Most HICs are in stage 4 of the demographic transition. Some countries have a declining population and could be said to be entering stage 5. This means that the birth rate in their country has fallen below the death rate. The average life expectancy in HICs is rising. This is due to: improvements in health care and medicine increased leisure and recreation time a balanced diet and regular exercise improved living standards and quality of life Birth rates in MEDCs are falling as people choose to have smaller families

Ageing population – pronatalist An ageing population Many HICs experiencing an increase in the number of elderly people. As birth rates fall and people have smaller families, the number of young dependants is falling and the number of elderly dependants is rising. In the near future there will be fewer economically active people to support the elderly population. To balance out an ageing population, a pro-natalist policy has been adopted - encourage people to have more children by offering them benefits, such as access to childcare and maternity

Case study: pro-natalist policy in France Many areas of Europe have a low fertility rate because of the following reasons: education - people are more aware of the availability of contraception and consequences an unplanned pregnancy can have on their career women in careers - Women may choose to follow their career choice rather than start a family while young later marriages state benefits - couples no longer need children to help care for them when older

France was a country with concerns that professional women were choosing not to have children. The government were worried that the population was not going to replace itself over time. The policies that were put in place to encourage three-children families were: a cash incentive of £ 675 monthly (nearly the minimum wage) for a mother to stay off work for one year following the birth of her third child the 'carte famille nombreuse' (large family card), giving large reductions on train fares income tax based on the more children the less tax to pay three years paid parental leave, which can be used by mothers or fathers government subsidised day care for children under the age of three, and full time school places for over threes paid for by the government This has resulted in mothers considering having children and remaining in work. The fertility rate in France is one of Europe's highest. France
- Slides: 35