POPULATION ISSUES PATTERNS Cartoons Population Issues Patterns Population


 Billion 1 2 3")


 (Immigrant")
 (Rich) 20% of world population")

 is a")


 n 1950’s")


- Slides: 31
POPULATION ISSUES & PATTERNS Cartoons
Population Issues & Patterns
Population Issues & Patterns
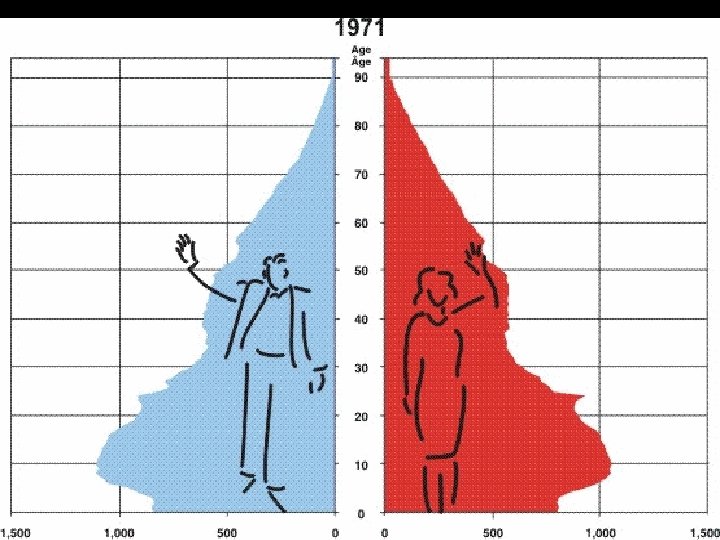
Population Issues & Patterns Age structure pyramid comparison
Population Issues & Patterns Location of people The World’s population just reached 7 Billion. Where are the most People? Africa, Asia, Europe, The America’s or Australia? ASIA has over 50%.
A Global Village Population Issues & Patterns If our World was actually a village of 100 people …. . It would have: 58 Asians, 14 Africans, 13 Europeans, 9 Latin Americans, 5 North Americans 1 Weirdo
World Population History #2 (years to add 1 billion people) Billion 1 2 3 4 5 6 7 Year 1800 1930 1960 1975 1987 1999 2011 # of years 2 million? 130 30 15 12 12 12
Population Issues & Patterns How is the world’s population total changing presently? n n The population of earth increases by about 90 million people/ year This is calculated by subtracting deaths from births That means an increase of approximately 250, 000 per day. Or about 13, 000 in one class period time of 75 minutes
Population Issues & Patterns Do some places add more people? n Can you Guess which world area contributes more people? Africa, Asia, Europe, The America’s or Australia? ASIA – contributes over 2/3 of the population grow
Population Issues & Patterns Is fast growth a good thing? n n High population and fast growth can cause problems. Can you name some global problems that relate? poverty, hunger, deforestation, global warming, soil erosion, disease, desertification, habitat loss(extinction), ozone layer depletion, resource depletion, global warming, pollution of air and water…. .
Population Issues & Growth Patterns Population ……has 2 parts Population Increase = NIR + NMR a) NIR = Natural Increase Rate b) NMR = Net Migration Rate
NIR = Birth rate – Death Rate NMR = Incomers – outgoers Rate) (Immigrant rate – Emigrant
Population Terminology Rich and Poor More Developed countries (MDC’s) (Rich) 20% of world population create 80% of the pollution in the world LDC’s (Lesser Developed Countries) (poor) 80% of the worlds people are now getting technology and starting to industrialize As LDC’s develop and begin to consume resources like MDC’s, environmental problems will explode.
Population Issues & Patterns Yellow countries are considered LDC’s.
Population Issues & Patterns Census: Is a counting of the people a) is a count of a country’s population b) It is recorded in Years ending in a 1 or a 6 QUESTIONS: What types of people might be missed in a Canadian Census? How might people in other countries might NOT be counted?
Population Issues & Patterns How Does Canada’s Population change on an average day? 1070 people are born 610 immigrants arrive 575 people die 135 people emigrate …. . we gain about 970 people per day
If Canada only grew by births and deaths Canada would have an increase rate of 6. 2 /1000 or 0. 62 % DOUBLING TIME = NUMBER OF YEARS TO DOUBLE IN SIZE THE RULE OF 70 calculates doubling time 70 divided by % increase 70 / 0. 62 = = # of years to double 113 years
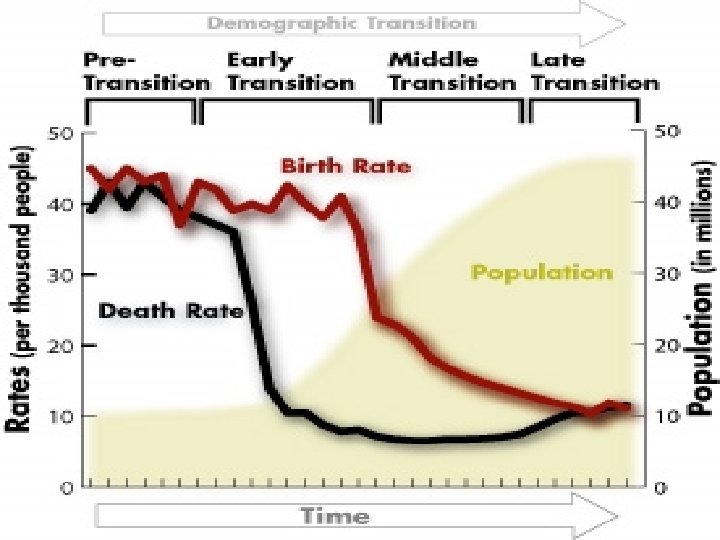
Population Issues & Patterns 1 st, n rd 3 or th 5 World First world = low birth rates and low death rates n Third World = high birth rates and low death rates n Fifth World = high birth rates and high death rates
Demographic Transition Patterns based on Birth and death rates. Countries progress through “stages” over time. Countries move from being a fifth world country to a third world country and then first world country The change through these stages is called… DEMOGRAPHIC TRANSITION
All countries are at some place in this transition.
Population Issues & Patterns Canadian Age Groups in society today n n Baby Boomer Age 48 to 64 – born 1946 - 1962 Generation X Age 30 to 47 – born 1963 – 1980 Echo Boom Age 17 to 29 – born 1981 – 1993 Echo X Age 0 to 16 – born 1994 – present
Population Issues & Patterns Fertility Rates n TFR = Total Fertility Rate The number of children produced per female = a mathematical number. 2. 1 is “replacement or stability”.
Fertility rate TFR history in Canada 1930’s = 2. 8 (The Depression) n 1950’s = 3. 9 (The Baby boom) n 1960’s = 2. 3 (Women’s Liberation) n Presently = 1. 5 (Modern Society) n
Dependency WORKERS pay taxes to support Dependents who don’t pay taxes. This includes the young and old n Age Groups WORKER = 17 to 59 Young (YNW) = 16 And under Old (ONW) = over 60 Total Dependants = YNW + ONW n Dependency LOAD = …. n n n % the of the population that is supported from the taxes of the workers
Dependency Patterns over time Year Workers YNW ONW 1981 63% 21% 16% 2001 62% 19% 2031 50% 15% 35% Total Dependency 37% 38% 50% Q 1) How old will you be in 2031? (21 years from now)…… - There will be an equal number of dependents and workers Q 2) Do you think that you will have pay more taxes to support dependents in 2031 than your parents pay now? Q 3) Can you think of any good alternatives?
Think About it n n What IDEAS could the government of Canada begin NOW to reduce future problems with increasing total (and increasing Old age) dependency? Can you name a good job choice and a not-so -good one based on this information?
Population Issues & Patterns Population Pyramid Basically called AGE – SEX Pyramids Age groups are by 4 years One side is PINK and the other is BLUE Canada has a moving BULGE “the Baby BOOM Group”
Population Issues & Patterns
n See website from Canadian Government for more pyramids http: //www. statcan. gc. ca/ads-annonces/91 -520 -x/pyra-eng. htm