
Population Health Big Data Interoperability and Analytics for
Population Health Big Data, Interoperability, and Analytics for Population Health Lecture d This material (Comp 21 Unit 9) was developed by Johns Hopkins University, funded by the Department of Health and Human Services, Office of the National Coordinator for Health Information Technology under Award Number 90 WT 0005. This work is licensed under the Creative Commons Attribution-Non. Commercial-Share. Alike 4. 0 International License. To view a copy of this license, visit http: //creativecommons. org/licenses/by-nc-sa/4. 0/.
Big Data, Interoperability, and Analytics for Population Health Learning Objectives — Lecture d • Describe methods and tools commonly used for population health analytics. • Analyze and critique a number of sample population health analytic results. 2
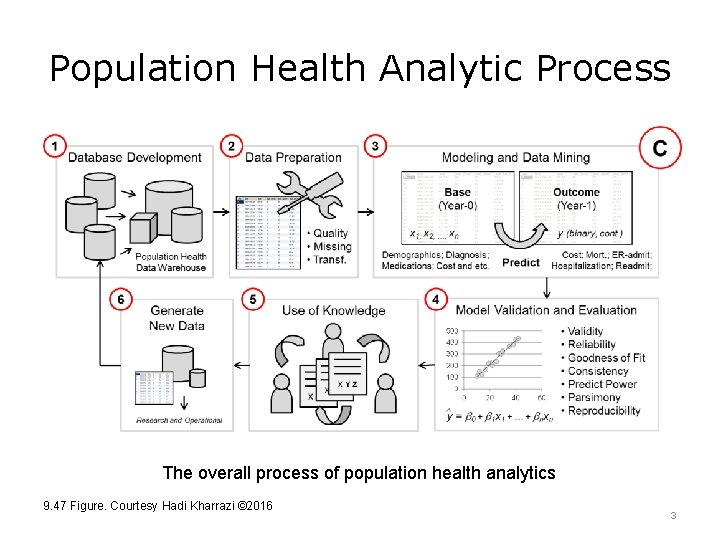
Population Health Analytic Process The overall process of population health analytics 9. 47 Figure. Courtesy Hadi Kharrazi © 2016 3
Modeling Tools • Tools: – Spreadsheets. – Statistical packages. – Data mining applications. – Specialized population health analytic tools. – Understanding the population health reports. • See the standalone data analytic component for details. 4
Tools: Spreadsheets • Open source spreadsheets: – Apache Open. Office Calc: the spreadsheet application of Open. Office can be used to explore average-size population health data (e. g. , analytical datasets or aggregates) and execute simple functions, such as SUM, AVG, and SD. – Others: Libre. Office Calc, Neo. Calc, and Calligra Sheets. • Microsoft Excel: can also be used to explore population health data and run simple calculations. • Online spreadsheets: can be used to explore and share population health data (e. g. , Google Sheets, ZK Spreadsheet, wiki. Calc). 5
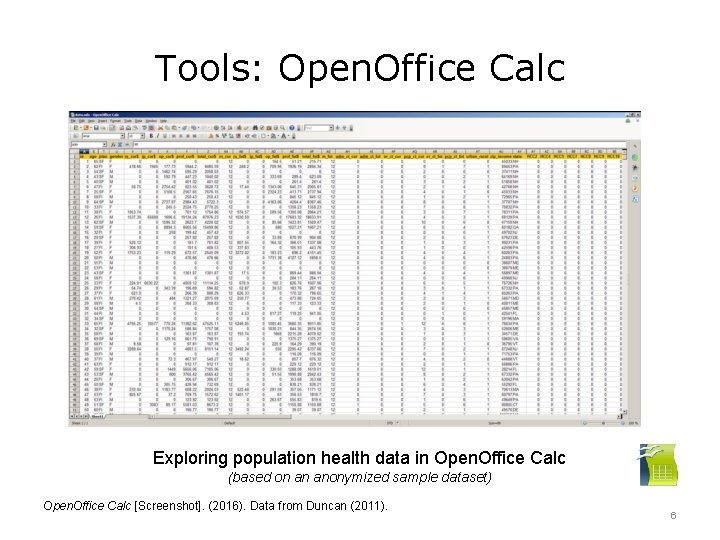
Tools: Open. Office Calc Exploring population health data in Open. Office Calc (based on an anonymized sample dataset) Open. Office Calc [Screenshot]. (2016). Data from Duncan (2011). 6
Tools: Statistical Packages • Open source packages: – R/RStudio: a programming language and software environment for statistical computing and graphics. R is widely used by statisticians and data miners. R has been used to develop population health analytical models in the past. – PSPP: an application for analysis of sampled data, intended as a free alternative for SPSS. – Epi Info: software for rapid creation of data collection instruments and data analysis, visualization, and reporting using epidemiologic methods. • Commercial packages: – S-PLUS, SAS, IBM SPSS, Stata, Minitab, JMP, Maple, MATLAB, WPS, and may others. 7
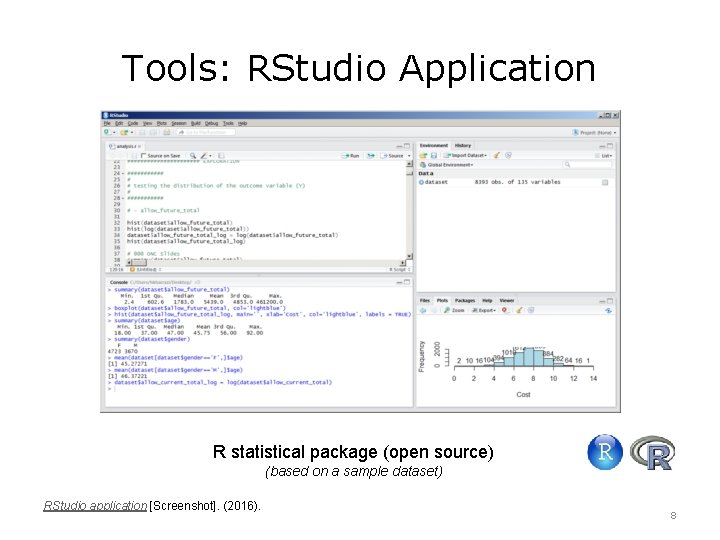
Tools: RStudio Application R statistical package (open source) (based on a sample dataset) RStudio application [Screenshot]. (2016). 8
Tools: Data Mining Applications • Open source applications: – Weka: contains a collection of visualization tools and algorithms – – – for data analysis and predictive modeling. Rapid. Miner: provides an integrated environment for machine learning, data mining, text mining, and predictive analytics. KNIME: offers data access, transformation, exploration, analytics, and visualization. Orange: focuses on data exploration and visualization. NLTK and c. TAKES: focus on natural language processing. Statistical and business intelligence applications (e. g. , R, Pentaho). • Commercial applications: – MATLAB, SAS, IBM SPSS, TIBCO Spotfire, JMP, Tableau, Mathematica, Cognos, Bayesia, and others. 9
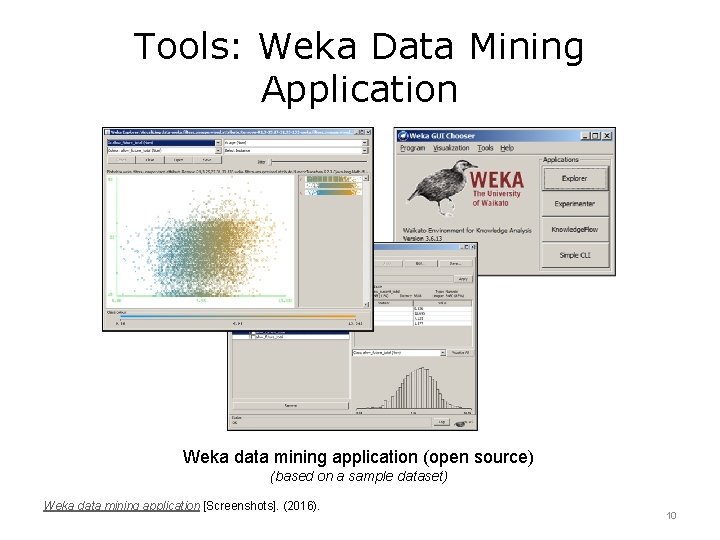
Tools: Weka Data Mining Application Weka data mining application (open source) (based on a sample dataset) Weka data mining application [Screenshots]. (2016). 10
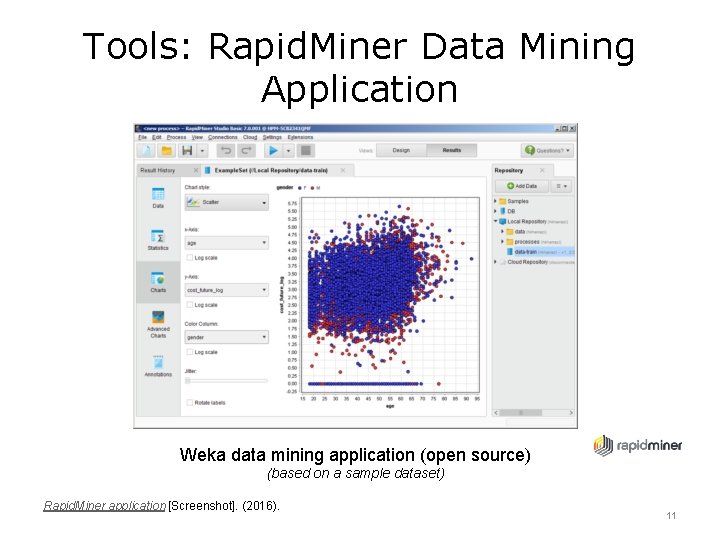
Tools: Rapid. Miner Data Mining Application Weka data mining application (open source) (based on a sample dataset) Rapid. Miner application [Screenshot]. (2016). 11
Tools: Specialized Population Health Analytic Tools • Charlson Comorbidity Index (CCI): “a method of categorizing comorbidities of patients based on International Classification of Diseases (ICD) diagnosis codes found in administrative data. – “A score of zero indicates that no comorbidities were found. – “The higher the score, the more likely the predicted outcome will result in mortality or higher resource use. ” (University of Manitoba) – There are R/SAS codes to calculate CCI, based on claims data. • Commercial population health analytic and scoring tools: – Johns Hopkins Adjusted Clinical Groups (JHU ACG), 3 M Clinical Risk Grouping Software (CRGs), Ingenix Symmetry Episode Risk Groups (ERGs)/Pharmacy Risk Groups (PRGs), and Verisk Dx. CG Intelligence. 12
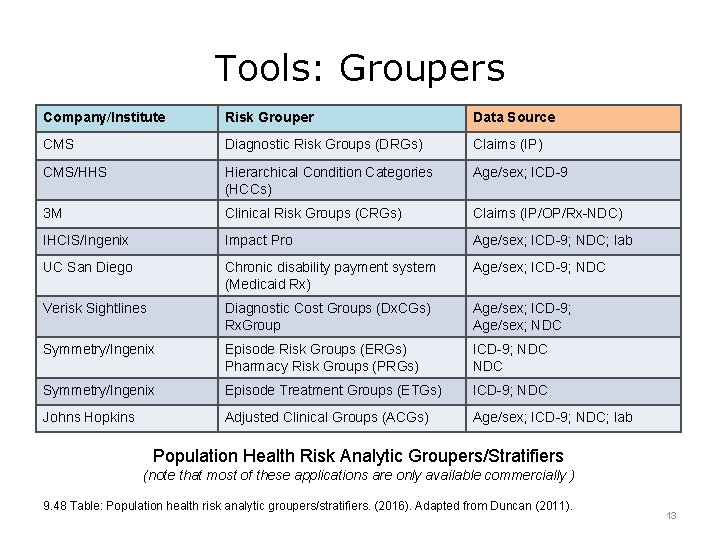
Tools: Groupers Company/Institute Risk Grouper Data Source CMS Diagnostic Risk Groups (DRGs) Claims (IP) CMS/HHS Hierarchical Condition Categories (HCCs) Age/sex; ICD-9 3 M Clinical Risk Groups (CRGs) Claims (IP/OP/Rx-NDC) IHCIS/Ingenix Impact Pro Age/sex; ICD-9; NDC; lab UC San Diego Chronic disability payment system (Medicaid Rx) Age/sex; ICD-9; NDC Verisk Sightlines Diagnostic Cost Groups (Dx. CGs) Rx. Group Age/sex; ICD-9; Age/sex; NDC Symmetry/Ingenix Episode Risk Groups (ERGs) Pharmacy Risk Groups (PRGs) ICD-9; NDC Symmetry/Ingenix Episode Treatment Groups (ETGs) ICD-9; NDC Johns Hopkins Adjusted Clinical Groups (ACGs) Age/sex; ICD-9; NDC; lab Population Health Risk Analytic Groupers/Stratifiers (note that most of these applications are only available commercially ) 9. 48 Table: Population health risk analytic groupers/stratifiers. (2016). Adapted from Duncan (2011). 13
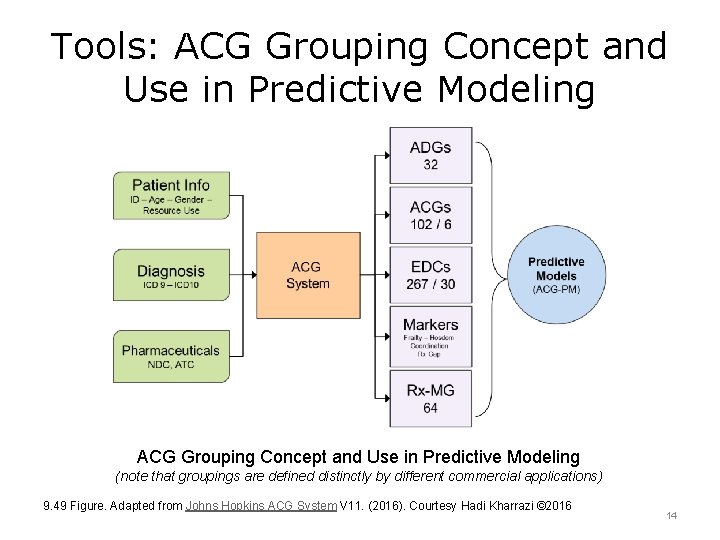
Tools: ACG Grouping Concept and Use in Predictive Modeling (note that groupings are defined distinctly by different commercial applications) 9. 49 Figure. Adapted from Johns Hopkins ACG System V 11. (2016). Courtesy Hadi Kharrazi © 2016 14
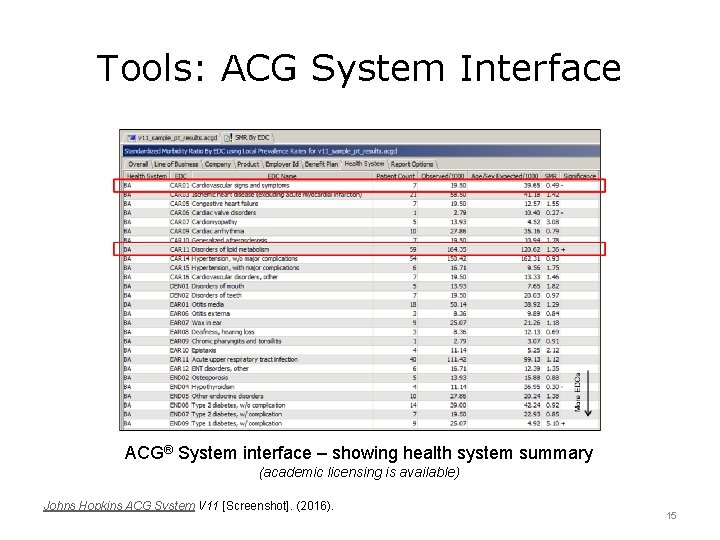
Tools: ACG System Interface ACG® System interface – showing health system summary (academic licensing is available) Johns Hopkins ACG System V 11 [Screenshot]. (2016). 15
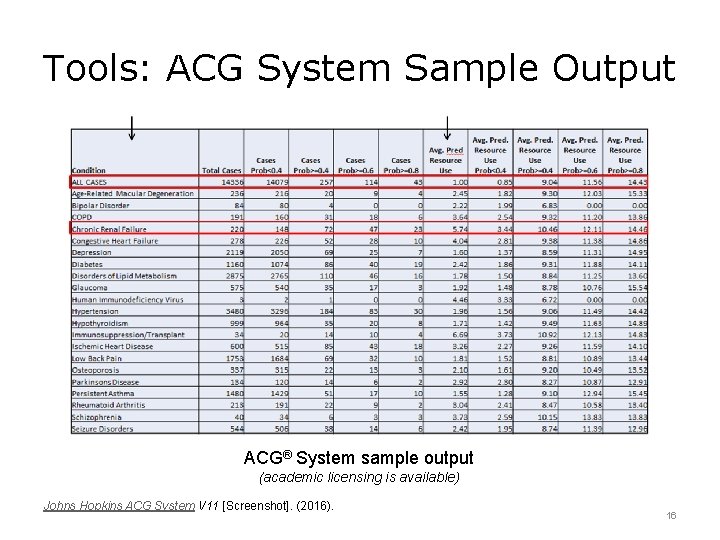
Tools: ACG System Sample Output ACG® System sample output (academic licensing is available) Johns Hopkins ACG System V 11 [Screenshot]. (2016). 16
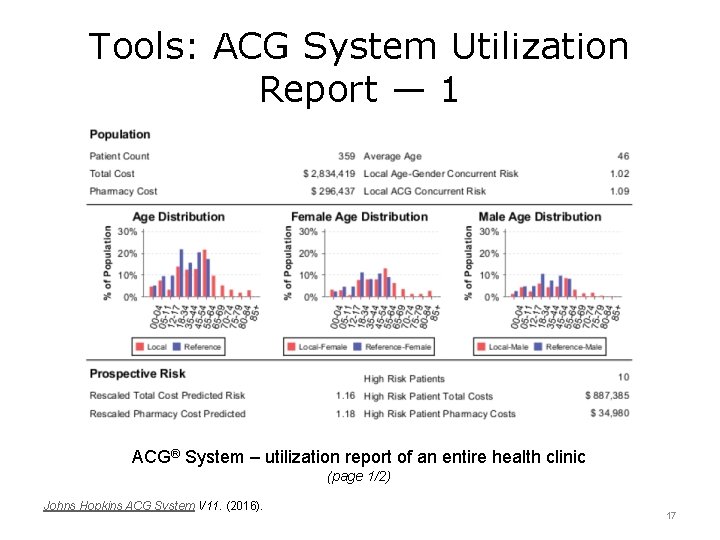
Tools: ACG System Utilization Report — 1 ACG® System – utilization report of an entire health clinic (page 1/2) Johns Hopkins ACG System V 11. (2016). 17
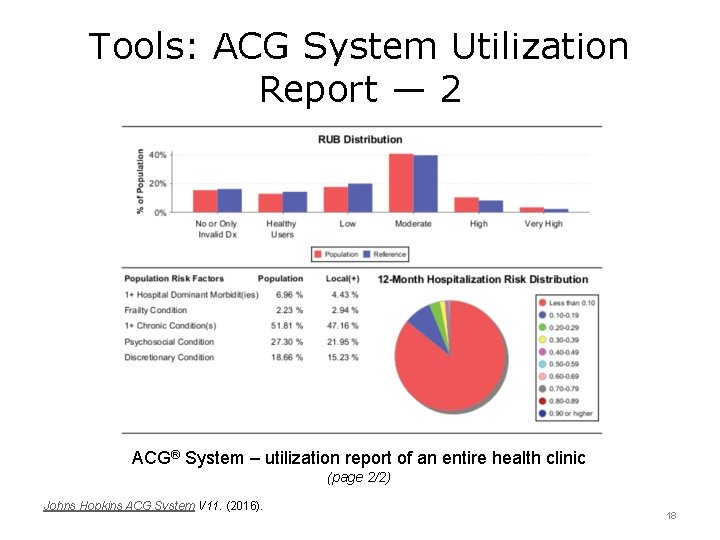
Tools: ACG System Utilization Report — 2 ACG® System – utilization report of an entire health clinic (page 2/2) Johns Hopkins ACG System V 11. (2016). 18
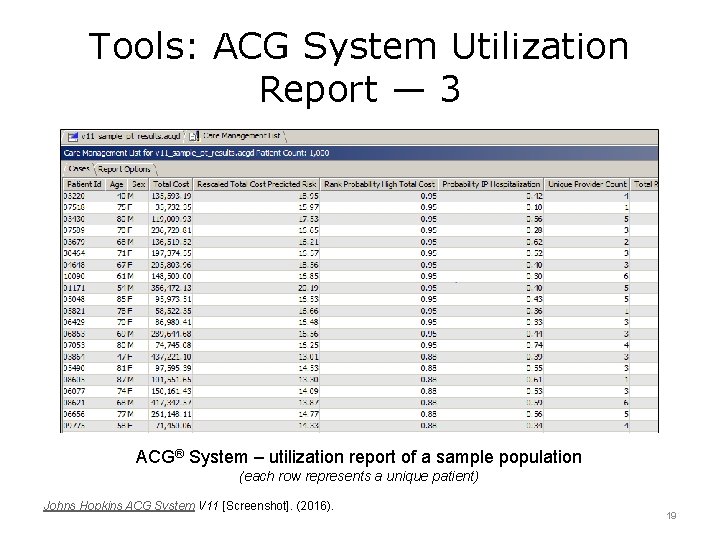
Tools: ACG System Utilization Report — 3 ACG® System – utilization report of a sample population (each row represents a unique patient) Johns Hopkins ACG System V 11 [Screenshot]. (2016). 19
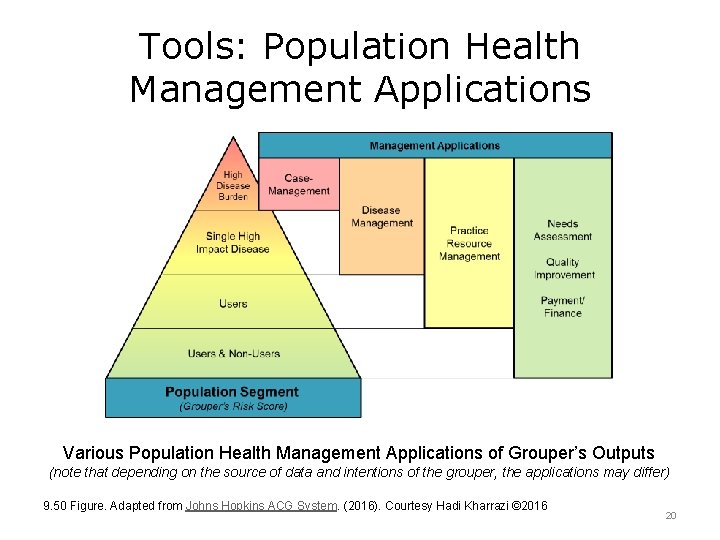
Tools: Population Health Management Applications Various Population Health Management Applications of Grouper’s Outputs (note that depending on the source of data and intentions of the grouper, the applications may differ) 9. 50 Figure. Adapted from Johns Hopkins ACG System. (2016). Courtesy Hadi Kharrazi © 2016 20
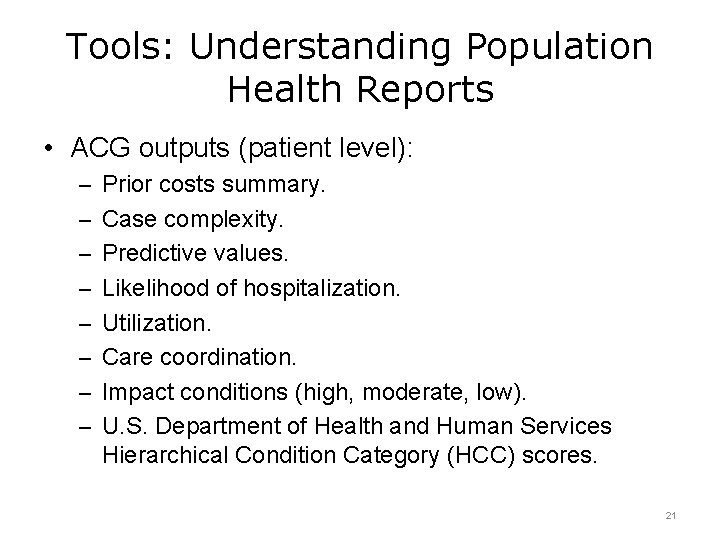
Tools: Understanding Population Health Reports • ACG outputs (patient level): – Prior costs summary. – Case complexity. – Predictive values. – Likelihood of hospitalization. – Utilization. – Care coordination. – Impact conditions (high, moderate, low). – U. S. Department of Health and Human Services Hierarchical Condition Category (HCC) scores. 21
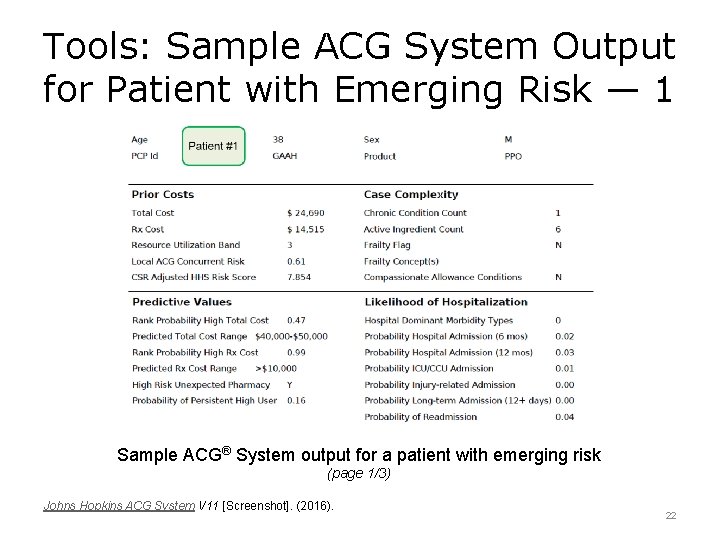
Tools: Sample ACG System Output for Patient with Emerging Risk — 1 Sample ACG® System output for a patient with emerging risk (page 1/3) Johns Hopkins ACG System V 11 [Screenshot]. (2016). 22
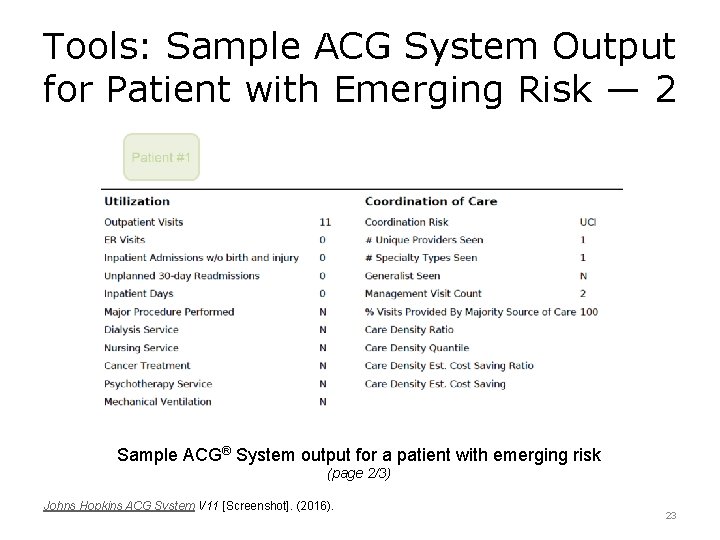
Tools: Sample ACG System Output for Patient with Emerging Risk — 2 Sample ACG® System output for a patient with emerging risk (page 2/3) Johns Hopkins ACG System V 11 [Screenshot]. (2016). 23
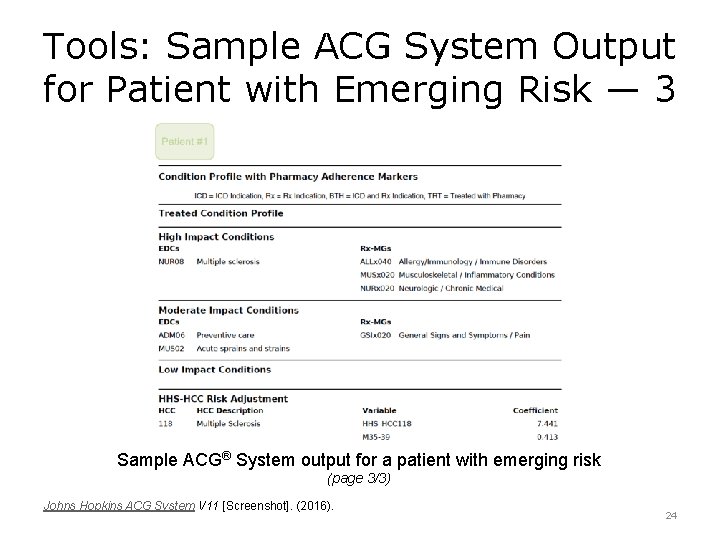
Tools: Sample ACG System Output for Patient with Emerging Risk — 3 Sample ACG® System output for a patient with emerging risk (page 3/3) Johns Hopkins ACG System V 11 [Screenshot]. (2016). 24
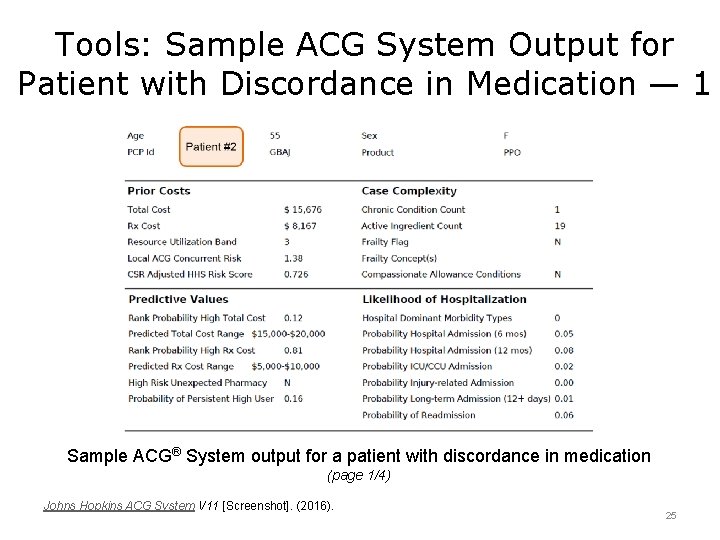
Tools: Sample ACG System Output for Patient with Discordance in Medication — 1 Sample ACG® System output for a patient with discordance in medication (page 1/4) Johns Hopkins ACG System V 11 [Screenshot]. (2016). 25
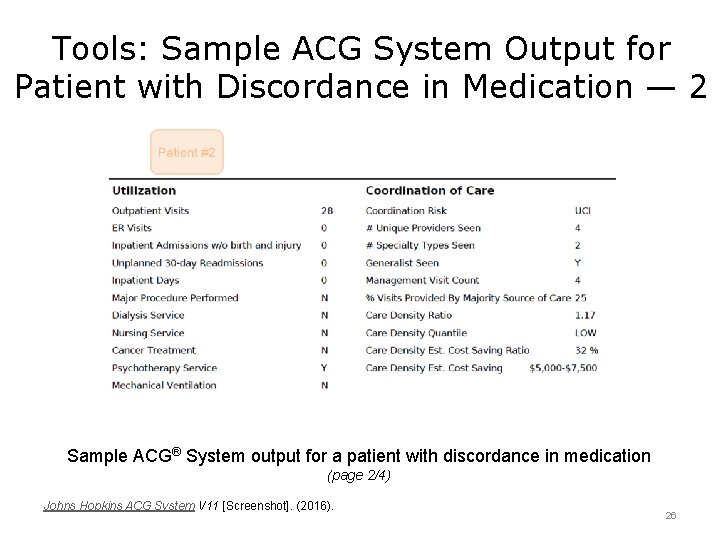
Tools: Sample ACG System Output for Patient with Discordance in Medication — 2 Sample ACG® System output for a patient with discordance in medication (page 2/4) Johns Hopkins ACG System V 11 [Screenshot]. (2016). 26
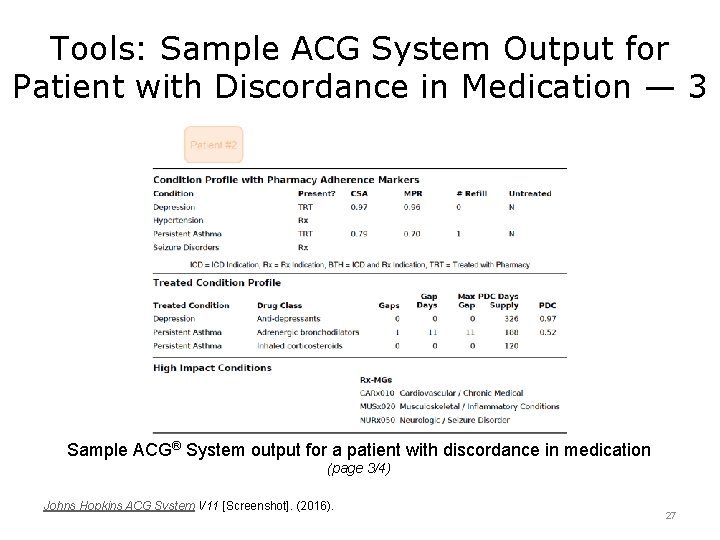
Tools: Sample ACG System Output for Patient with Discordance in Medication — 3 Sample ACG® System output for a patient with discordance in medication (page 3/4) Johns Hopkins ACG System V 11 [Screenshot]. (2016). 27
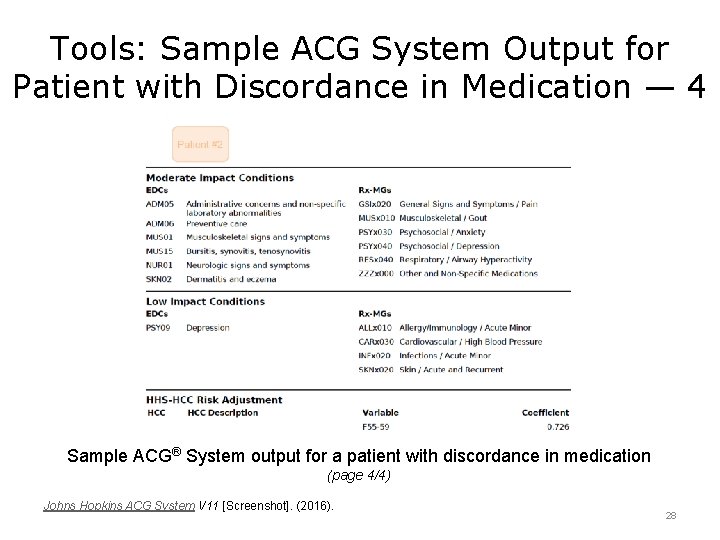
Tools: Sample ACG System Output for Patient with Discordance in Medication — 4 Sample ACG® System output for a patient with discordance in medication (page 4/4) Johns Hopkins ACG System V 11 [Screenshot]. (2016). 28
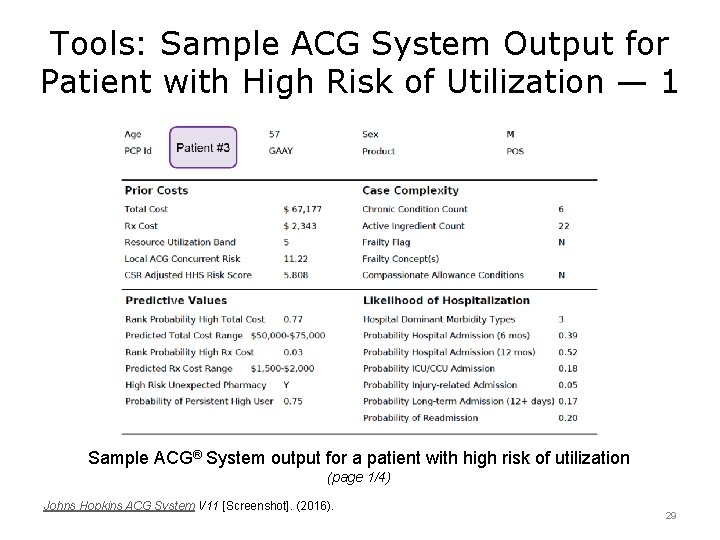
Tools: Sample ACG System Output for Patient with High Risk of Utilization — 1 Sample ACG® System output for a patient with high risk of utilization (page 1/4) Johns Hopkins ACG System V 11 [Screenshot]. (2016). 29
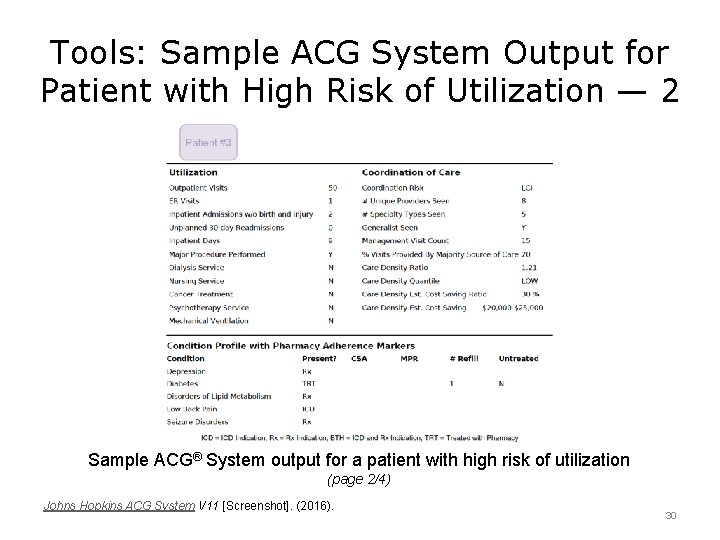
Tools: Sample ACG System Output for Patient with High Risk of Utilization — 2 Sample ACG® System output for a patient with high risk of utilization (page 2/4) Johns Hopkins ACG System V 11 [Screenshot]. (2016). 30
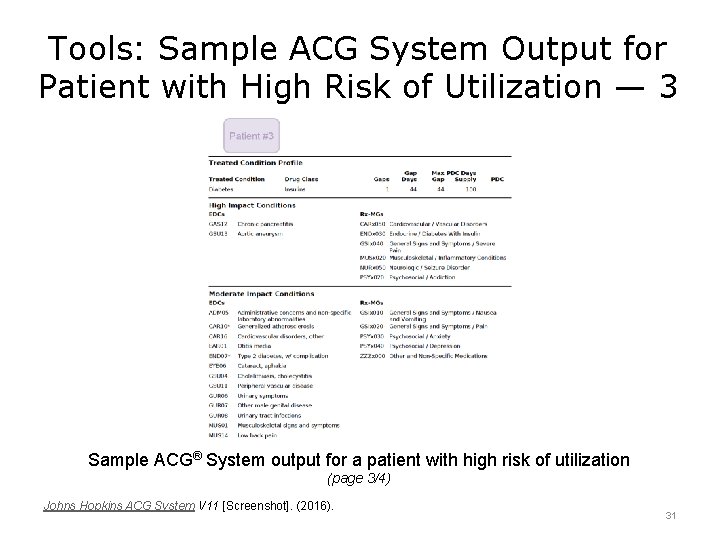
Tools: Sample ACG System Output for Patient with High Risk of Utilization — 3 Sample ACG® System output for a patient with high risk of utilization (page 3/4) Johns Hopkins ACG System V 11 [Screenshot]. (2016). 31
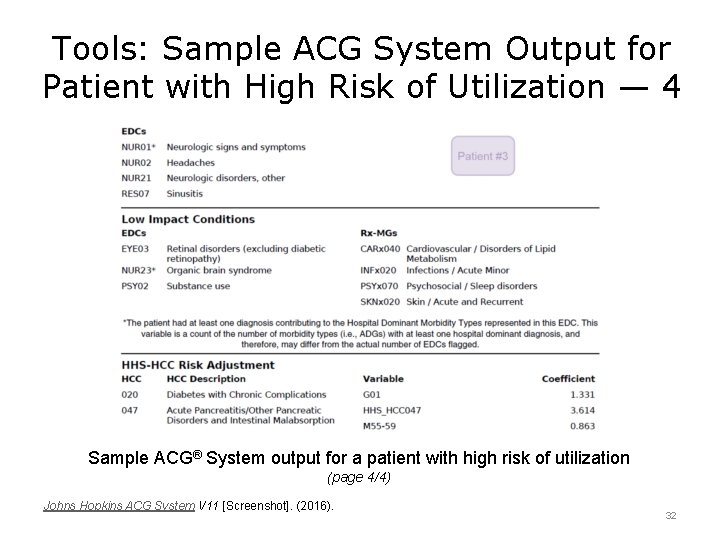
Tools: Sample ACG System Output for Patient with High Risk of Utilization — 4 Sample ACG® System output for a patient with high risk of utilization (page 4/4) Johns Hopkins ACG System V 11 [Screenshot]. (2016). 32
Big Data, Interoperability, and Analytics for Population Health Summary — Lecture d • Tools: – Spreadsheets. – Statistical packages. – Data mining applications. – Specialized population health analytic tools. – Understanding the population health reports. • See the standalone data analytic component for details. 33
Big Data, Interoperability, and Analytics for Population Health References — Lecture d — 1 References Charlson, M. E. , Pompei, P. , Ales, K. L. , & Mac. Kenzie, C. R. (1987). A new method of classifying prognostic comorbidity in longitudinal studies: Development and validation. Journal of Chronic Diseases, 40(5), 373– 383. Retrieved April 25, 2016, from http: //webap. cmu. edu. tw/Tch. Eportfolio/ckeditor/ckfinder/files/prognostic%20 comorbidi ty%20 in%20 longitudinal%20 studies. pdf Duncan, I. (2011). Healthcare risk adjustment and predictive modeling. Winsted, CT: ACTEX Publications, Inc. Johns Hopkins ACG System. (2016). Retrieved January 12, 2016, from http: //acg. jhsph. org/ Machine Learning Group at the University of Waikato. (2016). Weka. Retrieved January 12, 2016, from www. cs. waikato. ac. nz/ml/weka/ Rapid. Miner. (2016). Retrieved January 12, 2016, from https: //rapidminer. com RStudio. (2016). Retrieved January 12, 2016, from https: //www. rstudio. com/ University of Manitoba. (2016). Concept: Charlson Comorbidity Index. Retrieved April 25, 2016, from http: //mchpappserv. cpe. umanitoba. ca/view. Concept. php? printer=Y&concept. ID=1098 34
Big Data, Interoperability, and Analytics for Population Health References — Lecture d — 2 Charts, Tables, Figures 9. 47 Figure: The overall process of population health analytics. Kharrazi, H. (2016). Bloomberg School of Public Health, Johns Hopkins University. 9. 48 Table: Population health risk analytic groupers/stratifiers. Kharrazi, H. (2016). Bloomberg School of Public Health, Johns Hopkins University. Adapted from Duncan, I. (2011). Healthcare risk adjustment and predictive modeling. Winsted, CT: ACTEX Publications, Inc. 9. 49 Figure: ACG grouping concept and use in predictive modeling. Kharrazi, H. (2016). Bloomberg School of Public Health, Johns Hopkins University. Adapted from Johns Hopkins ACG System. (2016). Retrieved January 12, 2016, from http: //acg. jhsph. org/ 9. 50 Figure: Various population health management applications of grouper’s outputs. Kharrazi, H. (2016). Bloomberg School of Public Health, Johns Hopkins University. Adapted from Johns Hopkins ACG System. (2016). Retrieved January 12, 2016, from http: //acg. jhsph. org/ Images Slide 6: Open. Office Calc [Screenshot]. (2016). Data from Duncan, I. (2011). Healthcare risk adjustment and predictive modeling. Winsted, CT: ACTEX Publications, Inc. 35
Big Data, Interoperability, and Analytics for Population Health References — Lecture d — 3 Images Slide 8: RStudio application [Screenshot]. (2016). Slide 10: Weka data mining application [Screenshots]. (2016). Machine Learning Group at the University of Waikato. Slide 11: Rapid. Miner application [Screenshot]. (2016). Slide 15: ACG System interface — showing health system summary [Screenshot]. Johns Hopkins ACG System. (2016). Slide 16: ACG System sample output [Screenshot]. Johns Hopkins ACG System. (2016). Slide 17: ACG System — utilization report of an entire health clinic, page 1/2 [Screenshot]. Johns Hopkins ACG System. (2016). Slide 18: ACG System — utilization report of an entire health clinic, page 2/2 [Screenshot]. Johns Hopkins ACG System. (2016). Bloomberg School of Public Health, Johns Hopkins University. Slide 19: ACG System — utilization report of a sample population [Screenshot]. Johns Hopkins ACG System (2016). Bloomberg School of Public Health, Johns Hopkins University. 36
Big Data, Interoperability, and Analytics for Population Health References — Lecture d — 4 Images Slide 22: Sample ACG System output for a patient with emerging risk, page 1/3 [Screenshot]. Johns Hopkins ACG System (2016). Bloomberg School of Public Health, Johns Hopkins University. Slide 23: Sample ACG System output for a patient with emerging risk, page 2/3 [Screenshot]. Johns Hopkins ACG System (2016). Bloomberg School of Public Health, Johns Hopkins University. Slide 24: Sample ACG System output for a patient with emerging risk, page 3/3 [Screenshot]. Johns Hopkins ACG System (2016). Bloomberg School of Public Health, Johns Hopkins University. Slide 25: Sample ACG System output for a patient with discordance in medication, page 1/4 [Screenshot]. Johns Hopkins ACG System (2016). Bloomberg School of Public Health, Johns Hopkins University. Slide 26: Sample ACG System output for a patient with discordance in medication, page 2/4 [Screenshot]. Johns Hopkins ACG System (2016). Bloomberg School of Public Health, Johns Hopkins University. 37
Big Data, Interoperability, and Analytics for Population Health References — Lecture d — 5 Charts, Tables, Figures Slide 27: Sample ACG System output for a patient with discordance in medication, page 3/4 [Screenshot]. Johns Hopkins ACG System (2016). Bloomberg School of Public Health, Johns Hopkins University. Slide 28: Sample ACG System output for a patient with discordance in medication, page 4/4 [Screenshot]. Johns Hopkins ACG System (2016). Bloomberg School of Public Health, Johns Hopkins University. Slide 29: Sample ACG System output for a patient with high risk of utilization, page 1/4 [Screenshot]. Johns Hopkins ACG System (2016). Bloomberg School of Public Health, Johns Hopkins University. Slide 30: Sample ACG System output for a patient with high risk of utilization, page 2/4 [Screenshot]. Johns Hopkins ACG System (2016). Bloomberg School of Public Health, Johns Hopkins University. Slide 31: Sample ACG System output for a patient with high risk of utilization, page 3/4 [Screenshot]. Johns Hopkins ACG System (2016). Bloomberg School of Public Health, Johns Hopkins University. Slide 32: Sample ACG System output for a patient with high risk of utilization, page 4/4 [Screenshot]. Johns Hopkins ACG System (2016). Bloomberg School of Public 38 Health, Johns Hopkins University.
Population Health Big Data, Interoperability, and Analytics for Population Health Lecture d This material (Comp 21 Unit 9) was developed by Johns Hopkins University, funded by the Department of Health and Human Services, Office of the National Coordinator for Health Information Technology under Award Number 90 WT 0005. 39
- Slides: 39