Population Growth Key Concepts Factors affecting human population


 per capita is the amount of goods and services")


 have lower illiteracy rates than least developed countries (LDC). Illiteracy")


 Inadequate health care for")


- Slides: 60
Population Growth: Key Concepts Ø Factors affecting human population size Ø Human population problems Ø Managing population growth Fecundity is the maximum potential of a population to reproduce
What is demography? Demography: is the study of the size, composition, distribution of human population and the causes and consequences of changes. • How many people live where? • How long are you expected to live? • How many children are you likely to have
A dispersed population distribution is when a population is evenly distributed across an area. This is especially common in rural farming areas. The opposite is concentrated distribution, in which people are closely grouped in an urban area
Factors Affecting Human Population Size Ø Population change equation Population Change = (Births + Immigration) – (Deaths + Emigration) Ø Crude birth rate (BR): per 1, 000 Ø Crude death rate (DR): per 1, 000
The gross national product (gnp) per capita is the amount of goods and services produced by a country in one year divided by the amount of people living in the country
Average crude birth and death rates for various countries in 2004.
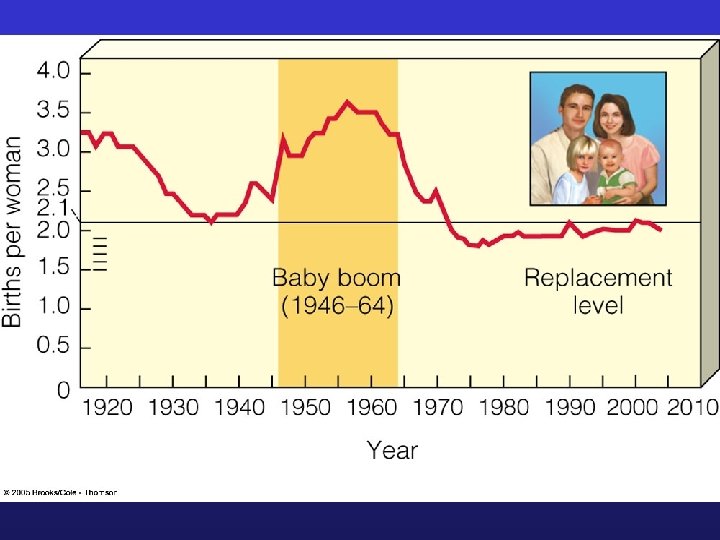
A guest worker is someone who leaves her or his country to work in another country without the intent to settle permanently. Typically, the labor is physical, and young people are best suited for the work U. S. Birth Rates: 1910 -2004 Births per thousand population End of World War II 32 30 28 26 24 22 20 18 16 14 0 Demographic transition 1910 1920 Depression 1930 1940 Baby boom 1950 1960 Year Baby bust 1970 Echo baby boom 1980 1990 2000 2010
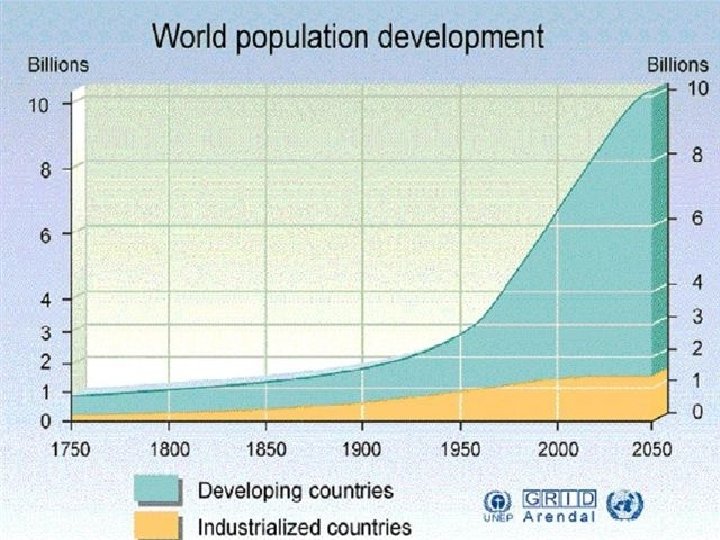
How fast is the world’s population growing? • Birth rates and death rates coming down (death more quickly) • 219, 000 more daily (97% in developing countries) • 80 Million per year • Exponential growth 1. 25% down from 2. 2% in 1963
The world’s 10 most populous countries • China and India 37% of world 8 Billion people by 2050
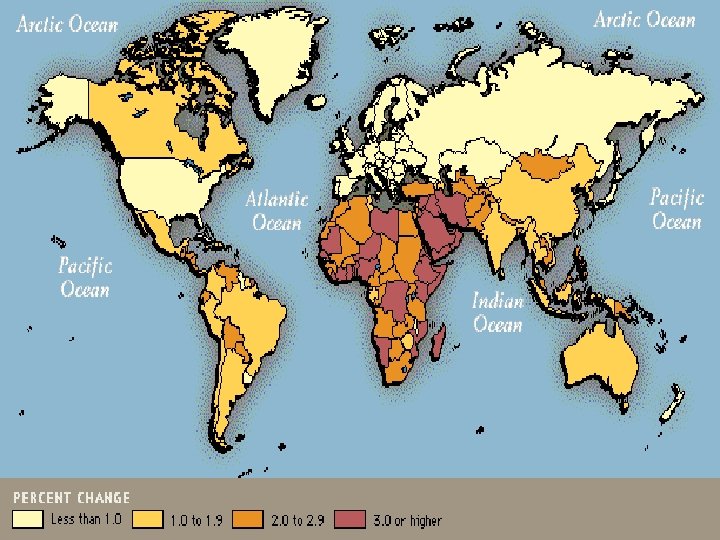
Describing Population Changes The rule of 70 is an approximation of the doubling time for a population. For any population growing at a constant rate, divide 70 by the annual growth rate to determine the approximate amount of time it will take for the population to double Doubling time: time in years it takes world to double…. RULE OF 70 70/ percent changing 70/1. 25 = 56 years to double Africa growing at 2. 8%. . . how long to double?
A choropleth map uses different colors to represent varying quantities in defined areas, such as states or countries. The quantities can represent percentages, densities, or rates
Describing Population Changes ØFertility: number of births that occur to an individual woman. ØReplacement-level Fertility: the number of children a couple must have to replace themselves. 2. 1 developed countries, 2. 5 in developing countries ØTotal Fertility Rate (TFR): the average number of children a woman typically has during reproductive years. Global Avg. = 2. 8 (1. 5 in developed, 3. 1 developing down from 2. 5 and 6. 5 in 1950)
Fertility rates for various countries.
Standard of living indicates the wealth and material goods available to each person in a country. Developed countries enjoy higher standards of living than developing countries; therefore, standard of living can indicate the level of development in a country UN World Population Projections assuming TFR of 2. 5 high, 2. 0 medium and 1. 5 low
How Have Fertility and Birth Rates Changed In the U. S. 1900: 76 million 2006: 300 million • Post WW II Baby Boom, 1946 to 1964 added 79 million TFR reached 3. 7 • 2004: 2. 9 million added 59% due to more births/deaths the rest from immigration • Projected: 2050, 420 million and 2100, 571 million
A J-curve suggests that population projections indicate exponential growth. The population line mimics the shape of the letter J, where population growth is initially slow then increases dramatically
U. S. Population Estimates
Comparing U. S. , Mexico and Canada
The Demographic Transition Fig. 10 -20 p. 189 Stage 2 Transindustrial Stage 3 Industrial Stage 4 Postindustrial High 80 70 Relative population size Birth rate and death rate (number per 1, 000 per year) Stage 1 Preindustrial 60 50 Birth rate 40 30 Death rate 20 10 0 Total population Low Increasing Growth Very high Decreasing Low Zero growth rate growth rate Time Low Negative growth rate
Major changes that took place in the U. S. 1900 - 2000
Factors Affecting Birth Rates and Total Fertility Rates Ø Children in Labor Force Ø Cost of raising and educating children Ø Availability of pension systems Ø Urbanization Ø Education and employment for women Ø Infant mortality rate Ø Average marrying age Ø Abortion Ø Availability of birth control
Most developed countries (MDC) have lower illiteracy rates than least developed countries (LDC). Illiteracy is defined as not being able to read or write. LDC are categorized by the United Nations based on socioeconomic development such as gross national income, health, education, nutrition, and economic vulnerability
Effectiveness of typical types of birth control.
Factors Affecting Death Rates Ø Life expectancy: the average number of years a newborn is expected to live. Ø Infant mortality rate (IMR): number of babies per 1, 000 that die before 1 st birthday.
Life expectancy 1955 to 2004: Increased 48 years to 67 years (76 in developed world, 65 in developing) U. S. 77 years and projected 82 by 2050 Poorest countries of Africa only 49 years
Life expectancy • Increased food supplies • Better nutrition • Advances in medical field (vaccines, antibiotics) • Advances in sanitation • Safe water supplies
Infant Mortality Infant mortality is viewed as the single measure of a society’s quality of life…health care and nutrition 1965 to 2004: drop 20/1000 to 7/1000 and 118/1000 to 61/1000 in developing world U. S. 1900: 165/1000 to 2004: 7/1000
Infant Mortality 3 Factors Keep U. S. IM High: 1) Inadequate health care for poor and pregnant woman. 2) Drug Addiction among pregnant woman 3) High teen birth rate
U. S. Immigration • What do you think environmental impacts of immigration to U. S. might be?
Legal immigration to the U. S. from 1820 to 2001. 1989: large increase due to Act passed by Congress
Section 2: Population Age Structure Key Ideas • What are age structure diagrams? How can you use them? • What are some effect of population decline from reduced fertility? • What are some effects of population decline due to rises in death rates?
How does age structure afect population? • The number of people under age 15 is a major factor in determining future population. • 33% developing world • 17% developed world 1. 9 billion set to enter reproductive age
Population Age Structure Male Female Rapid Growth Guatemala Nigeria Saudi Arabia Ages 0 -14 Slow Growth United States Australia Canada Ages 15 -44 Zero Growth Spain Austria Greece Negative Growth Germany Bulgaria Sweden Ages 45 -85+ Fig. 10 -14 p. 184
U. S. Population by age 1900, 2000, and 2050 projected
Population structure by age and sex in developed and developing countries.
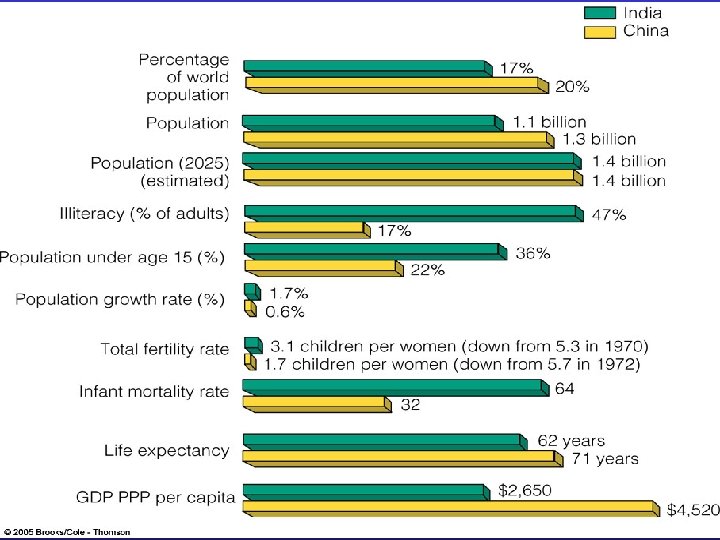
Comparison of key demographic indicators in 2004 for 3 countries…one highly developed, one moderately developed and one less developed.
Tracking the baby-boom generation in the U. S.
What are some impacts of population decline from reduced fertility? • 40 Countries Populations Stabilized or Declining (growth rates below 0. 3%) all in EU Expect Japan • UN Project by 2050 most developed countries (not U. S. ) • Mean more of population shift to elderly
What are some impacts of population decline from reduced fertility? Impacts Social and Economic of this decline: • Large elderly population • Increased medical costs • Less people in workforce • More stress on fewer taxpayers • Labor Shortages • All lead to political changes
What are some impacts of population from rise in death rates? AIDS to cause premature deaths of 278 million from 2000 to 2050 (almost equal to U. S. population)…mostly in Africa • Remove productive workers • Increase in orphans
Global Aging
Section 3: Solutions Key Ideas • What are the advantages and disadvantages of reducing births? • How can economic development help reduce birth rates? • How can family planning help reduce birth rates and abortion rates and save lives? • How can empowering woman help reduce birth rates?
What are advantages and disadvantages of reducing births: Controversy Can the world’s resources support an additional 2. 5 billion by 2050? • Is the Earth overpopulated? • Carrying capacity • If yes, what should b done? What is a sustainable population?
What are advantages and disadvantages of reducing births No Need to Reduce Population • Life spans increasing • People free to have as many kids as want • Slowing population growth = economic decline. • Increased technology will provide answers. Yes, we must reduce population • Basic human needs of people not being met • Larger population = larger human ecological footprint • Resources being used up rapidly
How can economic development reduce birth rates? History indicates that as countries become economically developed, their birth and death rates line. This happens in 4 stages: 1) Preindustrial 2) Transitional 3) Industrial 4) Postindustrial Look up these stages (pg 188) for HW
How can economic development reduce birth rates? Transition countries may get caught: • HIV/AIDS • Too much debt • Lack of skilled workers • Less economic assistance • Not enough or too much decrease in population
How can family planning reduce birth rates? Family planning has been a major factor in reducing the number of birth and abortions around the world. • Provides educational and clinical services to help couples choose how many children they want
How can family planning reduce birth rates? • Responsible for a 55% drop in TFRs in developing countries from 6 in 1960 to 3. 1 in 2004. Still 42% of pregnancies unplanned and 26% aborted.
How can empowering women reduce birth rates? Women tend to have fewer kids if they are educated, have a paying job outside the home, an do not have their human rights suppressed. Why do you think that is?
Typical workday for women in rural Africa…how does it compare to your average day?
Solutions: Influencing Population Size Ø Migration Ø Environmental refugees Ø Reducing births Ø Family planning Ø Empowerment of women Ø Economic rewards and penalties
Section 4: Case Study: Slowing Population Growth in India Generally disappointing results: Ø Poor planning Ø Bureaucratic inefficiency Ø Low status of women Ø Extreme poverty Ø Lack of support
Case Study: Slowing Population Growth in China Ø Economic incentives Ø Free medical care Ø Preferential treatment Ø Locally administered Ø Very intrusive and coercive
Section 5: Cutting Global Population Growth Ø Family planning Ø Improve health care Ø Elevate the status of women Ø Increase education Ø Involve men in parenting Ø Reduce poverty Ø Sustainability