Population Growth Curves and Mechanisms Species and Population


")


 before environmental resistance factors kick in to reduce population")

 Balance between environmental resistance and biotic potential")


/10 = Rate of Increase in")


- Slides: 53
Population Growth Curves and Mechanisms
Species and Population • Organism • Species: genetically similar organisms that reproduce • Population: all members of a species in an area
Characteristics of populations: Same species living in same area
Age structure: –Prereproductive –Reproductive –Postreproductive
• What limits population growth?
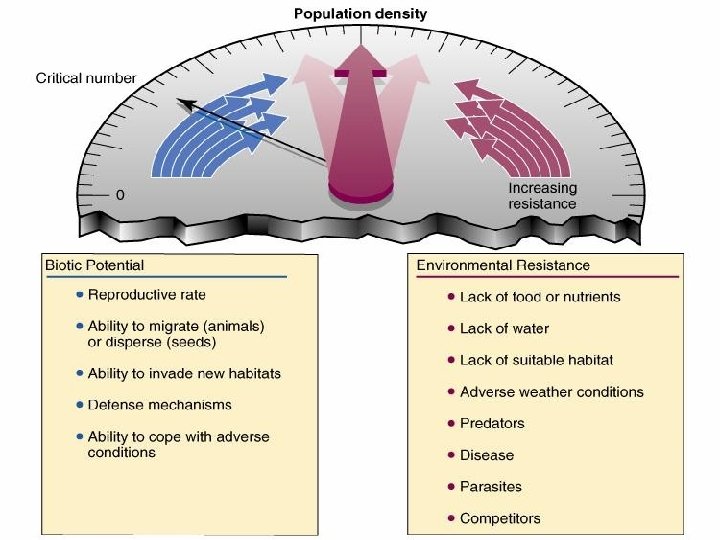
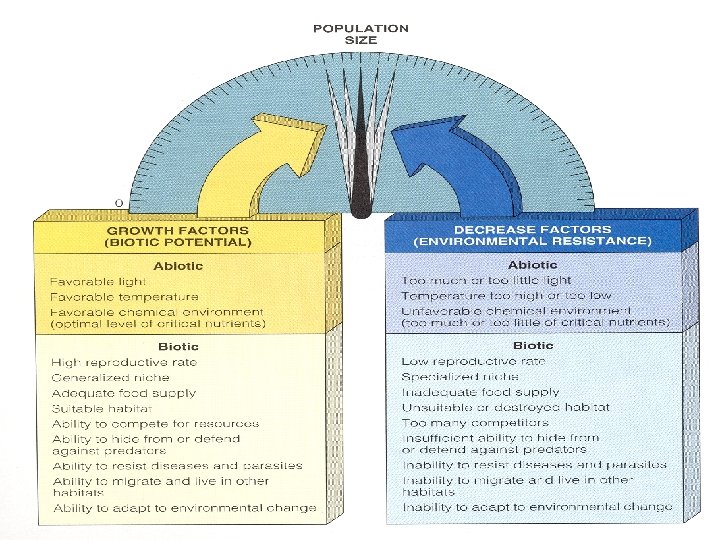
Biotic Potential vs. Environmental Resistance
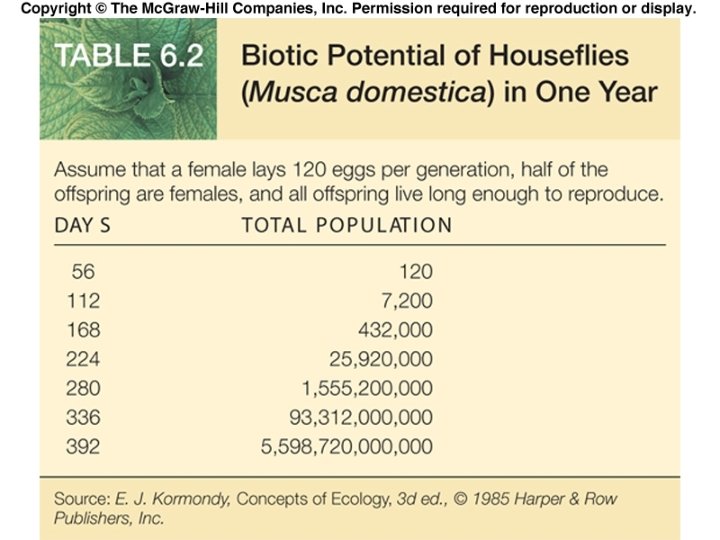
Biotic Potential an organism’s maximum reproductive rate, provided: • unlimited resources are available (food, water, shelter, etc. ) • freedom from inhibiting factors (no predators or disease, etc. ) Cunningham, Cunningham and Saigo, “Environmental Science, 8 th ed. ” Mc. Graw Hill, Table 6. 2
• Biotic potential – capacity for growth • Intrinsic rate of increase (r)
• Environmental Resistance – Biotic and Abiotic factors limiting population size
• Recruitment - ability to survive environmental resistance and become part of the breeding population
• Reproductive strategies • High biotic potential and low recruitment • Low biotic potential and high recruitment
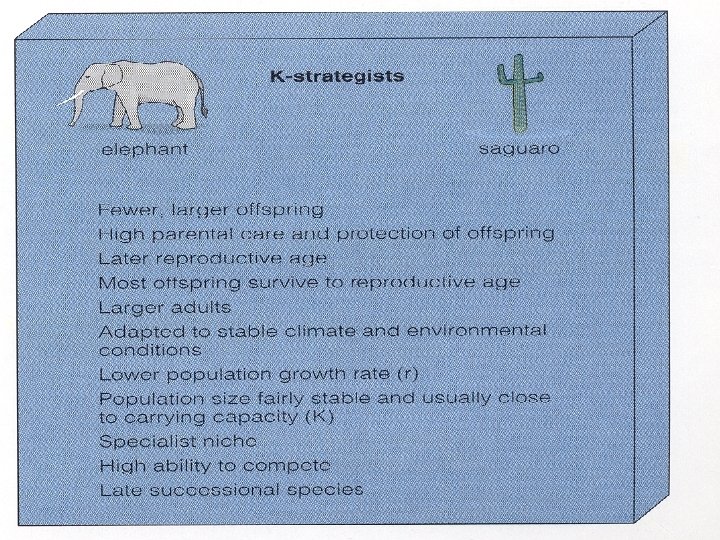
r - strategists K – strategists
• Transparency
R strategists: • Many small offspring • Little /no parental care • Early reproductive age • Most offspring die • Small adults • High growth rate (r) • Population fluctuates wildly above and below carrying capacity (K) • Generalist niche • Low ability to compete • Early successional species
K strategists: • Fewer, larger offspring • High parental care • Later reproductive age • Larger adults • Lower population growth rate (r) • Population size fairly stable and close to carrying capacity (K) • Specialist niche • High ability to compete • Late successional species
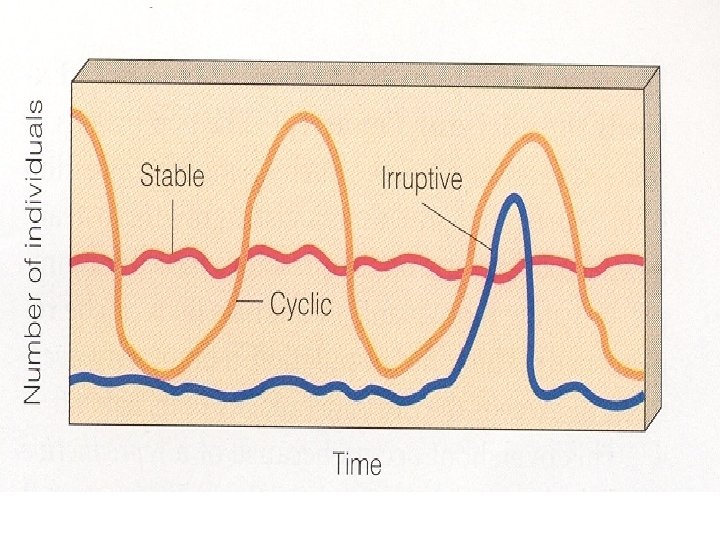
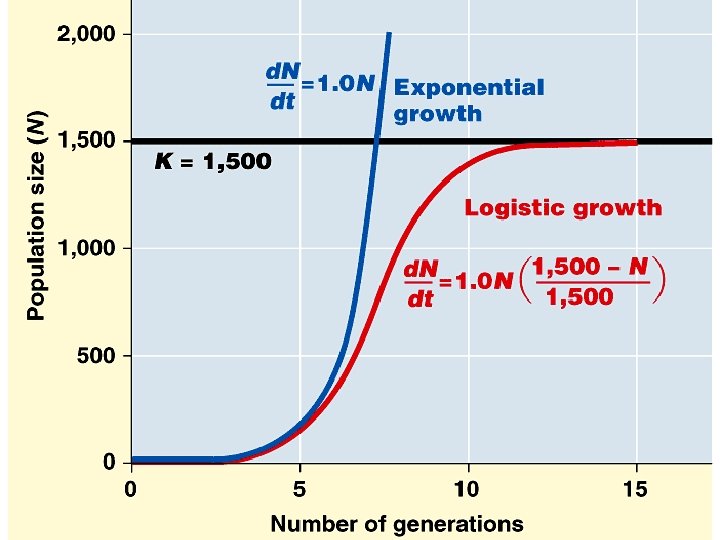
• Growth Curve - Result of biotic potential and environmental resistance.
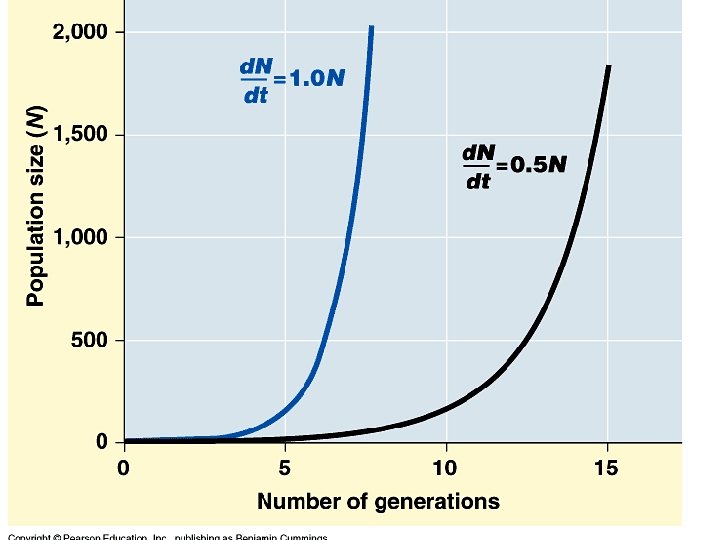
• Exponential growth (J-curve) before environmental resistance factors kick in to reduce population size
• Population explosion
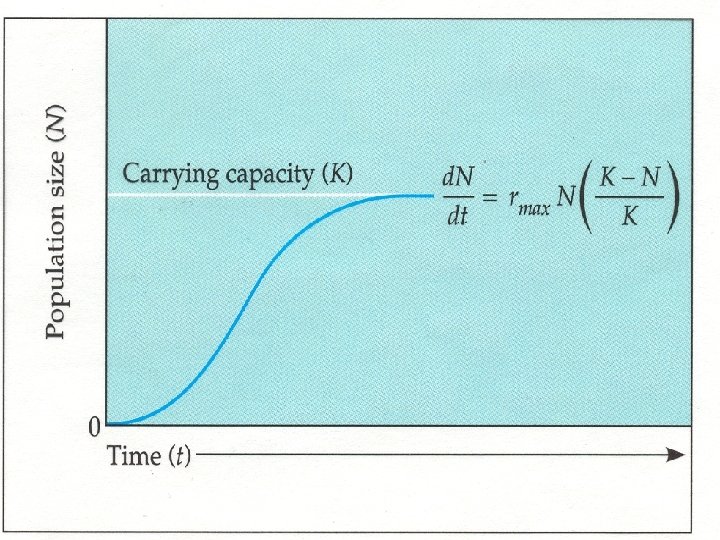
• Logistic growth (S - curve) Balance between environmental resistance and biotic potential
• Carrying Capacity The maximum population a habitat can support without being degraded over the long term.
Population Size Carrying Capacity -maximum # individuals of a given species that the environment can support Time Cunningham, Cunningham and Saigo, “Environmental Science, 8 th ed. ” Mc. Graw Hill, Fig. 6. 4
Carrying Capacity J-curve -maximum # individuals of a given species that the environment can support Cunningham, Cunningham and Saigo, “Environmental Science, 8 th ed. ” Mc. Graw Hill, Fig. 6. 4
• Critical number – minimum population required to provide protection and support for members of population
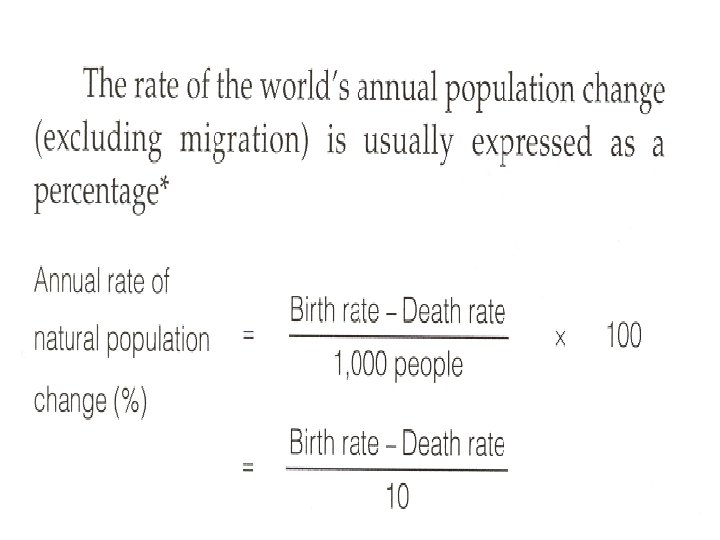
Calculating Fertility Rates and Doubling Times (CBR - CDR)/10 = Rate of Increase in percentage To get r (intrinsic growth rate), divide by 100 70/ Rate of Increase = Doubling Time
• A population had a growth rate of 1. 7 in 2000. In what year would the population be double its current population?
• 70 / 1. 7 = 41 years • 2000 + 41 = 2041
Calculating Fertility Rates and Doubling Times: Practice
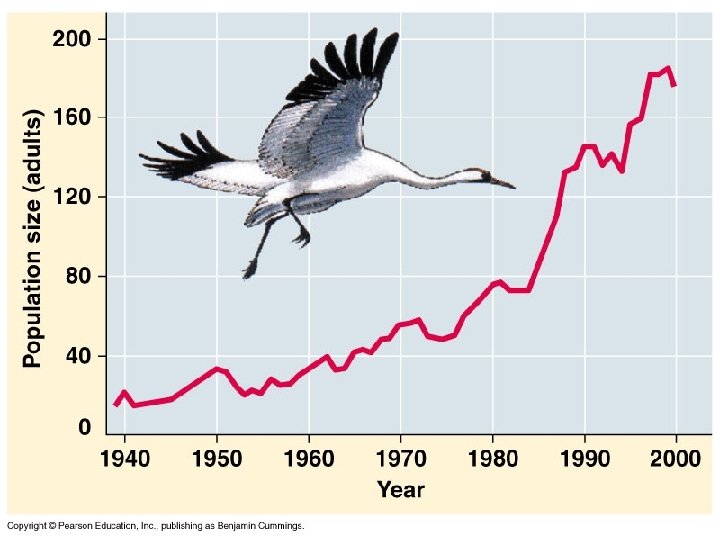
• Threatened – species whose populations are declining rapidly • Endangered – population is near the critical number
Mechanisms of population equilibrium:
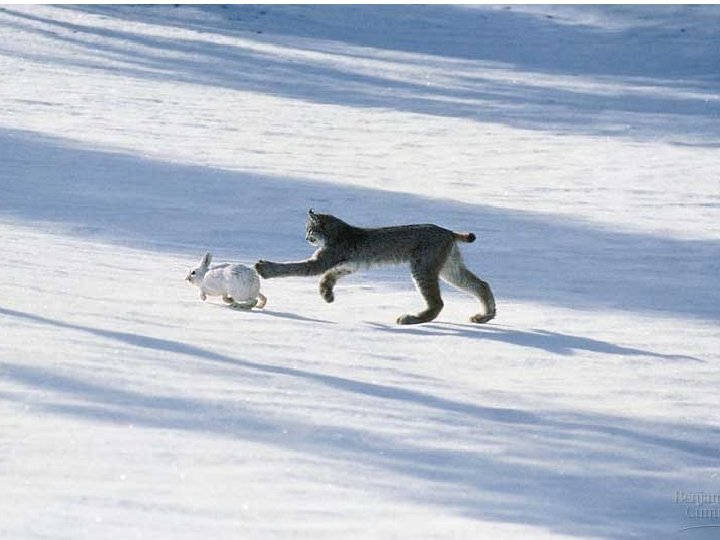
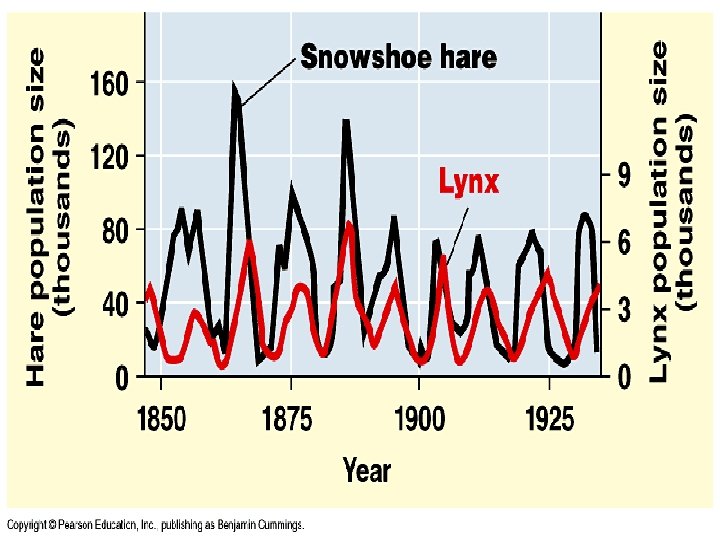
• Predator – prey dynamics
Snowshoe hare Cunningham, Cunningham and Saigo, “Environmental Science, 8 th ed. ” Mc. Graw Hill, Fig. 6. 9
Predator-prey Balance: Wolves and Moose
Isle Royale
Isle Royale • As Wolves decreased Moose increased. • As Wolves increased the Moose decreased. • Wolves kept the Moose population stabilized until canine parvovirus probably killed off large #’s of Wolves. • Moose prospered until overgrazing of Ash and Aspen caused mass death.
Plant Herbivore dynamics: –Herbivores are the natural enemies of plants –Overgrazing
Mechanisms of Population Equilibrium: Plant-Herbivore
Introduced Species: Rabbits in Australia • Introduced into Australia from England in 1859 • No natural enemies – rabbit population exploded • Overabundant herbivore population devastated natural vegetation (see Fig. 4 -11 in text). • Using disease as control measure – why will this procedure fail in the long term?
• Eliminating predators upsets basic plant – herbivore relationships.
• Competition –Interspecific –Intraspecific
• Density dependent factors affecting population growth: –Increasing effect as population increases –Examples • Competition • Disease • Parasites • Stress due to crowding
• Density independent factors controlling population: –affect all populations, regardless of density –Most are abiotic • Forest fires • Floods •