
Population Geography WHERE AND WHY F Distribution of
Population Geography: WHERE AND WHY? F Distribution of World Population F Population Statistics F Population Pyramids F Demographic Transition Theory F Population Control F Overpopulation (Malthus and Neo. Malthusians
3 important things F More people than ever before F World population has increased at a faster rate after 1950’s than ever before F AND almost all population growth is concentrated in less developed countries (LDC’s)
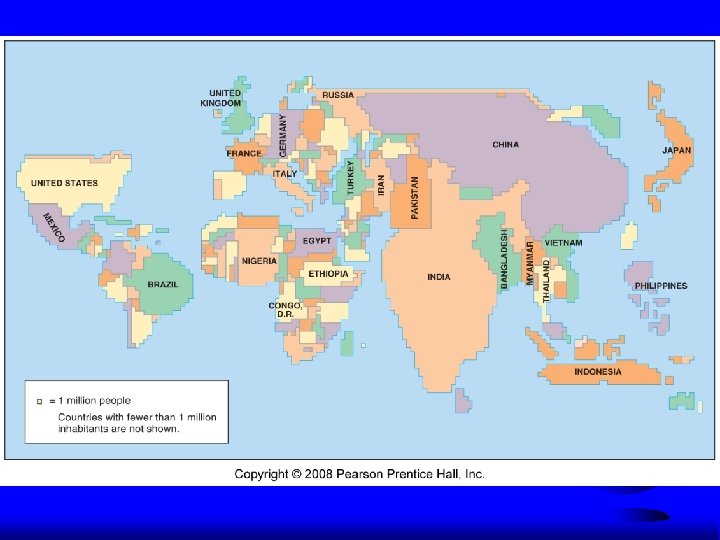

Density F Number land of people occupying an area of – Helps geographers to describe the distribution of people comparison to available resources – Arithmetic and physiological
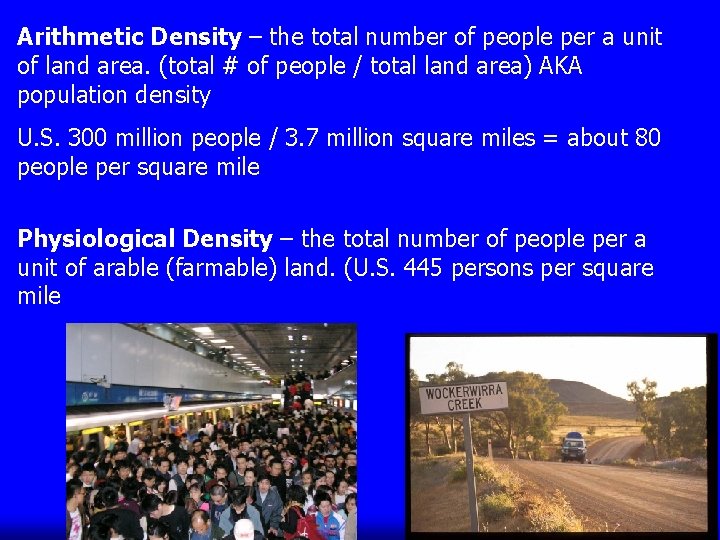
Arithmetic Density – the total number of people per a unit of land area. (total # of people / total land area) AKA population density U. S. 300 million people / 3. 7 million square miles = about 80 people per square mile Physiological Density – the total number of people per a unit of arable (farmable) land. (U. S. 445 persons per square mile
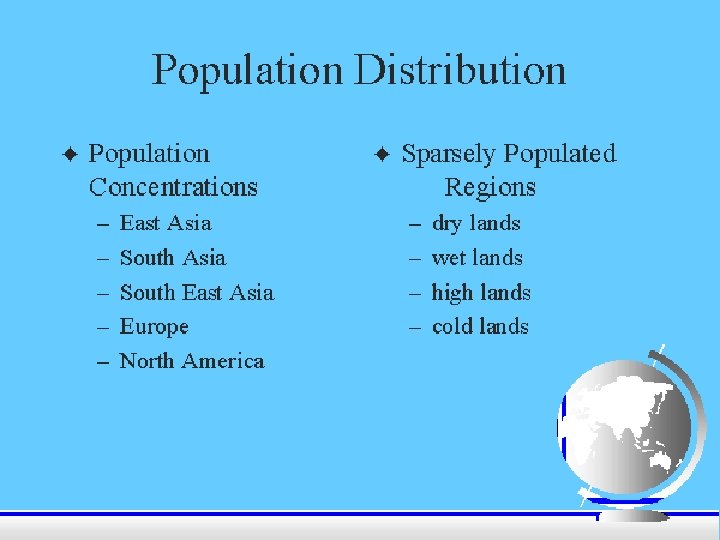
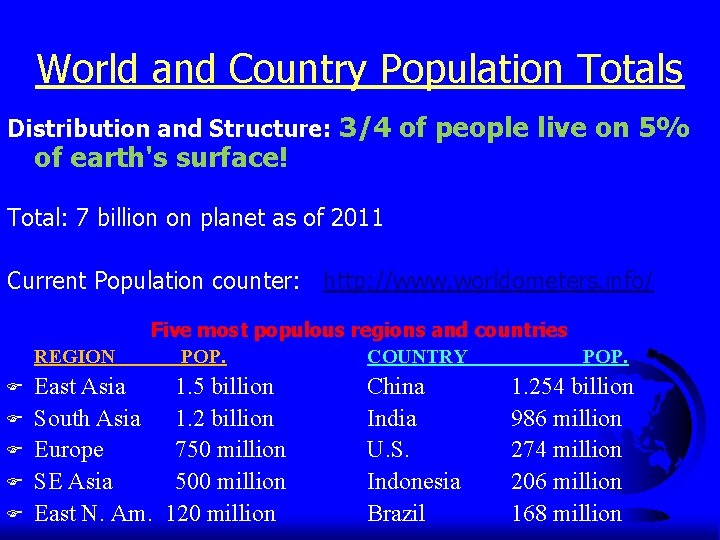
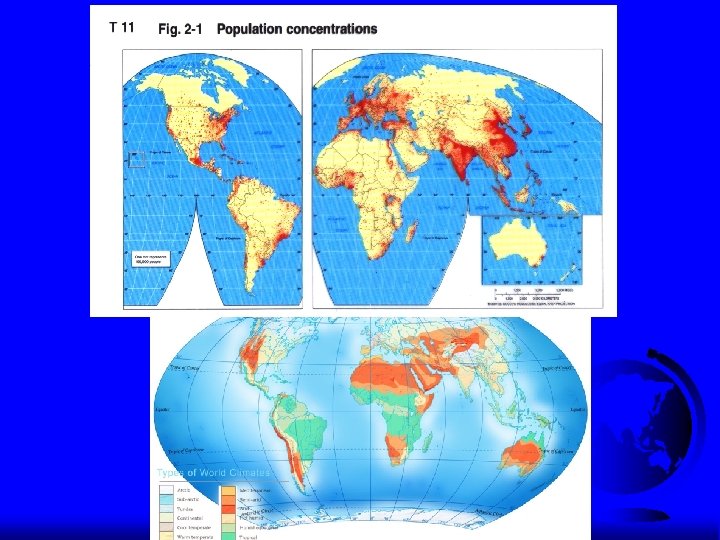
World and Country Population Totals Distribution and Structure: 3/4 of people live on 5% of earth's surface! Total: 7 billion on planet as of 2011 Current Population counter: http: //www. worldometers. info/ REGION F F Five most populous regions and countries POP. COUNTRY POP. East Asia South Asia Europe SE Asia East N. Am. 1. 5 billion 1. 2 billion 750 million 500 million 120 million China India U. S. Indonesia Brazil 1. 254 billion 986 million 274 million 206 million 168 million

Ecumene The “inhabited world!” Ecumene, or portion of the earth’s surface that has permanent human settlement has expanded to cover most of the earth’s land area. Expansion of the Ecumene 5000 BC AD 1900
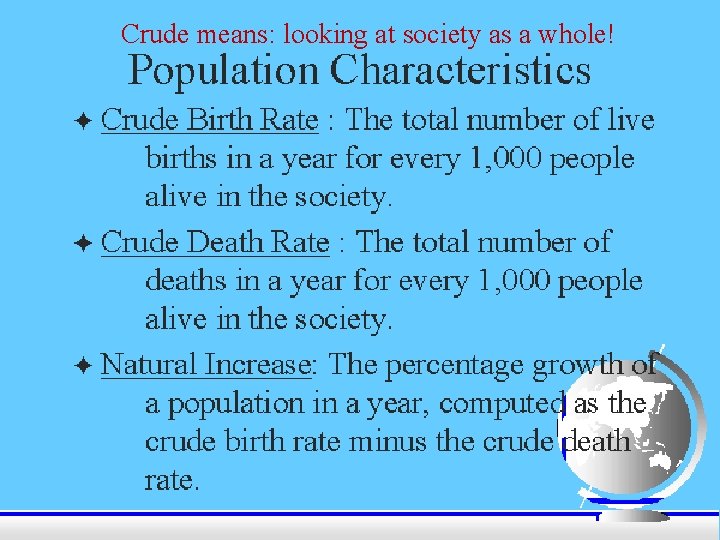
Crude means: looking at society as a whole!
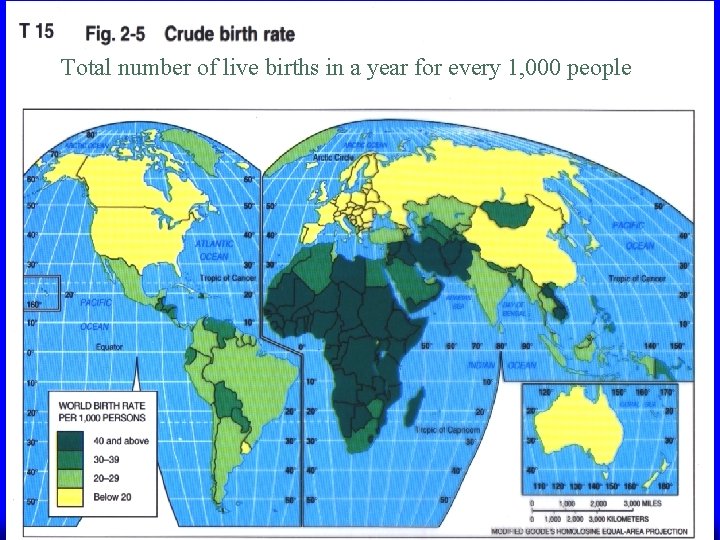
Total number of live births in a year for every 1, 000 people
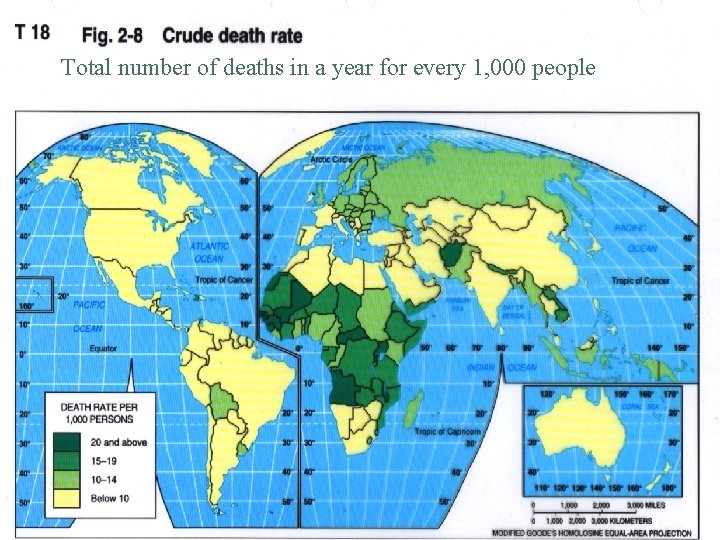
Total number of deaths in a year for every 1, 000 people
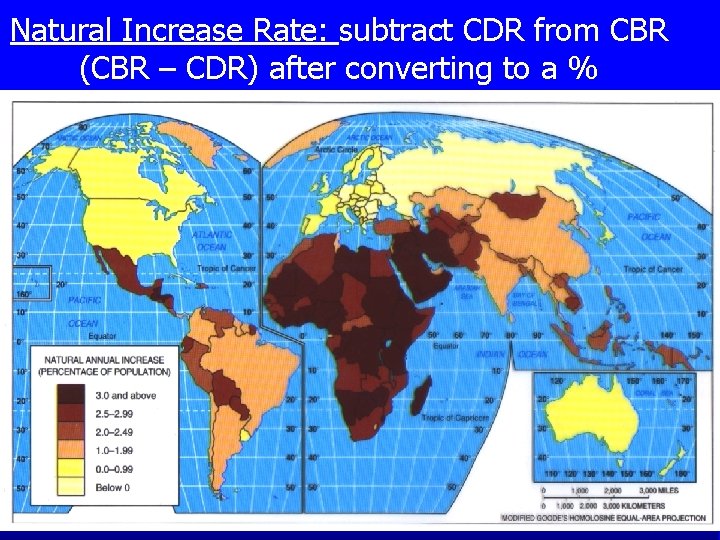
Natural Increase Rate: subtract CDR from CBR (CBR – CDR) after converting to a %
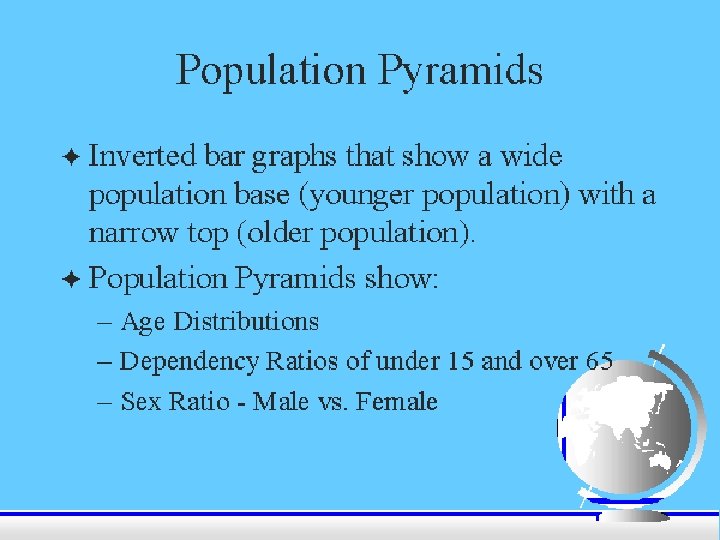
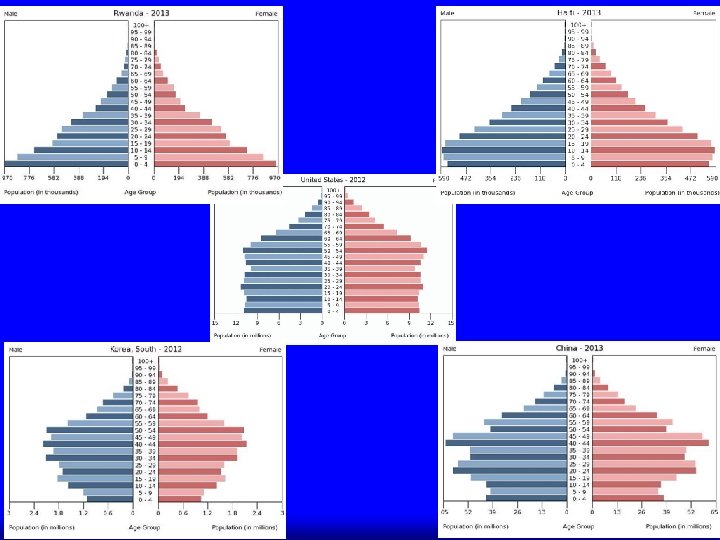
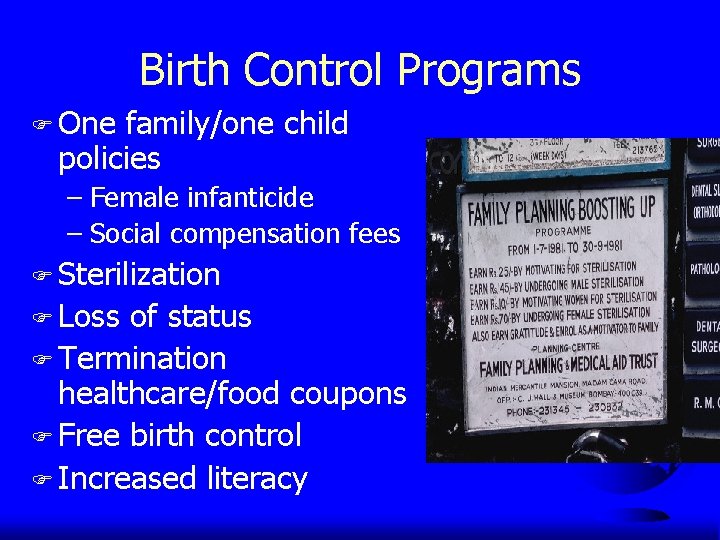
Birth Control Programs F One family/one child policies – Female infanticide – Social compensation fees F Sterilization F Loss of status F Termination healthcare/food coupons F Free birth control F Increased literacy
World Death Rates F Infectious diseases – HIV/AIDS – SARS F Degenerative diseases – Obesity – Tobacco use F Epidemiological transition
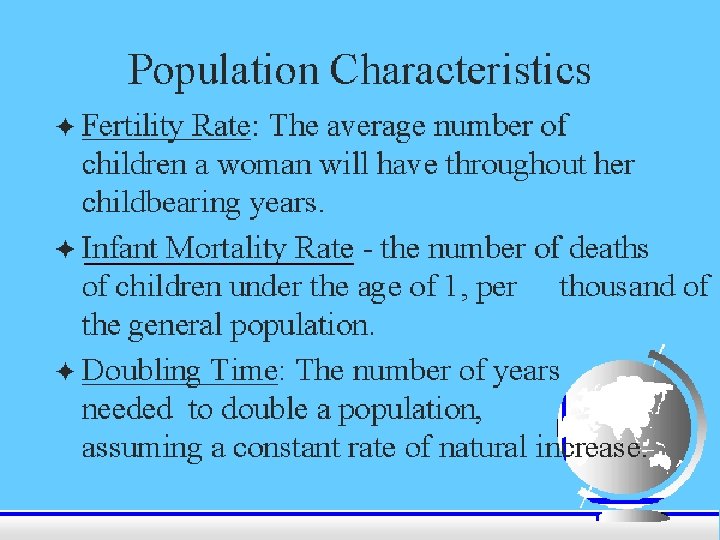
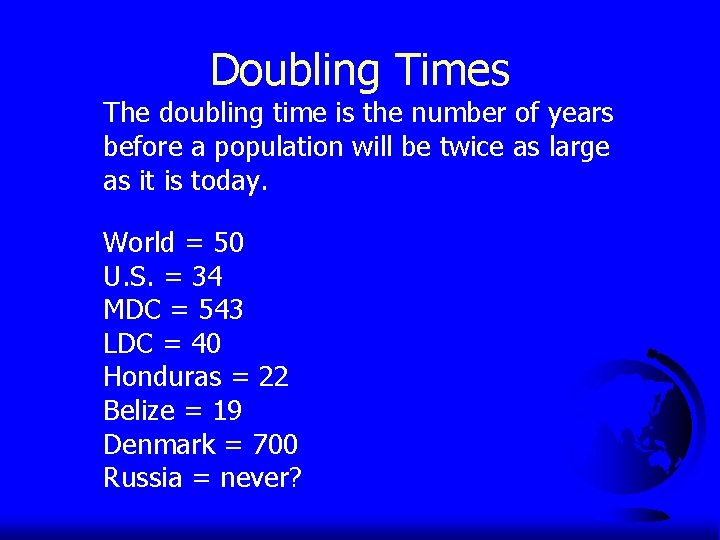
Doubling Times The doubling time is the number of years before a population will be twice as large as it is today. World = 50 U. S. = 34 MDC = 543 LDC = 40 Honduras = 22 Belize = 19 Denmark = 700 Russia = never?
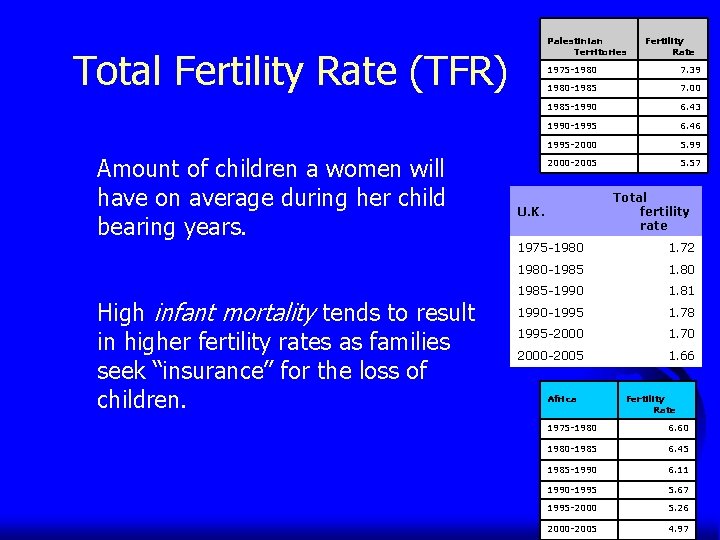
Palestinian Territories Total Fertility Rate (TFR) Amount of children a women will have on average during her child bearing years. High infant mortality tends to result in higher fertility rates as families seek “insurance” for the loss of children. Fertility Rate 1975 -1980 7. 39 1980 -1985 7. 00 1985 -1990 6. 43 1990 -1995 6. 46 1995 -2000 5. 99 2000 -2005 5. 57 Total fertility rate U. K. 1975 -1980 1. 72 1980 -1985 1. 80 1985 -1990 1. 81 1990 -1995 1. 78 1995 -2000 1. 70 2000 -2005 1. 66 Africa Fertility Rate 1975 -1980 6. 60 1980 -1985 6. 45 1985 -1990 6. 11 1990 -1995 5. 67 1995 -2000 5. 26 2000 -2005 4. 97
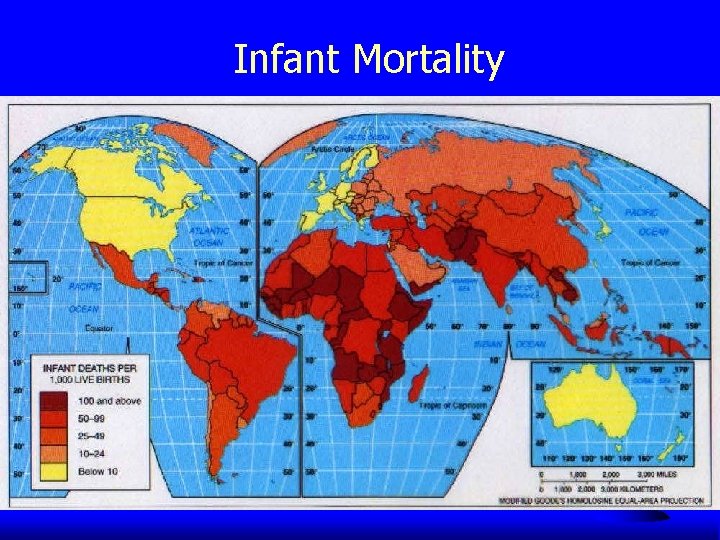
Infant Mortality
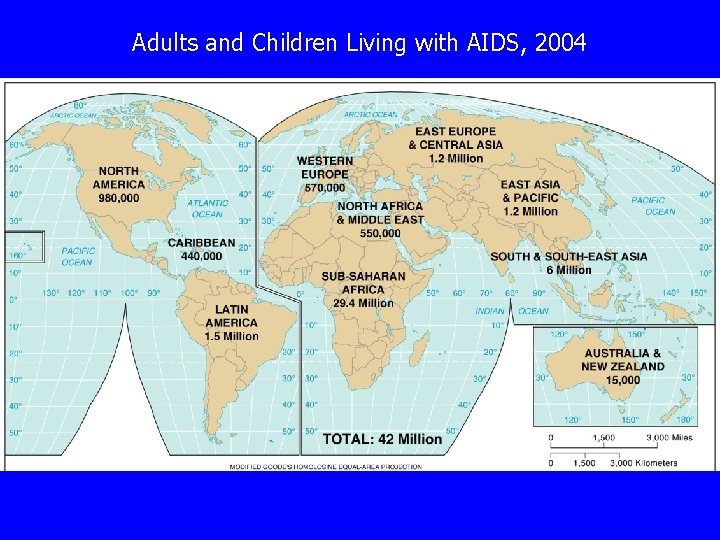
Adults and Children Living with AIDS, 2004
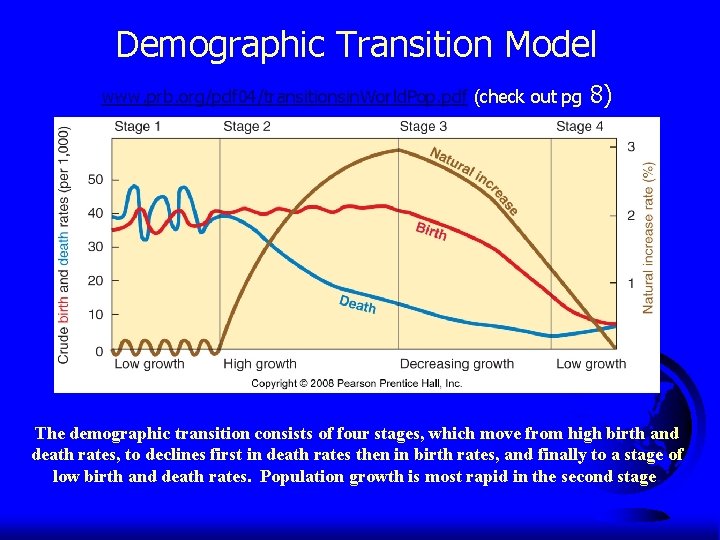
Demographic Transition Model www. prb. org/pdf 04/transitionsin. World. Pop. pdf (check out pg 8) The demographic transition consists of four stages, which move from high birth and death rates, to declines first in death rates then in birth rates, and finally to a stage of low birth and death rates. Population growth is most rapid in the second stage.
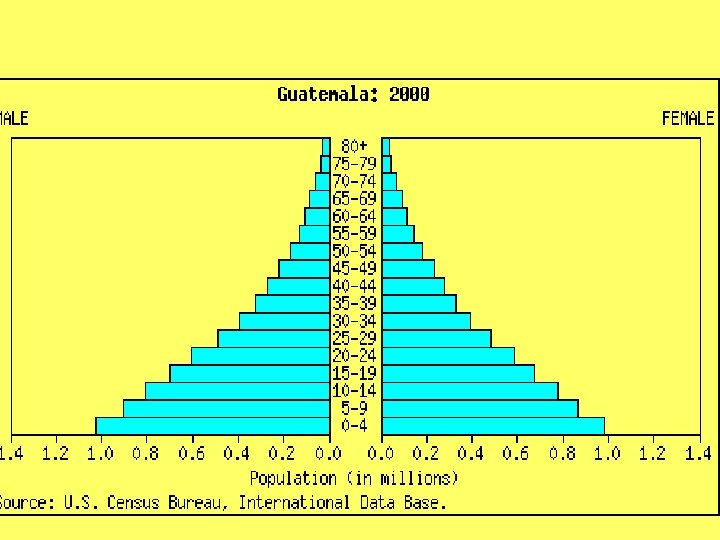
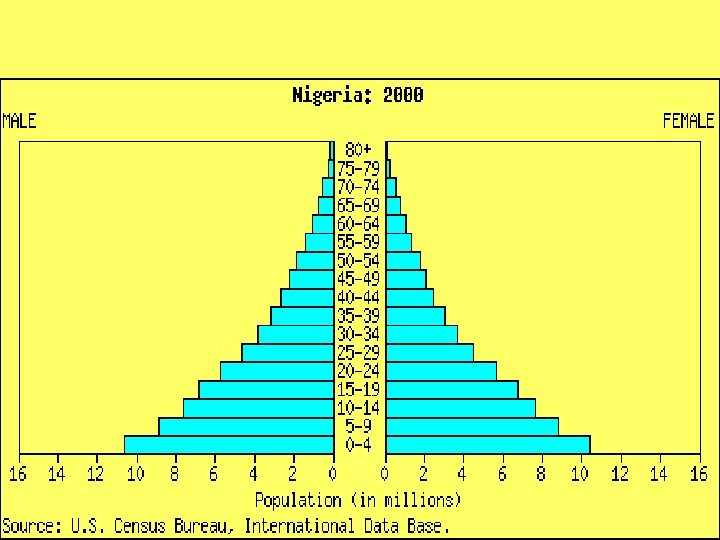
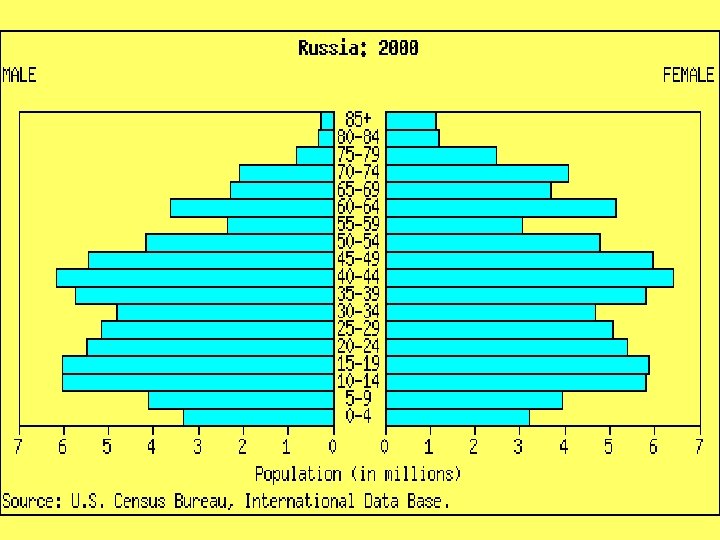
The Demographic Transition F The Demographic Transition – 1. Low growth – 2. High growth F – 3. Moderate growth – 4. Low growth Population pyramids – Age distribution – Sex ratio F Countries in different stages of demographic transition F Demographic transition and world population growth
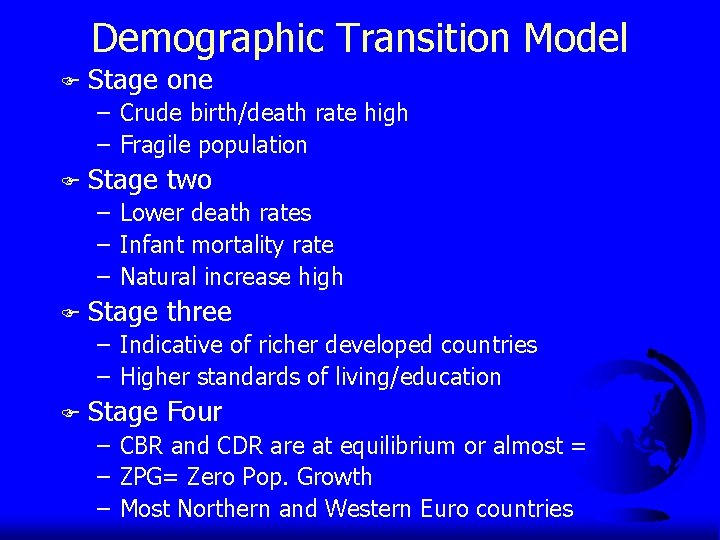
Demographic Transition Model F Stage one – Crude birth/death rate high – Fragile population F Stage two – Lower death rates – Infant mortality rate – Natural increase high F Stage three – Indicative of richer developed countries – Higher standards of living/education F Stage Four – CBR and CDR are at equilibrium or almost = – ZPG= Zero Pop. Growth – Most Northern and Western Euro countries
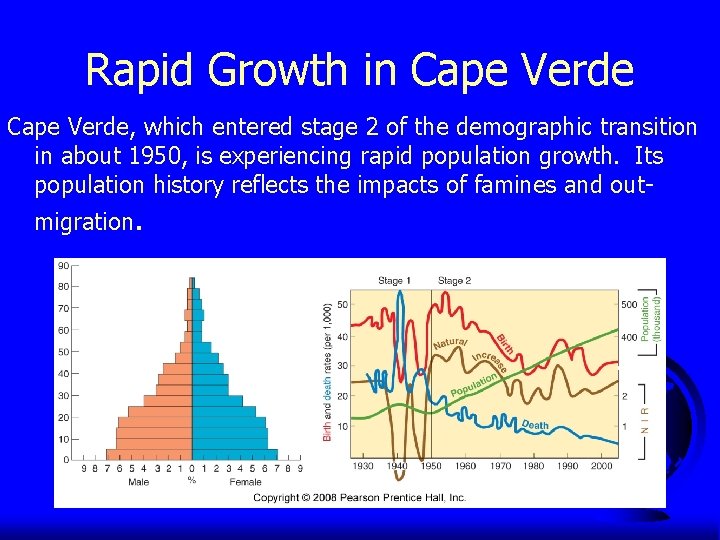
Rapid Growth in Cape Verde, which entered stage 2 of the demographic transition in about 1950, is experiencing rapid population growth. Its population history reflects the impacts of famines and outmigration.

Moderate Growth in Chile entered stage 2 of the demographic transition in the 1930 s, and it entered stage 3 in the 1960 s.
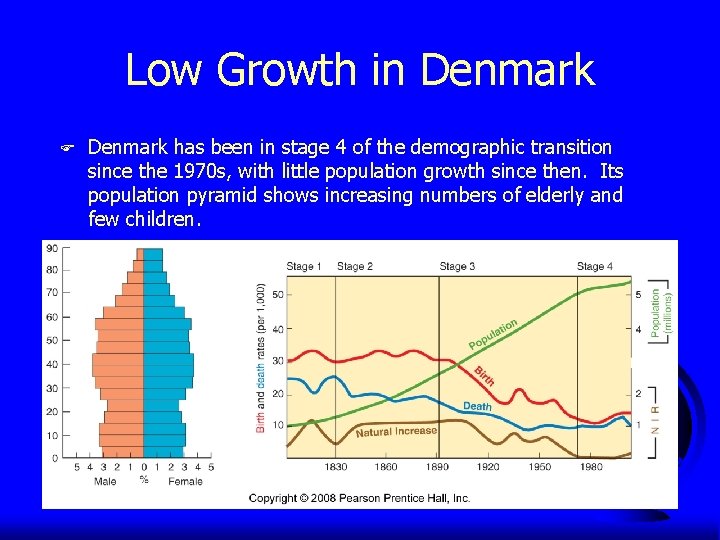
Low Growth in Denmark F Denmark has been in stage 4 of the demographic transition since the 1970 s, with little population growth since then. Its population pyramid shows increasing numbers of elderly and few children.
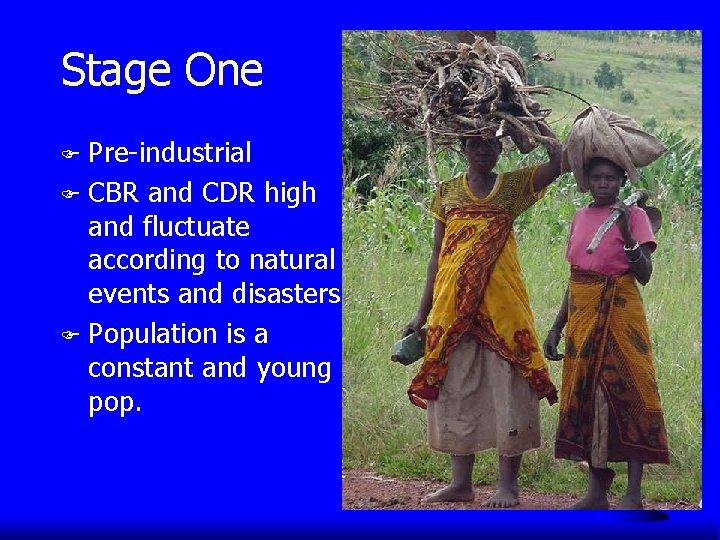
Stage One Pre-industrial F CBR and CDR high and fluctuate according to natural events and disasters. F Population is a constant and young pop. F
Stage Two Death rates drop… improvements in food supply, sanitation, etc. F Birth rates do not drop… causes an imbalance so there is a large increase in population. F
Stage Three F Birth rates fall – Access to contraception – Increase in wages – Urbanization – Move away from subsistence agriculture. – Education of women F Population to level off growth begins
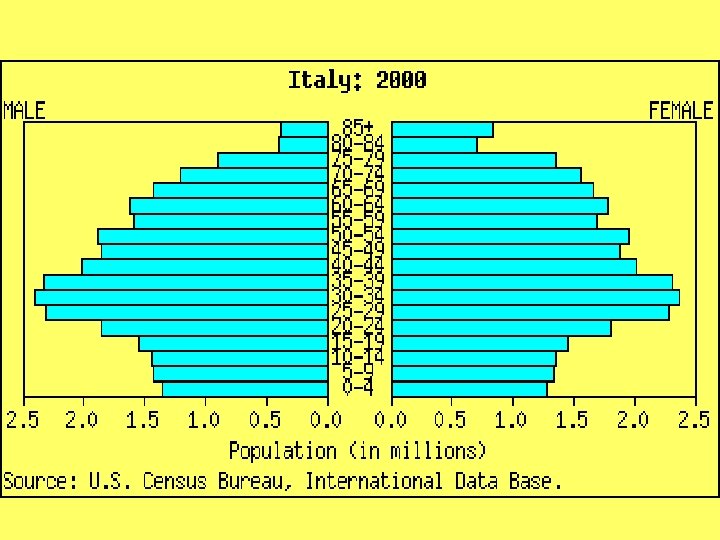
Stage Four Low birth AND low death. F Birth rates may drop below replacement levels (Japan and Italy) which may lead to negative population growth. F Large group born during stage 2 ages… creates a burden on the smaller working population. F
Soooo…. FA cycle in a way from 1 to 4 F Difference= in Stage 1 CBR and CDR are high… in Stage 4 they are low. F Difference= total population of a country is higher in Stage 4 than in Stage 1
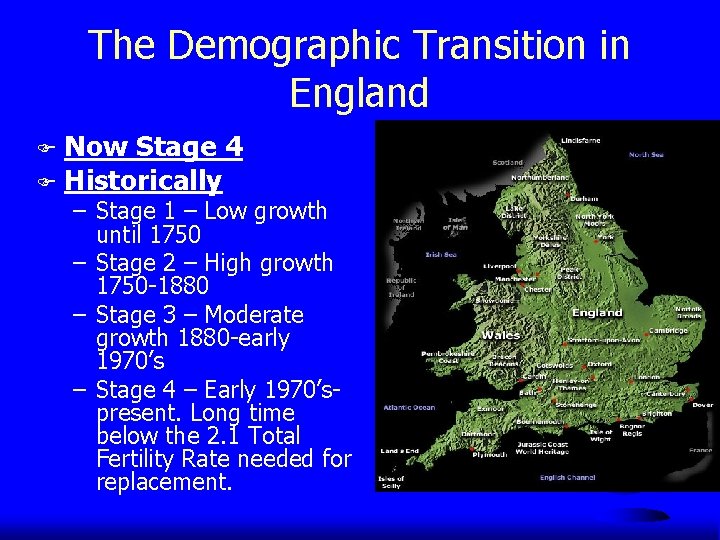
The Demographic Transition in England Now Stage 4 F Historically F – Stage 1 – Low growth until 1750 – Stage 2 – High growth 1750 -1880 – Stage 3 – Moderate growth 1880 -early 1970’s – Stage 4 – Early 1970’spresent. Long time below the 2. 1 Total Fertility Rate needed for replacement.
Problems with the Demographic Transition Model • based on European experience, assumes all countries will progress to complete industrialization • many countries reducing growth rate dramatically without increase in wealth • on the other hand, some countries “stuck” in stage 2 or stage 3 • it is not an exact science!!!! (Possible Stage 5? ? )
Remember… Demographic Transition is not only dependent on CBR and CDR but also on in and out migration!!!!
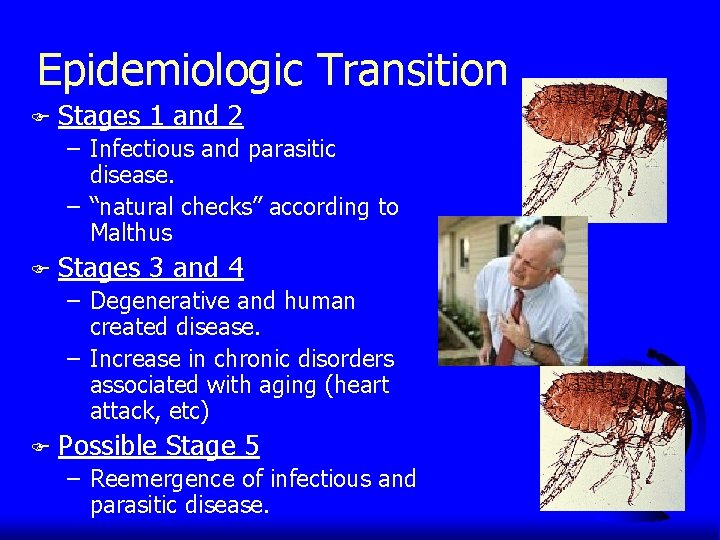
Epidemiologic Transition F Stages 1 and 2 – Infectious and parasitic disease. – “natural checks” according to Malthus F Stages 3 and 4 – Degenerative and human created disease. – Increase in chronic disorders associated with aging (heart attack, etc) F Possible Stage 5 – Reemergence of infectious and parasitic disease.
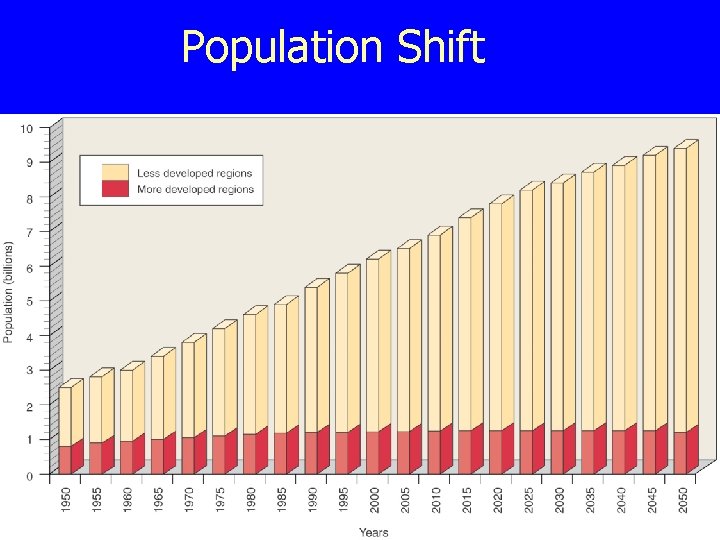
Population Shift
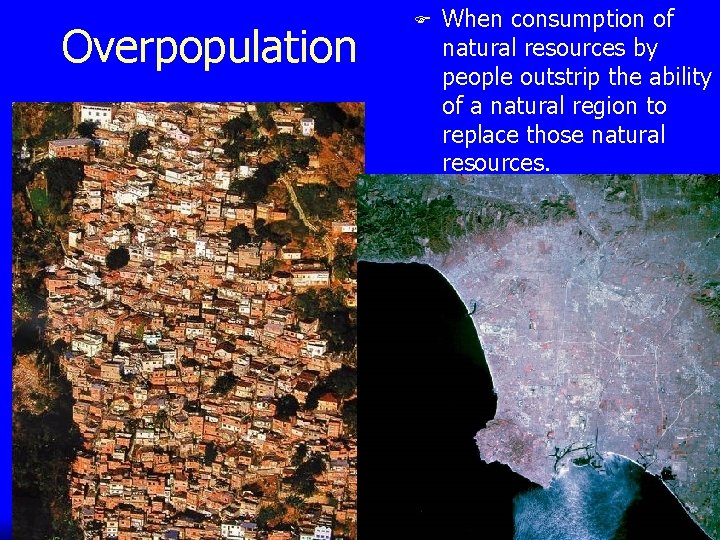
Overpopulation F When consumption of natural resources by people outstrip the ability of a natural region to replace those natural resources.

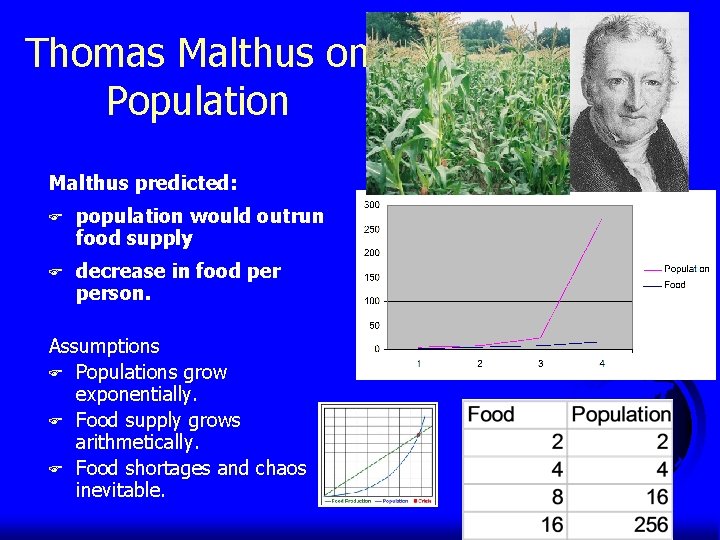
Thomas Malthus on Population Malthus predicted: F population would outrun food supply F decrease in food person. Assumptions F Populations grow exponentially. F Food supply grows arithmetically. F Food shortages and chaos inevitable.
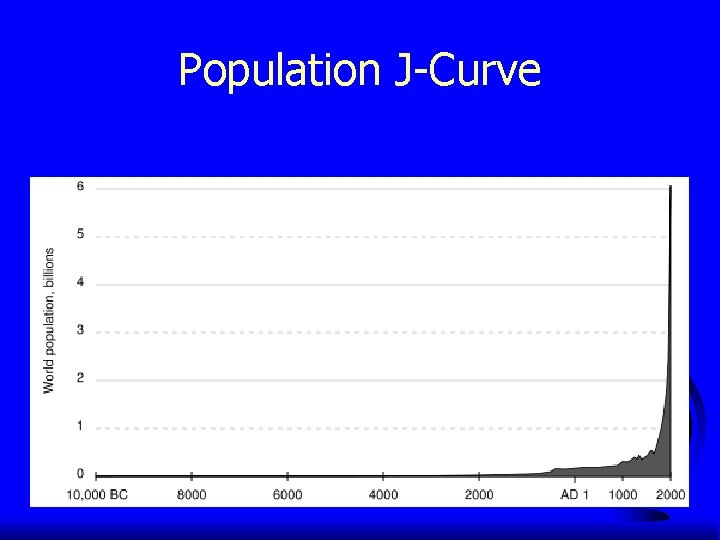
Population J-Curve
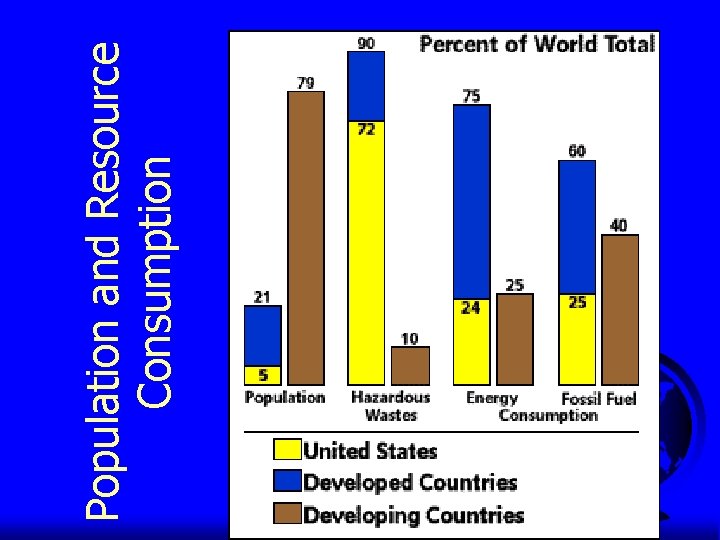
Population and Resource Consumption
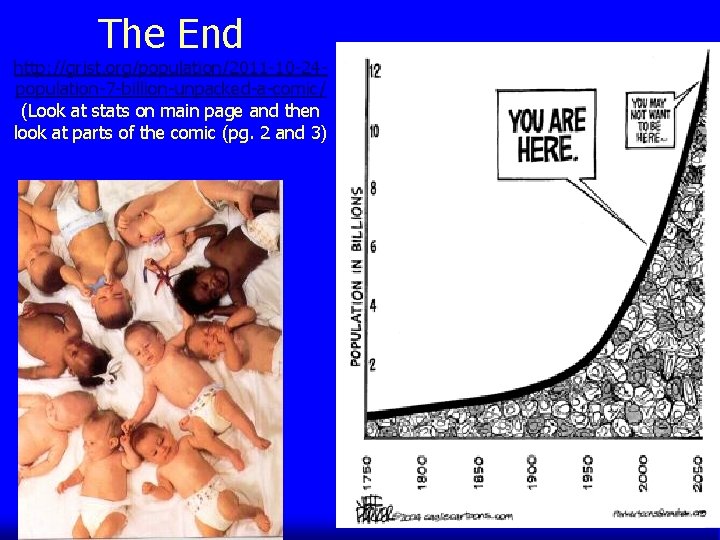
The End http: //grist. org/population/2011 -10 -24 population-7 -billion-unpacked-a-comic/ (Look at stats on main page and then look at parts of the comic (pg. 2 and 3)
- Slides: 50