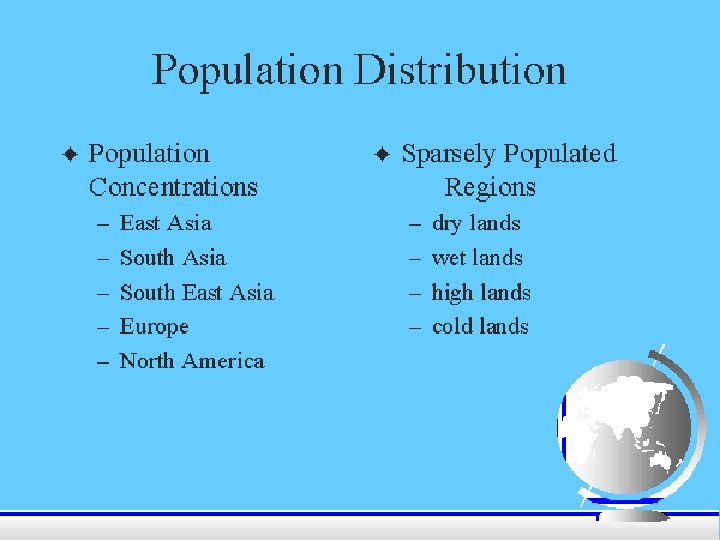
Population Geography F Distribution of World Population F

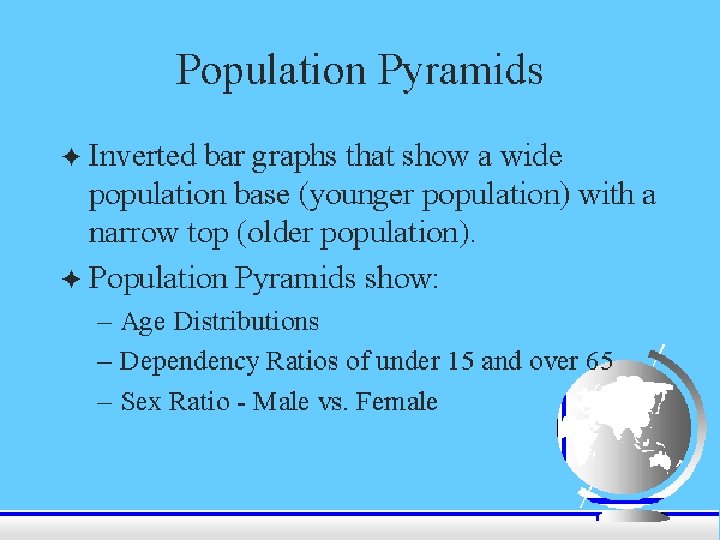
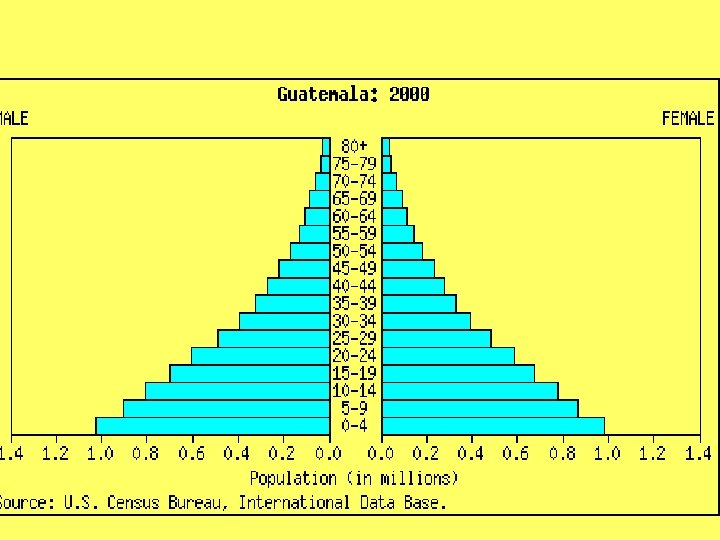
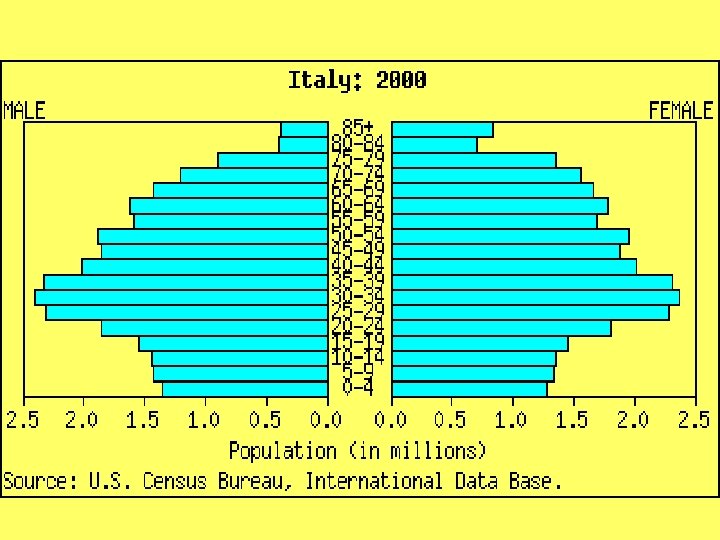
Population Geography F Distribution of World Population F Population Statistics F Population Pyramids F Demographic Transition Theory F Population Control F Overpopulation (Malthus and Neo. Malthusians

Arithmetic Density – the total number of people per a unit of land area. U. S. = 76/mi 2; NYC=1, 000/mi 2; Australia = 7/mi 2 Physiological Density – the total number of people per a unit of arable (farmable) land.


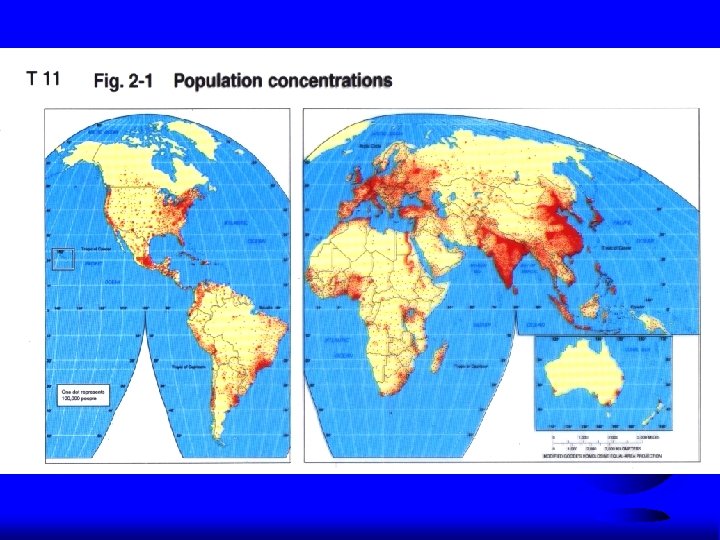
World and Country Population Totals Distribution and Structure: 3/4 of people live on 5% of earth's surface! Total: 6 billion on planet as of Oct. 12, 1999 Current Population Counter Five most populous regions and countries REGION F F F POPULATION COUNTRY East Asia 1. 5 billion South Asia 1. 2 billion Europe 750 million SE Asia 500 million East N. Am. 120 million China India U. S. Indonesia Brazil POPULATION 1. 254 billion 986 million 274 million 206 million 168 million
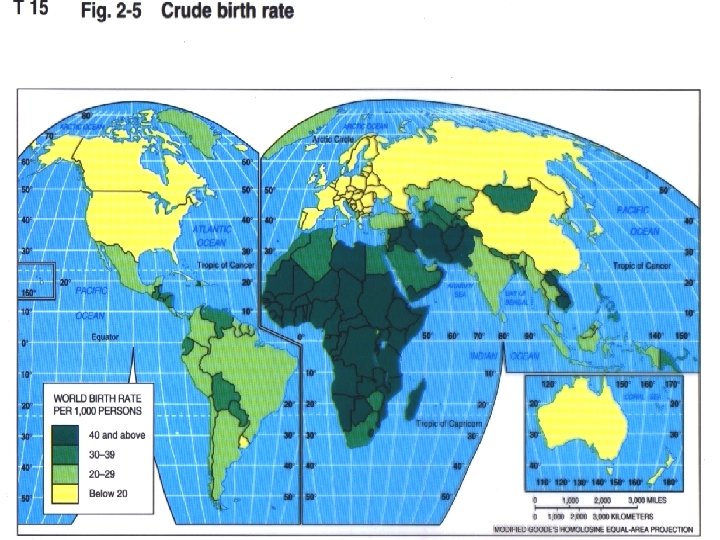

Total Fertility Rate - the average number of children a women will have in her childbearing years. This rate varies from just over 1 (Japan, Italy) to around 7 (Niger, Mali). The U. S. rate is 2. 2. 1 is generally regarded as the replacement rate (the rate at which a population neither grows nor shrinks) in the developed world. In less developed countries this rate should be higher to account for so many children not reaching childbearing age. Palestinian Territories Fertility Rate 1975 -1980 7. 39 1980 -1985 7. 00 1985 -1990 6. 43 1990 -1995 6. 46 1995 -2000 5. 99 2000 -2005 5. 57 Total fertility rate U. K. 1975 -1980 1. 72 1980 -1985 1. 80 1985 -1990 1. 81 1990 -1995 1. 78 1995 -2000 1. 70 2000 -2005 1. 66 Africa Fertility Rate 1975 -1980 6. 60 1980 -1985 6. 45 1985 -1990 6. 11 1990 -1995 5. 67 1995 -2000 5. 26 2000 -2005 4. 97

Infant Mortality Rate – the number of deaths of children under the age of one per thousand live births. The rate ranges from as low as 3 (Singapore, Iceland) to as much as 150 (Sierra Leone, Afghanistan). The U. S. rate is just over 6. High infant mortality tends to result in higher fertility rates as families seek “insurance” for the loss of children.

Birth Control Programs F One family/one child policies – Female infanticide – Social compensation fees Sterilization F Loss of status F Termination healthcare/food coupons F Free birth control F Increased literacy F
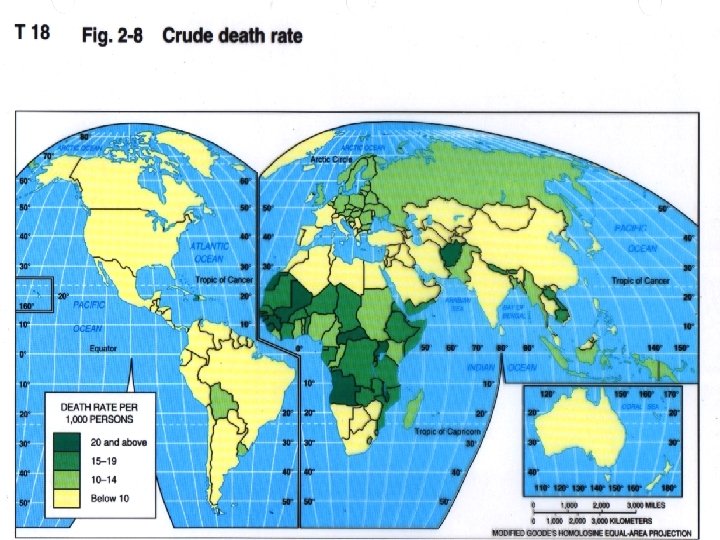

World Death Rates F Infectious diseases – HIV/AIDS – SARS F Degenerative diseases – Obesity – Tobacco use F Epidemiology F Epidemiological transition

Adults and Children Living with AIDS, 2004

Rates of Natural Increase

Doubling Times The doubling time is the number of years before a population will be twice as large as it is today. World = 50 U. S. = 34 MDC = 543 LDC = 40 Honduras = 22 Belize = 19 Denmark = 700 Russia = never?
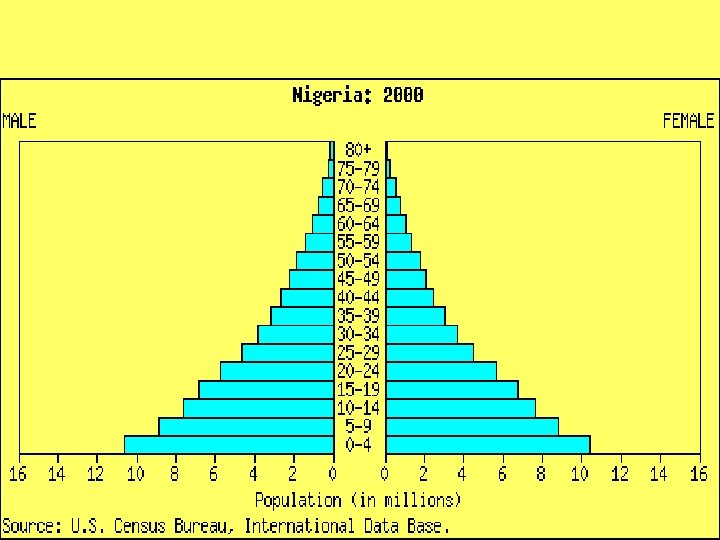
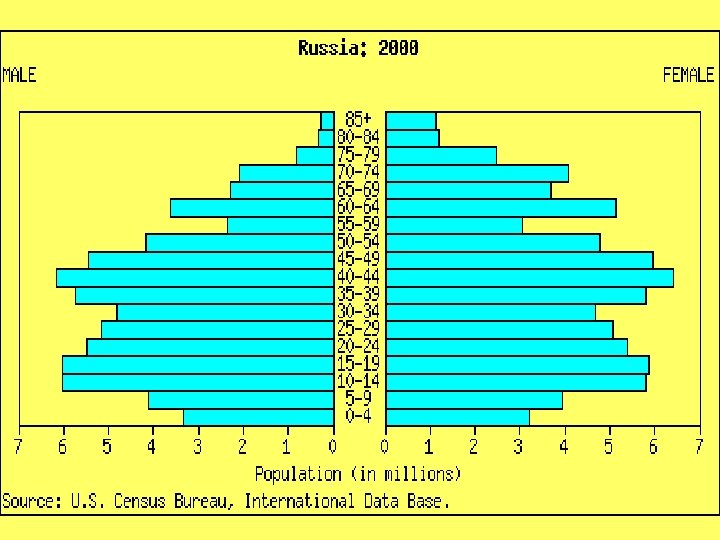

Demographic Transition Model
 – Crude birth/death rate high – Fragile,")
Demographic Transition Model F Stage one (preindustrial/pre-agricultural) – Crude birth/death rate high – Fragile, but stable, population F Stage two (improved agriculture and medicine) – Lower death rates – Infant mortality rate falls – Natural increase very high F Stage three (attitudes change) – Indicative of richer developed countries – Higher standards of living/education – Crude birth rate finally falls F Stage four – Crude birth/death rates low – Population stable – Populations aging

Problems with the Demographic Transition Model • based on European experience, assumes all countries will progress to complete industrialization • many countries reducing growth rate dramatically without increase in wealth • on the other hand, some countries “stuck” in stage 2 or stage 3

Population Shift

Overpopulation F When consumption of natural resources by people outstrip the ability of a natural region to replace those natural resources.
 • predicted that innovation, resulting increased wealth, and")
Jean Antoine Condorcet (1743 – 1794) • predicted that innovation, resulting increased wealth, and choice would provide food and resources in the future and lead to fewer children per family • believed that society was perfectable

Thomas Malthus on Population An Essay on the Principle of Population, 1798 Malthus, responding to Condorcet, predicted population would outrun food supply, leading to a decrease in food person. Assumptions F Populations grow exponentially. F Food supply grows arithmetically. F Food shortages and chaos inevitable.

Population J-Curve

Population and the Environment I=Px. Ax. T Impact = Population x Affluence x Technology Population-influenced environmental problems: • Global Warming • Habitat Loss / Endangered Species • Resource Depletion • Food Shortages? Not globally, but regionally.

Population and Resource Consumption

The End
- Slides: 32