Population Genetics of Tanner Crab Chionoecetes bairdi in
 in Alaskan Waters Genevieve M. Johnson")
Population Genetics of Tanner Crab (Chionoecetes bairdi ) in Alaskan Waters Genevieve M. Johnson Presented to BSAI Crab Plan Team: May 3, 2019
. GBIF Backbone Taxonomy. Checklist Dataset https:")
Chionoecetes bairdi Rathbun, 1924 in GBIF Secretariat (2017). GBIF Backbone Taxonomy. Checklist Dataset https: //doi. org/10. 15468/39 omei accessed via GBIF. org on 2018 -01 -12.

Tanner Crab Commercial Harvest by Season

Life History - Long pelagic larval duration - Possibly advected by currents - Need to settle in suitable habitat - Juveniles vulnerable to predation Photo credit: NOAA NMFS

Life History Photo credit: NOAA NMFS
 Progress in Oceanography - - Simulated drift from 1978 -")
Richar et al. (2015) Progress in Oceanography - - Simulated drift from 1978 - 2004 High retention in Bristol Bay Asymmetric, northwesterly flow ● ● ● 1978 -2004 1978 -1990 1991 -2004

Eastern Bering Sea: 166°W Longitude West 166 East 166 Figure modified from Bowers et al. (2008) Fishery Management Report No 08 -73

Bering Sea: Hybridization with Chionoecetes opilio Photo credit: Molly Zaleski C. bairdi C. opilio Urban et al. (2002) Crabs in coldwater regions
 Mol Mar Bio & Biotech - mt. DNA CO 1")
Bunch et al. (1998) Mol Mar Bio & Biotech - mt. DNA CO 1 gene - 18 distinct haplotypes - Haplotype diversity differed among regions - Possible transport by ACC
 Merkouris et al. (1998) Fishery Bulletin - 27 loci: 12")
Allozymes (proteins with variation) Merkouris et al. (1998) Fishery Bulletin - 27 loci: 12 uniform, 15 variable - Significant differentiation between regions: Bering Sea/Gulf of Alaska/Southeast Alaska - Allele frequencies of 3 loci differed east and west of 166 ° W Figure modified from Fetzner & Crandall (2001) Biology of Freshwater

Objectives - Measure genetic diversity with genome-wide genotypes - Test for genetic differentiation among major regions

PWS n = 21 EBS_NW n = 23 EBS_SE n = 24 SEAK n = 21

Sampling
 Plo. S one")
Reduced representation sequencing Figure modified from Peterson et al. (2012) Plo. S one

Double digest restriction associated DNA sequencing Eco. RI-HF Msp. I Figure modified from D. Eaton pyrad tutorial
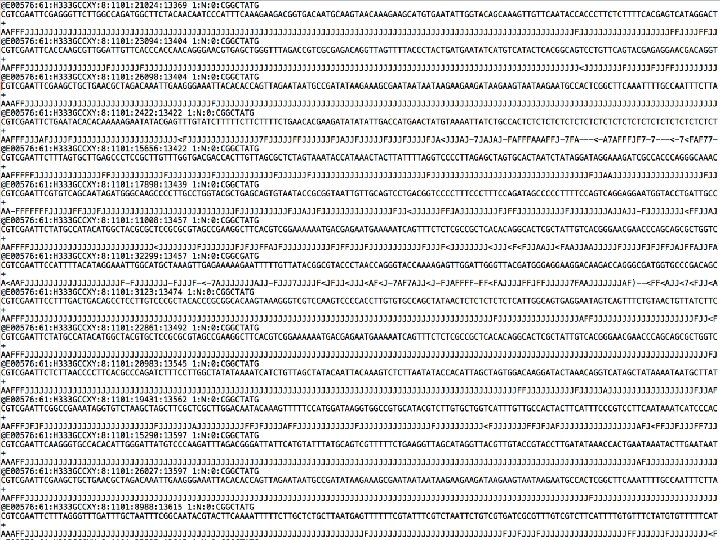

Bioinformatic processing Figure from D. Eaton ipyrad tutorial
 G")
Bioinformatic processing Figure from D. Eaton ipyrad tutorial & Recknagal et al. (2013) G 3

Bioinformatic processing Single Nucleotide Polymorphism Figure from D. Eaton ipyrad tutorial & Recknagal et al. (2013) G 3

Genotypes C C CC 0 T C C T CT TC 1 T T TT 2
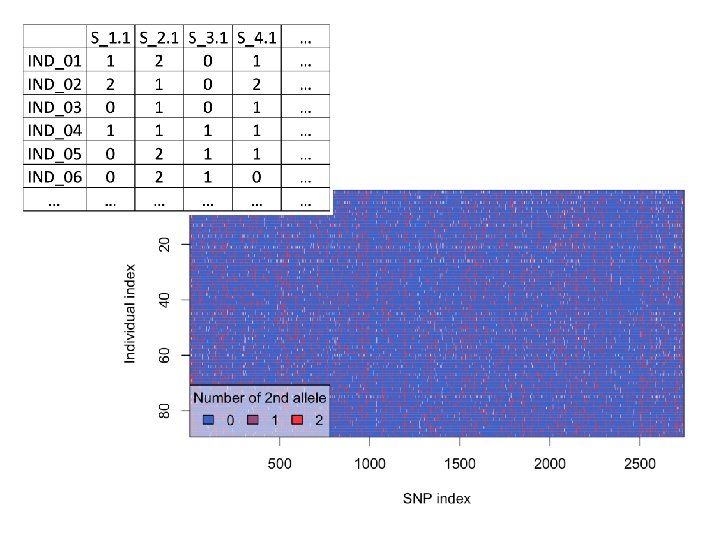

89 Individuals genotyped at 2, 740 SNP sites in final assembly

Heterozygosity by locus Mean HExp = 0. 186 Mean HObs = 0. 164 Difference: -0. 022*
 Exp 0. 178 0. 184 0. 182 0. 183")
Gene diversity (Mean H ) Exp 0. 178 0. 184 0. 182 0. 183
 Obs 0. 161 0. 166 0. 163 0. 165")
Mean Observed Heterozygosity (H ) Obs 0. 161 0. 166 0. 163 0. 165

Hierarchical Organization of Genetic Diversity Within-population variation Individual AACTTGG Chromosomes AATTTGG Polymorphic sites Within-individual variation Between-population variation
 90. 53% p. value < 0. 001 9. 42%")
Analysis of Molecular Variance (AMOVA) 90. 53% p. value < 0. 001 9. 42% p. value < 0. 001 0. 05% p. value = 0. 184
 Mol Eco F is a classic population genetics statistic used")
Waples & Gaggioti, (2006) Mol Eco F is a classic population genetics statistic used to measure genetic differentiation among groups Cowen et al. (2007) Oceanography ST FST ≈ 1 FST ≈ 0

Hierarchical Structure F-statistics Correlation of alleles within an individual relative to the entire population FIT Individual Subpopulation FIS Correlation of alleles within an individual relative to its subpopulation Total Population FST Proportion of genetic diversity due to allele frequency differences among populations

Hierarchical Structure F-statistics FIT Individual Subpopulation FIS Total Population FST 0. 000229

Hierarchical Structure ϕIT Individual Subpopulation ϕIS Total Population ϕST

Hierarchical Structure 0. 0947 ϕIT Individual Subpopulation ϕIS 0. 0943 Total Population ϕST 0. 000456

Pairwise F ST

Pairwise F ST

Pairwise F ST 0. 0122 0. 97 0. 36 0. 68 0. 046 0. 67 0. 0135 0. 0145 0. 0130 0. 0143 0. 10

Testing for population partitioning with nonparametric and parametric methods
 Principal Components Analysis PC 1 (2. 1%)")
PC 2 (1. 7%) Principal Components Analysis PC 1 (2. 1%)
 - Method to summarize variation between groups while")
Discriminant Analysis of Principal Components (DAPC) - Method to summarize variation between groups while overlooking variation within groups - Tests assignment back to groups - Assignments by DAPC did not perform better than random assignment

STRUCTURE - Parametric Bayesian clustering algorithm - Found no support for more than one cluster
 Mol Eco What does all of this mean? Cowen et")
Waples & Gaggioti, (2006) Mol Eco What does all of this mean? Cowen et al. (2007) Oceanography - Could not reject panmixia - Other panmictic species in AK - Allozyme differentiation? Fst ≈ 1 Fst ≈ 0
 Mol Eco -")
How are genetic insights relevant to management? Knutsen et al. (2011) Mol Eco - Low but significant FST in Atlantic Cod matched spatial movement patterns Spies et al. (2015) CAN Jour Fish Aqu Sci

Takeaways - Observed heterozygosity is within range of marine species, but significantly lower than expectations under Hardy-Weinberg assumptions - Did not detect significant genetic differentiation between sampling regions - Clustering analyses did not support subpopulation partitioning

Acknowledgements & funding Sampling: Thesis committee: J. Andrés López 1, 2 Sarah Hardy 1 Ginny Eckert 1 Funding: 1 2 Computing resources: UAF GI Research Computing Systems Northern Gulf of Alaska Applied Research Award donation Research reported in this publication was supported by the National Institute Of General Medical Sciences of the National Institutes of Health under Award Numbers UL 1 GM 118991, TL 4 GM 118992, or RL 5 GM 118990. The content is solely the responsibility of the authors and does not necessarily represent the official views of the National Institutes of Health. BLa. ST is supported by the NIH with the linked awards; TL 4 GM 118992, RL 5 GM 118990, UL 1 GM 118991. UA is an AA/EEO employer and educational institution and prohibits illegal discrimination against any individual: www. alaska. edu/title. IXcompliance/nondiscrimination Research reported in this publication was supported by an Institutional Development Award (IDe. A) from the National Institute of General Medical Sciences of the National Institutes of Health under grant number P 20 GM 103395. The content is solely the responsibility of the authors and does not necessarily reflect the official views of the NIH. And a special “thank you” to the past members of the López Lab who helped me learn genetics lab techniques!
- Slides: 43