Population Genetics Evolution depends upon mutation to create


")


 = Probability that two alleles are identical by descent What is")
 Change of Genotype Frequencies by Inbreeding")


 Average percentage of loci that are heterozygous")


 sites in a sample")
 + (24) / (102 x 2) = 85. 3")


 E M M E Allele 1 M Allele 2")


- Slides: 42
Population Genetics Evolution depends upon mutation to create new alleles. Evolution occurs as a result of population level changes in allele frequencies. What evolutionary forces alter allele frequencies?
How do allele frequencies change in a population from generation to generation?
Hardy-Weinberg Principle When none of the evolutionary forces (selection, mutation, drift, migration, non-random mating) are operative: (1) Allele frequencies in a population will not change, generation after generation. (2) If allele frequencies are given by p and q, the genotype frequencies will be given by p 2, 2 pq, and q 2.
Allele frequencies in the gene pool: A: 12 / 20 = 0. 6 a: 8 / 20 = 0. 4 Alleles Combine to Yield Genotypic Frequencies
Our mice grow-up and generate gametes for next generations gene pool
Allele frequency across generations: A General Single Locus, 2 Allele Model Freq A 1 = p Freq A 2 = q
Inbreeding Decreases the Frequency of Heterozygotes
Inbreeding Depression in Humans Inbreeding can reduce mean fitness by “revealing” deleterious recessive alleles.
Inbreeding coefficient (F) = Probability that two alleles are identical by descent What is F for an individual of half sib parents? AB 0. 5 A A B B 0. 5 AA BB (0. 5)4 = 0. 0625 + 0. 0625 = 0. 125
Box 9 B, Figure 1(2) Change of Genotype Frequencies by Inbreeding
Heterozygosity and Inbreeding Heterozygosity in an inbred population = Heterozygosity in a random mating population x Prob. not IBD H F = HO (1 - F) Anytime F is greater than 0, the frequency of heterozygotes is lower in an inbred population than in a random mating population.
Box 9 B, Figure 2. Change of Genotype Frequencies by Inbreeding
9. 10 Inbreeding depression in humans
9. 11 The golden lion tamarin is a small, highly endangered Brazilian monkey
9. 12 Population decline and increase in an inbred population of adders in Sweden
Inbreeding increases egg failure in Parus major Can organisms avoid inbreeding depression? Mate Choice Genetic Incompatibility Dispersal
Prairie chicken almost went extinct in the 1950’s. Why did fitness decrease after early efforts were implemented to conserve remnant populations?
Average number of n. DNA alleles per locus Illinois pre-bottleneck 5. 12 Illinois present 3. 67 Other Pops in Midwest 5. 33 -5. 88
Loss of Habitat Extinction or reduced population sizes Gene Flow - reduced / eliminated Genetic Drift and Non-random Mating Loss of heterozygosity Deleterious alleles increase in frequency Inbreeding Depression -- lowered fitness Extinction or reduced population sizes
Measuring Genetic Variation in Natural Populations Historical Method: Examining protein variation via electrophoresis Modern Method: DNA sequencing and typing TTCTTCAGGGGGTGGAANATAAAAACCCTACAATGTATATTCATCGCCCATAATCGGCTACTTAGACA
More than one allele at 30 -50% of all loci in a population. Such loci are called polymorphic. LDH-B cline in Fundulus
Most populations harbor considerable genetic diversity 0. 10 0. 20 Heterozygosity 0. 30
Heterozygosity has a couple of interpretations: 1) Average percentage of loci that are heterozygous per individual. or 2) Average percentage of individuals that are heterozygous per loci.
Polymorphism: when two or more alleles at a locus exist in a population at the same time. Nucleotide diversity: P = ij xixjpij considers # differences and allele frequency Freq (x) Seq 1 G A G G T G C A A C Seq 2 G A G G A C C A A C Seq 3 G A G C T G G A A G 0. 4 0. 5 0. 1 1 1 2 3 p 12 p 13 0. 2 p 23 0. 5 P (0. 4)(0. 5)(0. 2) + (0. 4)(0. 1)(0. 3) + (0. 5)(0. 1)(0. 5) = 0. 077 p 12 p 13 p 23
In Theory: Under infinite-sites model: Expectation (P 4 Nem = frequency of heterozygotes per nucleotide site
Nucleotide diversity is low in humans
Polymorphism is also estimated by: K= Number of segregating (variable) sites in a sample of alleles. ATCCGGCTTTCGA K = 3 for-->ATCCGAATTTCGA ATTCGCCTTTCGA In Theory: Expectation (K � Where a = 1 + 1/2 + 1/3 +……. . 1/n-1
Counting alleles (75 x 2) + (24) / (102 x 2) = 85. 3 or Genotypic frequencies 75/102 + 1/2 (24/102) = 85. 3
Sequencing Studies Have Revealed Enormous Genetic Diversity CFTR Locus
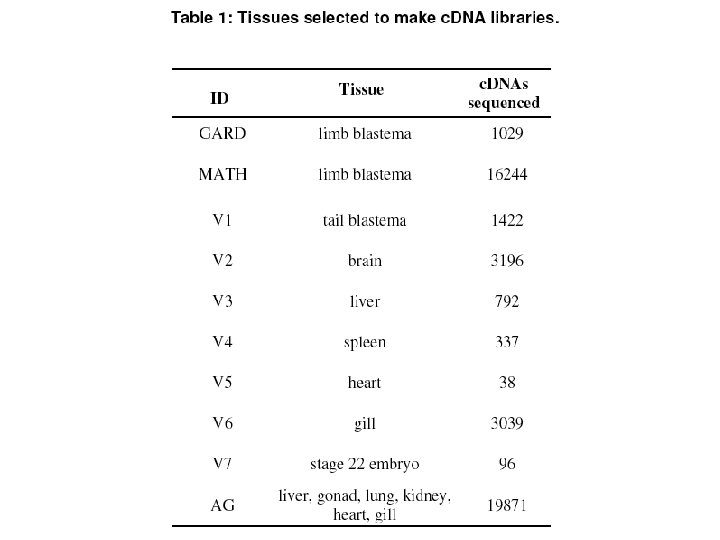
Measuring Genetic Variation in Natural Populations Other Methods: EST approach AFLPs Microsatellites
An EST is a tiny portion of an entire gene Exon 3` UTR AAAA TTTTTTTTT Contextual Region Polymorphic Region
Figure 4. Venn diagram of BLAST comparisons among amphibian EST projects. Values provided are numbers of reciprocal best BLAST hits (E<10 -20) among quality masked A. mexicanum and A. t. tigrinum assemblies and a publicly available X. tropicalis EST assembly. A. t. tig. 2296 6912 523 353 465 A. mex. 7909 X. trop. 34, 296
EST Projects: A quick way to obtain complete mt. DNA genome sequence. Mt DNA : 22 t. RNAs, 2 r. RNAs, 13 m. RNA Homoplasmic, maternal transmission, evolves quickly Approximately 1 -2% sequence divergence / million years
# SNPs per EST A. mexicanum A. t. tigrinum ~ 5% mt. DNA sequence divergence
Microsatellites Co-dominant marker type Found in essentially all genomes Evolve at a very high rate (10 -3 - 10 -4 per locus per gamete per generation) See Figure 3. 19 for pict showing gel separation of microsat alleles
Insertion during DNA replication 5’ A ATCCTAGTATATA 3’ TTAGGATCATATATGTGCTTAA 5’ A ATC T C AG T A Replication inserting TA T A T A C G A A T T 3’ TTAGGATCATATATGTGCTTAA
Deletion during DNA replication 5’ A ATCCTAGTATATA 3’ TTAGGATCATATATGTGCTTAA 5’ A ATCCTAGTATATA TTAG Mispairing of DNA during replication G T A TC A 3’ ATATGTGCTTAA T A is excised Replication of DNA 5’ A ATCCTAGTATACACGAATT TTAG G T A TC A ATATGTGCTTAA 3’
Insertion in non-replicating DNA 5’ A A T C C T A G T A T A C G A A T T 3’ TTAGGATCATATATGTGCTTAA 5’ A ATC T C AG T A Slipped-strand mispairing T A C A C G A A T T 3’ TTAGGATCATATA CTTAA T GTG 5’ A ATC T C AG T A Excision and repair inserts TA T A T A C G A A T T 3’ TTAGGATCATATATGTGCTTAA
AFLP (Amplified Fragment Length Polymorphisms) E M M E Allele 1 M Allele 2 RD of DNA Ligation of adaptors creates PCR primer recognition sequence Subsequent selective PCR allows sampling of for restriction length polymorphisms
AFLP Gel
Representative Molecular Approaches Phylogenetic Resolution vs Appropriateness Clonality Parentage Populations Species Restriction Fragment Analysis DNA sequencing/typing * overkill * ** *** overkill *** mt DNA na na ** *** AFLPs * * Microsatellites *** ** na From Avise’s book