POPULATION ECOLOGY Density and Dispersion What is the


- Slides: 50
POPULATION ECOLOGY
Density and Dispersion � � What is the density of a population? The number of individuals per unit area Dispersion is how they spread out in that area What are three patterns of dispersion?
Clumped � � Clumped dispersion has population occurring in patches Increased concentration of resources leads to clumping Defense against predators e. g. schools of fish
Uniform Even spacing of individuals within the population Diminishes competition Often seen with plants, they secrete chemicals that prevent germination and growth of individuals that may compete for resources.
Random � � � Spacing is varied and unpredictable Occurs in the absence of strong attraction (concentrated resources) or strong repulsion (avoidance of competition) between individuals. This form of dispersal is rare.
Estimating Population Size � � Mark re-capture method. You capture 200 grasshoppers, mark them all and then release them back into the wild. A few days later you capture 100 grasshoppers and 50 of them were marked. How many grasshoppers do you estimate are in this population? N = # marked x total captured second time number marked recaptures 200 x 100/50 = 400
Density is Dynamic � � � What changes can effect density? Immigration Emigration Births Deaths
Demography � � What is demography? Study of vital statistics that affects population size age structures - relative numbers of individuals at each age. Used to tell if a population is increasing, decreasing or staying the same birthrate, death rate, generation time and sex ratios, all affect interpretation of age structures
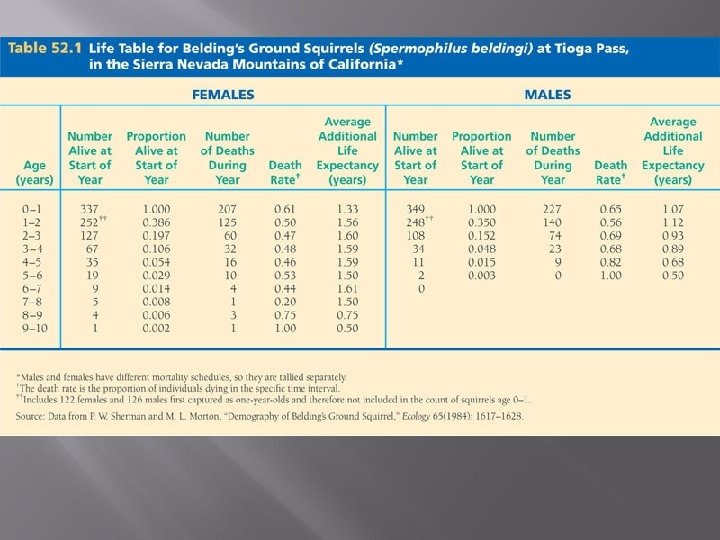
Life Tables � � � Summarize the survival pattern of a population Follows the fate of a cohort (group of individuals of the same age) from birth until death Shows the proportion of the cohort surviving from one age to the next
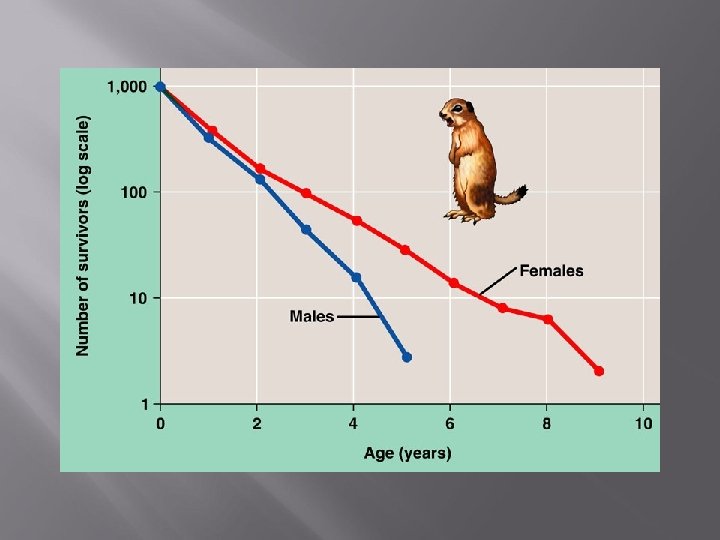
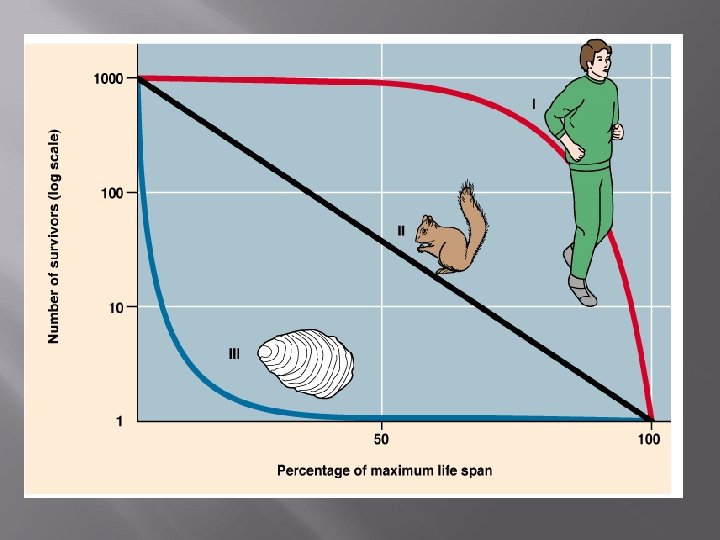
Survivorship Curves � � What is a survivorship curve? Graphic display of the life table Plot of the numbers of a cohort that are alive at each age. Survivorship curves are generally classified into three types:
Characteristics of The Three Types Seen in Survivorship Curves: � � Type I : Low death rate in early years. Small clutch sizes and good care for young Type II: constant mortality throughout life Type III: large clutch size, little care for young high mortality rate early on in life.
Reproductive Tables � � � Age specific summary of reproductive rates in a population. Measures the reproductive output of a cohort from birth until death. Tallies number of female offspring for each age group.
Reproductive Table
Patterns of Reproduction Semelparity – Organisms reproduces only once in its lifetime. Examples: salmon, agave (century plant) � Iteroparity - Organisms reproduce repeatedly throughout their lifetime. �
Life Histories What is the life history of an organism? � Traits that affect time of reproduction and death. 1. Clutch size 2. Number of reproductive episodes per lifetime 3. Age at first reproduction �
What differences can be found in the life histories of these plants?
Parental Care
� � Number of reproductive episodes: Large clutch sizes mean one reproductive episode per life. Small clutch sizes means more than one reproductive episode Age at first reproduction is younger in large clutch size reproducers, they invest less energy in their own growth and development.
Per Capita Rate of Increase � � � Births and Immigration increase the population. Deaths and Emmigration decrease the population. (Births + Immigration) – (Deaths + Emmigration) = Change in population size.
Models of Population Growth � � � r = reproductive rate, r = b-d/N b = births, d = deaths, N = population size multiply both sides of the equation by N, we get: Nr = b-d , Nr = change in population during a given time interval, = DN/Dt * Immigration and emmigration are ignored for simplicity
Models of Population Growth � � � � r = reproductive rate, r = b-d/N b = births, d = deaths, N = population size multiply both sides of the equation by N, we get: Nr = b-d , Nr = change in population during a given time interval, = DN/ Dt = b - d r max = maximal population growth If deaths exceed births r is negative If deaths equal births r is zero (no growth) If births exceed deaths, population is growing.
r max = 1 r max =. 5
After Protection From Hunters
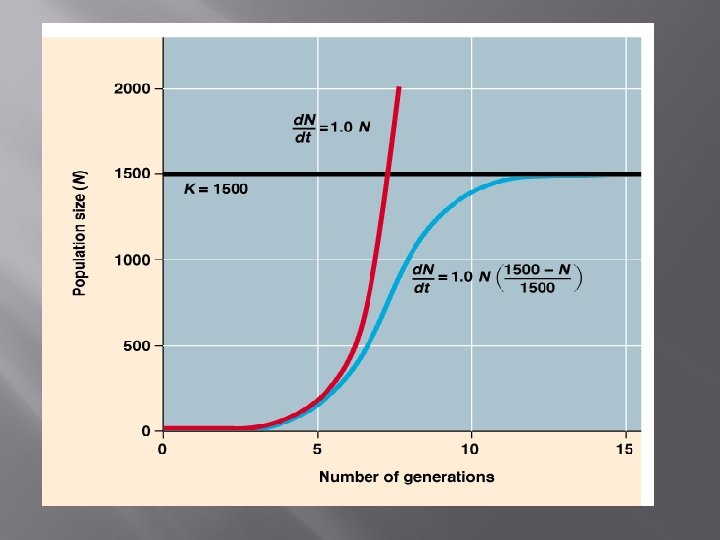
Exponential Growth � � � J shaped curve Unlimited population growth, due to unlimited resources. r selected populations favor the exponential growth curve. Seen in areas with little competition Opportunistic species display this pattern, grasses, insects… But all populations eventually have a limit placed on their growth. . .
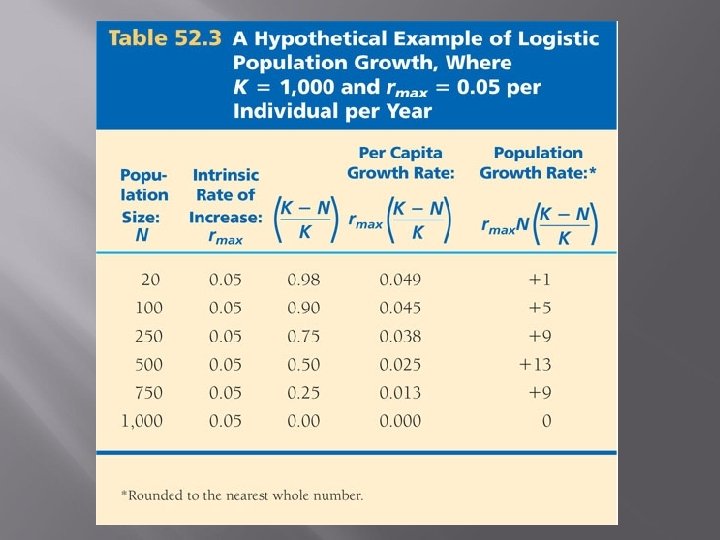
Logistic Growth � � � Limiting factors will affect the size of a population Equation becomes: d. N/dt = r max N (K-N/K) K = carrying capacity, varies over space and time When the population is low, N is small and K-N/K is close to 1, so r is close to r max As N approaches K, K-N/K approaches zero and therefore r approaches zero and the population is no longer increasing or decreasing in size.
? K What is occurring here? N is greater than K, so r is negative, deaths exceed births
K What is occurring here? N is less than K, so r is positive, births exceed deaths
Examples of logistic growth: K selected species - likely to be living at carrying capacity, seen in areas with competition
r selected short maturation time short life-span high death rate many offspring/reproduction one reproductive event reproduces early in life small size to offspring no parental care K selected long maturation time long lifespan low death rate few offspring/reproduction several reproductive episodes reproduces later in life large sized offspring parental care for young
Concept Check 1. 2. 3. 4. 5. How is a population growing when N is very small? What changes are occurring when N approaches K? What happens when N is greater than K? What are characteristics of r selected species? What are some characteristics of K selected species?
Population Limiting Factors � � � � Density dependent factors Intensifies as population grows. Density independent factors Affects same number of individuals regardless of population size. A predator is which sort of limiting factor? Density dependent. A hurricane is which sort of limiting factor? Density independent.
�Density-dependent factors increase their affect on a population as population density increases. This is a type of negative feedback. �Density-independent factors are unrelated to population density, and there is no feedback to slow population growth. Fig. 52. 13 Copyright © 2002 Pearson Education, Inc. , publishing as Benjamin Cummings
What sort of limiting factor is seen here?
What sort of limiting factor is seen here?
Is the moose population stable or unstable?
Describe the population shifts seen below:
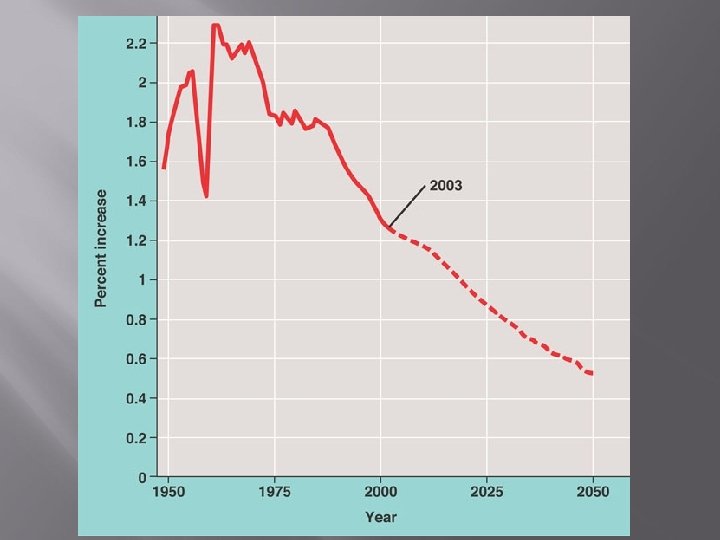
Human Population Growth � � � Human population is no longer growing exponentially, but is still increasing rapidly. Population still growing, but rate of growth is decreasing. Result of changes due to diseases, including AIDS, and voluntary population control.
Are we at carrying capacity?
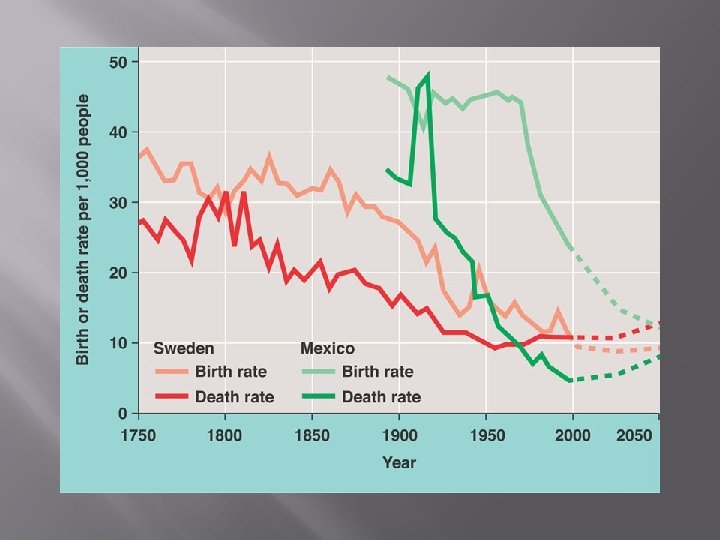
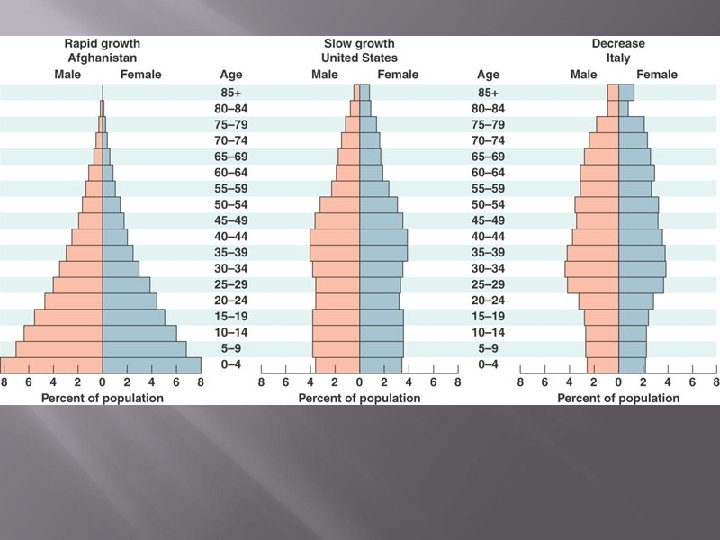
Patterns of Population Change � � Population Dynamics vary from region to region. Zero Population = High birth rate – High Death Rate Zero Population = Low Birth rate – Low Death rate Move from first to second called demographic Transition.
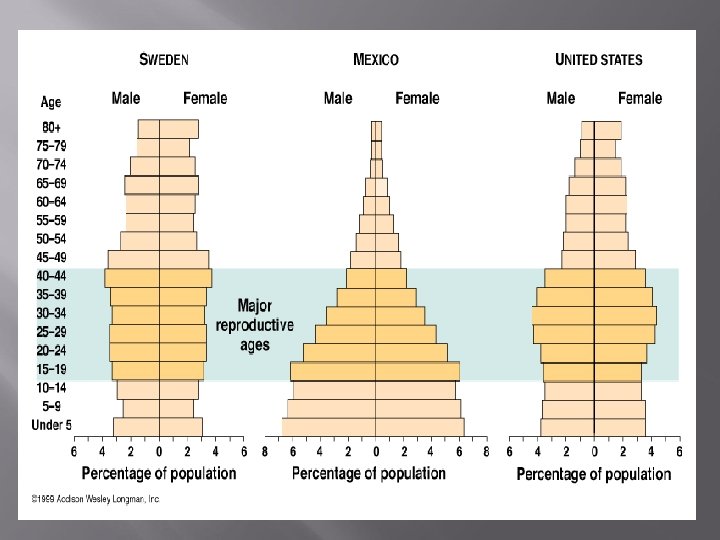
Age Structure Diagrams � � Shows relative number of individuals of each age in the pyramid. Bottom heavy, lots of youth that will grow up reproduce and sustain explosive growth. Small base, small number of reproductive individuals. Also predicts social conditions.
Concept Check 1. 2. Which population is k - selected, Type II or Type III? Determine if the following are density dependent or density independent factors. a. b. c. 3. Tornado Infectious disease Food Draw an age structure that displays a population that is increasing.