POPULATION ECOLOGY Campbell Reece Chapter 53 Population Ecology

POPULATION ECOLOGY Campbell & Reece Chapter 53

Population Ecology the study of populations in relation to their environment

Dynamic Biologic Processes that Influence Population Density Population: is a group of individuals of a single species living in same generral area Members of a population rely on same resources & are influenced by same environmental factors They are likely to interact & breed with each other

Populations often described by their boundaries & #s boundaries may be natural ones or ecologists may arbitrarily define them

Population Density # of individuals per unit area or volume

Dispersion the pattern of spacing among individuals w/in boundaries of the population

Mark-Recapture Method way to determine population size: ecologists cannot count all individuals in a population if organisms move too quickly or are hidden from view Technique: capture a random sample of individuals & “mark” & then release them. Some species can be identified w/out physically capturing them: dolphin, whale

Mark-Recapture Method

Population Dynamics Population density is not a static property: Births Deaths Immigration Emmigration

Patterns of Dispersion

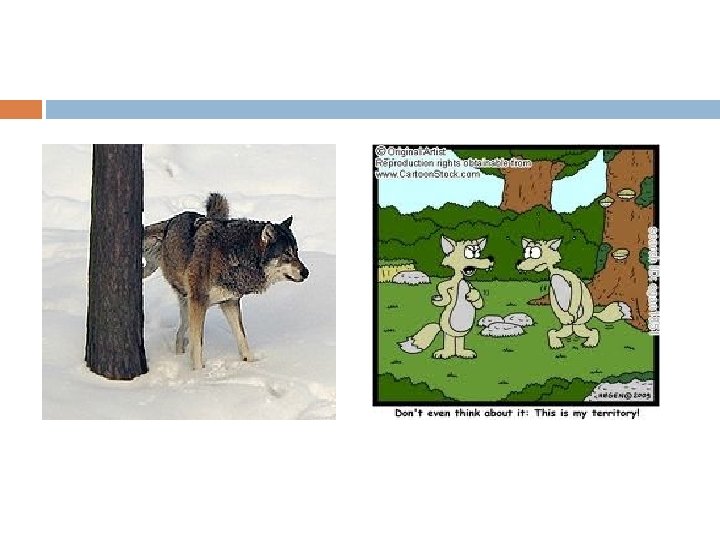
Patterns of Dispersion: Clumped *most common plants & fungi clumped where soil conditions & other environmental factors favor germination & growth animal clumping may have to do with being successful in some way: Mayflies swarm in great #s which increases their chances of mating (only have ~2 days) Wolf pack more likely to kill a moose or deer than a single wolf

Mayfly Swarm

Patterns of Dispersion: Uniform may result from direct interactions between individuals in a population some plants secrete chemicals that inhibit germination & & growth of nearby individuals that could compete for resources animals that show territoriality are spaced apart: often as result of antagonistic interactions

Patterns of Dispersion: Random unpredictable spacing 1 individual’s position is unrelated to other individuals

Demographics study of the vital statistics of a population & how it changes over time especially important are birth rates & death rates

Life Table age-specific summaries of the survival pattern of a population construct one by following the fate of a cohort: a group of individuals of the same age, from birth until all of them are dead

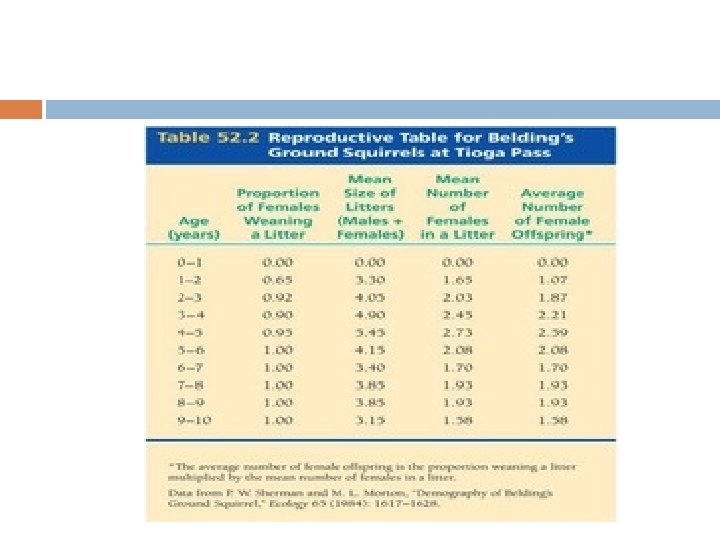
Life Table of Belding’s Ground Squirrels

Survivorship Curves a graphic method of representing some of the data in a life table plots proportion or #s in a cohort still alive at each age

Idealized Survivorship Curves

Type I Curve flat @ first reflecting low death rate during early & middle life then steep drop as death rate increases with increasing age typical curve for large mammals that produce few young but take good care of them

Type III Curve drops sharply at start reflecting high death rate among the young flattens out as death rate for those individuals that make it out of early life decreases typical for species that produce many offspring but provide little or no care for them: fishes, invertebrates

Type II Curve intermediate have a constant death rate typical of rodents, some invertebrates, some lizards, & some annuals

Survivorship Curves not all species fall into 1 of the 3 types some invertebrates have a “stair-step” pattern: more vulnerable during periods when molting, less vulnerable when not molting

Reproductive Rates Demographers tend to just look @ #s of females & how many female offspring they have simplest way to describe the reproductive pattern of a population is to ask how reproductive output varies with the age of females

Reproductive Table aka a fertility schedule an age-specific summary of the reproductive rates in a population constructed by measuring reproductive output of a cohort from birth to death

Natural Selection favors traits that improve an organism’s chances of survival & reproductive success every species has trade-offs between survival & traits such as frequency of reproduction, # of offspring traits that affect an organism’s schedule of reproduction & survival make up its life history

Life Histories 1. 2. 3. are very divers but exhibit patterns in the variability have 3 basic variables: when reproduction begins how often the organism reproduces how many offspring produced during each reproductive episode

Big-Bang Reproduction 1 individual reproduces large # of offspring then die: called semelparity

Iteroparity produce only a few offspring during repeated reproductive episodes

Semelparity or Iteroparity? Which is better? Critical factor is survival of offspring: *when survival of offspring is low as in highly variable or unpredictable environments, semelparity is favored *dependable environments where competition of resources is fierce favors iteroparity

Limited Resources means Trade-Offs sometimes see trade-offs between survival & reproduction when resources are limited example: red deer females have higher mortality in winters following summers in which they reproduce

Species whose Young have High Mortality Rates often produce large #s of relatively small offspring example: plants that colonize disturbed environments usually produce many small seeds only a few reach suitable habitat � smaller seeds allow them to be carried farther

Parental Investment Increases Survival of Offspring example: oak, walnut, & coconut trees have large seeds with large store of nrg & nutrients to help seedlings become established example: primates provide an extended period of parental care

Population Growth All populations have a tremendous capacity for growth Unlimited increase does not occur indefinitely for any species, in lab or in nature

Exponential Model of Population Growth unlimited growth does not occur for long in nature but it is assumed to be true in this model Δ population = (# births + # immigrants ) (# deaths + # emigrants) Or, ignoring immigration & emigration: Δ N/Δt = B - D

Exponential Model now use average #s of births & deaths per individual during a specified period of time If there are 34 births per year in a population of 1, 000 then the annual per capita birth rate is 34/1, 000 = 0. 034 = b

Exponential Growth Equation ΔN/dt = TMax N: represents a population’s potential growth in an unlimited environment where TMax is the maximum per capita rate of increase & N is the # of individuals in the population

Exponential Growth

Exponential Model http: //www. slideshare. net/Mr. DPMWest/populat ion-growth-apbio

Logistic Model in nature, as any population density increases: each individual has access to fewer resources eventually, there is a limit to the # of individuals that can occupy a habitat Carrying Capacity: (K) the maximum population size that a particular environment can sustain

Carrying Capacity varies over space & time with the abundance of limiting resources: � Energy � Shelter � Refuge from predators � Nutrients � Water � Suitable nesting sites

Carrying Capacity per capita birth rate decreases if there are not enough nutrients for adults to maintain themselves or if disease or parasitism increases with density per capita death rate increases for same reasons either way: results in lower per capita rate of increase

Logistic Growth Model per capita rate of increase approaches 0 as the carrying capacity is reached

Logistic Growth Equation

Logistic Model fits few real populations perfectly, but it is useful for estimating possible growth

Life History Traits are Products of Natural Selection traits that affect an organism’s schedule of reproduction & survival make up its: life history: � 3 1. 2. 3. main variables: age @ 1 st reproduction how often the organism reproduces # offspring produced/ reproductive episode

Semelparous Organisms reproduce once & die aka “big-bang”

Iteroparous Organisms produce offspring repeatedly

Semelparous vs. Iteroparous? 1. 2 critical factors: survival rate of offspring � 2. low chance survival where environment variable or unpredictable: semelparity likelihood adult will survive to reproduce again � adults less likely to survive: semelparity

“Trade-Offs” & Life Histories trade-offs between reproduction & life histories:

Trade-Offs selective pressures influence the trade-off between # & size of offspring � Plants: those that colonize disturbed environments have small seeds…only few reach suitable habitat � Animals: those with high predation rate have larger #s offspring (quail, mice, sardines)

Trade-Offs other species put large investment to insure survival of offspring � trees with large seeds (walnut, brazil nut) provide nutrients that increases offspring’s chances of survival

K-Selection/ R-Selection selection for traits sensitive to population density & are favored @ high densities is known as K-selection = density dependent selection for traits that maximize reproductive success in low density environments is called r-selection

Density-Dependent Factors refers to any characteristic that varies with population density birth or death rate changes based on population density � often because water &/or nutrients become scarce

Density-Independent Factors any characteristic not affected by ppulation density birth & death rates stable no matter what the population density is

Determining Equilibrium for Population Density red line = densityindependent death rate blue line = densitydependent birth rate junction = equilibrium density
 feedback between population")
Mechanisms of Density. Dependent Population Regulation w/out some type of (-) feedback between population density & rates of birth & death: a population would never stop growing

Mechanisms of Density. Dependent Regulation 1. Competition for Resources competing for nutrients & other resources decreases the birth rate farmers add fertilizer to reduce competition for nutrients

Mechanisms of Density. Dependent Regulation 2. Predation as # prey increases a predator may develop preference for that species

Mechanisms of Density. Dependent Regulation 3. Toxic Wastes Brewer’s Yeast used to convert carbohydrates to ethanol in winemaking but anything > 13% alcohol it toxic to the yeast

Mechanisms of Density. Dependent Regulation 4. Intrinsic Factors some species experience increased death rate * decreased birth rate when population density reaches certain point even when there is sufficient nutrients � white-footed mice: immune system altered more deaths & reproductive maturity delayed fewer births when certain density reached

Mechanisms of Density. Dependent Regulation 5. Territoriality when space becomes resource competing for it can limit population size maintaining a territory insures there will be enough food to live & reproduce

Mechanisms of Density. Dependent Regulation 6. Disease if transmission rate depends on certain level of crowding then it is densitydependent respiratory viruses spread thru air: is more easily spread in large cities than in rural areas

Mechanisms of Density. Dependent Regulation 7. Population Dynamics the normal fluctuations in population size from yr to yr

Mechanisms of Density. Dependent Regulation 8. Stability & Fluctuation because changing environmental conditions disrupt populations, they all experience size fluctuations

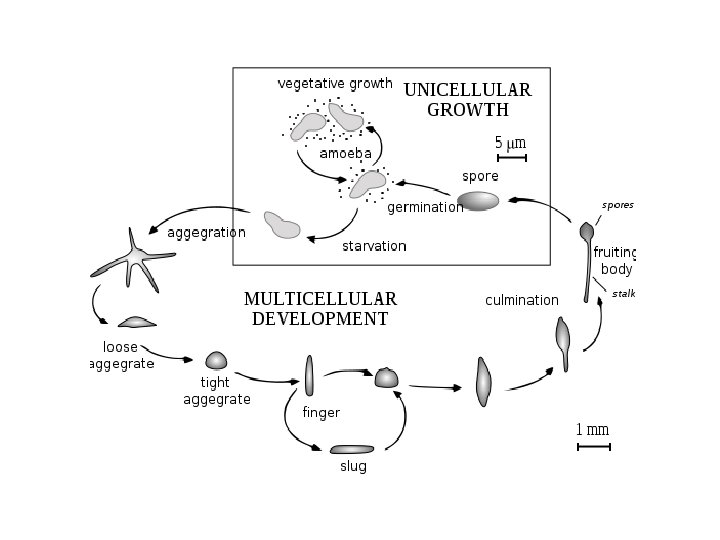
Emigration when a population becomes crowded & resource competition increases often emigration #s increase example: when slime mold resources become scarce some single celled individuals group together (amoeba group) a & form a slug

Metapopulation form when a # of local populations are linked local populations in a metapopulation can be thought of as occupying discrete patches of suitable habitat in a sea of unsuitable places

Human Population Growth since ~ 1650 has been growing exponentially w/in last 55 yrs rate of growth has fallen by nearly ½ predictions: rate will continue to decline until ~2050 & reach equilibrium ~2100

Human Population Growth

Demographic Transition movement from high birth rate & high death rate low birth rate, low death rate occurred in human population with industrial revolution

Age Structure relative # of individuals of each age use “pyramids” USA: #s fairly steady except for “baby boomers”: increased birth rate that followed up to 20 yrs after WWII

Age Structure: Rapid Growth bottom-heavy pyramid skewed toward more young individuals ex: Afghanistan, Congo

Age Structure: Slow Growth fairly steady growth over time can be do to steady birth rate or falling birth rate + steady increase in immigration ex: USA

Age-Structure: No Growth smaller base: #s under reproductive age are underrepresented ex: Italy, Germany

Infant Mortality Life Expectancy Infant Mortality = # of infant deaths per 1, 000 live births Life Expectancy @ birth = predicted average length of life both vary widely among human populations if infant mortality high parents may choose to have more children to increase odds some will reach adulthood

Comparing Industrialized & Developing Nations

Global Carrying Capacity is uncertain has changed over time due to advances in technology

Ecological Footprint is the aggregate land & water area needed to produce all the resources a person or group of people consume & to absorb their wastes it‘s 1 measure of how close we are to Earth’s carrying capacity We‘re using many of Earth’s resources in unsustainable manner


Annual per capita Energy Use

http: //www. worldometers. info/wor ld-population/ http: //www. worldometers. info/world-population/
- Slides: 88