Population Dynamics SOL BIO 9 a BIO SOL

Population Dynamics SOL BIO 9 a

BIO SOL: 9 a The student will investigate and understand dynamic equilibria within populations, communities, and ecosystems. Key concepts include: • interactions within and among populations including carrying capacities, limiting factors, and growth curves;

Population Dynamics Population: all the individuals of a species that live together in an area Demography: the statistical study of populations, make predictions about how a population will change

Population Dynamics Three Key Features of Populations • Size • Density • Dispersion • (clumped, even/uniform, random)

Three Key Features of Populations 1. Size: number of individuals in an area
 Death Rate (mortality) How")
Three Key Features of Populations Growth Rate: Birth Rate (natality) Death Rate (mortality) How many individuals are born vs. how many die Birth rate (b) − death rate (d) = rate of natural increase (r).

POSTREPRODUCTIVE PREREPRODUCTIVE

Population of a Stable Country
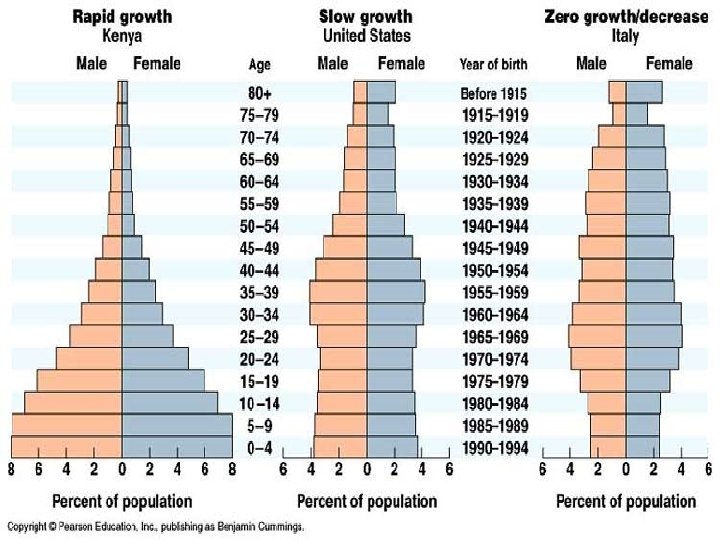

You decide!

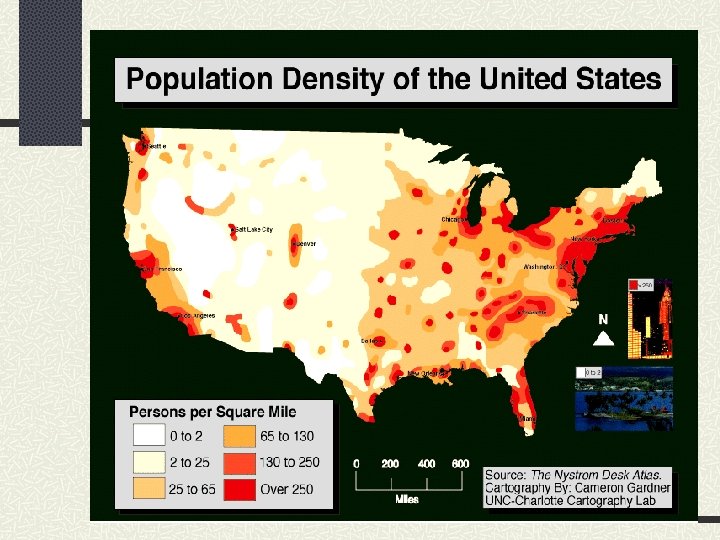
Three Key Features of Populations 2. Density: measurement of population per unit area or unit volume Formula: Dp= N S Pop. Density = # of individuals ÷ unit of space

4 Factors that affect density 1. Immigration- movement of individuals into a population 2. Emigration- movement of individuals out of a population

4 Factors that affect density 3. Density-dependent factors- Biotic factors in the environment that have an increasing effect as population size increases Ex. disease competition parasites

4 Factors that affect density 4. Density-independent factors- Abiotic factors in the environment that affect populations regardless of their density Ex. temperature storms habitat destruction drought

Factors That Affect Future Population Growth Immigration Natality + + Population Emigration - Mortality

Three Key Features of Populations 3. Dispersion: describes their spacing relative to each other • clumped • even or uniform • random

Clumped Dispersion Is the tendency for populations to be found in tight clusters, dispersed across a large landscape. In between these population hubs, very few to no individuals are usually found. This sort of a dispersion can be caused by a number of factors. Some species cluster together for protection, while others group around natural resources necessary to their survival.

Uniform Dispersion The tendency for populations to be found evenly distributed about their habitat. This is generally caused by a species ability to survive anywhere in their habitat - they use the resources found immediately around them, and spread out as to use all of the available resources.

Random Dispersion the tendency for populations to be found randomly about their habitat. In immobile species, this is usually caused by their ability to live anywhere in a given habitat, except, they are limited to growing wherever they first set root. In motile populations, individuals are able to move about their habitat, so that at any given instance, they can be found anywhere about their environment.
 random")
clumped even (uniform) random

Population Dispersion

Other factors that affect population growth Limiting factor- any biotic or abiotic factor that restricts the existence of organisms in a specific environment. n EX. - Amount of water Amount of food Temperature

Limiting Factor- Zone of Tolerance None Few organisms present Many organisms present Few None organisms present

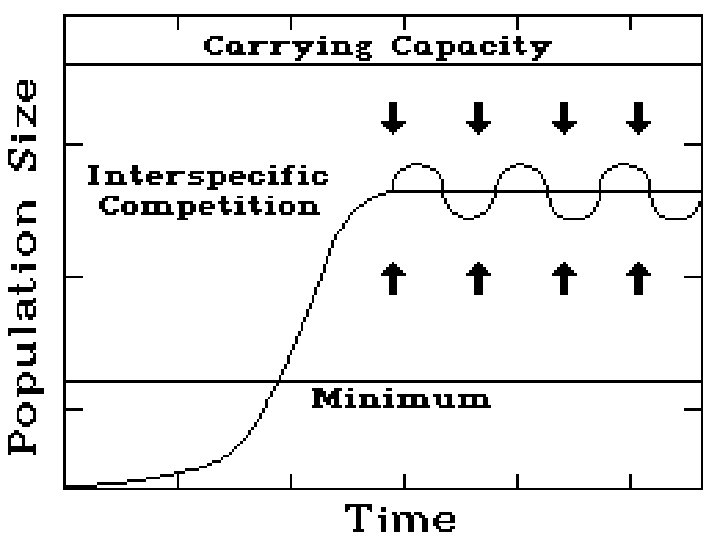
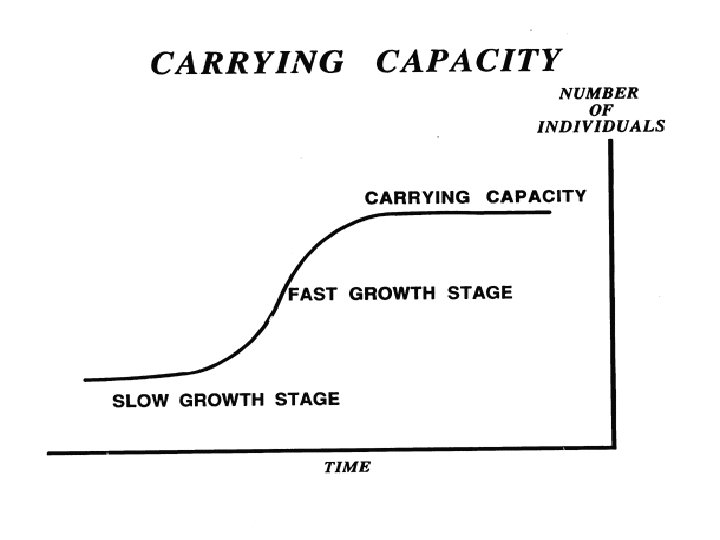
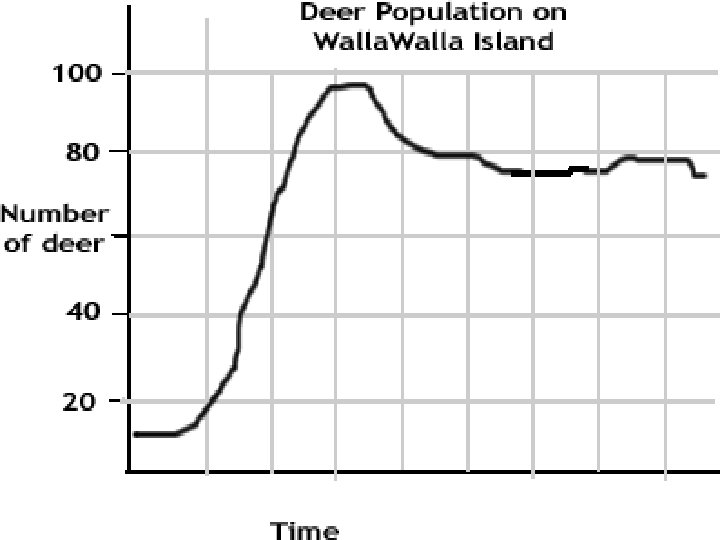
Other factors that affect population growth Carrying Capacity- the maximum population size that can be supported by the available resources There can only be as many organisms as the environmental resources can support
 Carrying Capacity (k) b S-shaped curve")
Carrying Capacity Nu m J-shaped curve (exponential growth) Carrying Capacity (k) b S-shaped curve (logistic growth) e r Time

R and K strategists Organisms that live in stable environments tend to make few, "expensive" offspring. Organisms that live in unstable environments tend to make many, "cheap" offspring.

R and K Strategists The two evolutionary "strategies" are termed r-selection, for those species that produce many "cheap" offspring and live in unstable environments and K-selection for those species that produce few "expensive" offspring and live in stable environments.

2 Life History Patterns 1. R Strategists § § § short life span small body size reproduce quickly have many young little parental care Ex: cockroaches, weeds, bacteria

2 Life History Patterns 2. K Strategists § long life span § large body size § reproduce slowly § have few young § provides parental care § Ex: humans, elephants

Measuring Population Size There are two main ways to estimate the size of a population: 1. Trap, Mark , Release, Recapture 2. Random Sampling

Trap, Mark, Release, Recapture One type of estimating method is called “mark and recapture. ” Here’s an example showing how mark and recapture works. First, turtles in a bay are caught in a way that does not harm them. Ecologists count the turtles and mark each turtle’s shell with a dot of paint before releasing it

Trap, Mark, Release, Recapture. Two weeks later, the researchers return and capture turtles again. They count how many turtles have marks, showing that they have been recaptured, and how many are unmarked. Using a mathematical formula, the ecologists can estimate the total population of turtles in the bay.

Random Sampling In many cases, it is not even possible to count signs of every member of a population. The population may be very large or spread over a wide area. In such cases, ecologists usually make an estimate. An estimate is an approximation of a number, based on reasonable assumptions.

Random Sampling In random sampling, the number of organisms in a small area (a sample), is counted and then multiply to find the number in a larger area.

Random Sampling To get the most accurate estimate, your sample area should be typical of the larger area. Suppose you count 8 birch trees in 100 square meters of a forest. If the entire forest were 100 times that size, you would multiply your count by 100 to estimate the total population, or 800 birch trees.

Human Population Growth
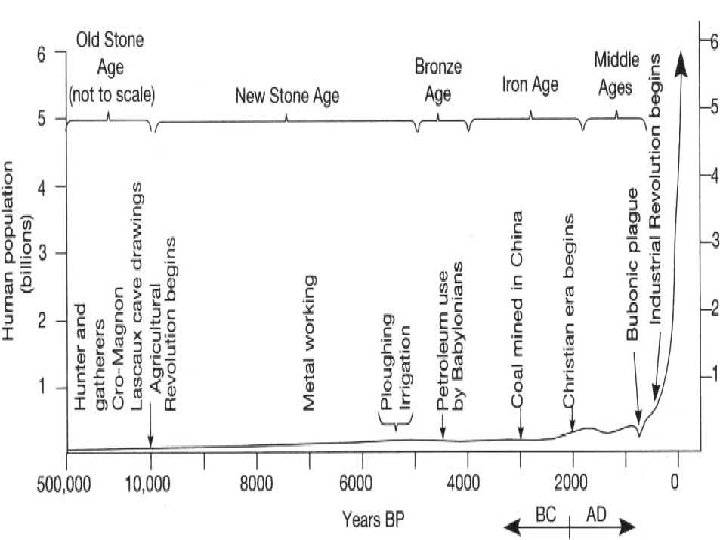

Human Population Growth

Time unit Year Month Day Hour Births 130, 013, 274 10, 834, 440 Natural increase Deaths 73, 883, 03 56, 130, 242 4, 677, 520 2 6, 156, 919 356, 201 153, 781 202, 419 14, 842 6, 408 8, 434 Minute 247 107 141 Second 4. 1 2. 3 1. 8
- Slides: 43