Population Dynamics Population change in Size Density Dispersion


, immigration (in) • Depends")


 – number of live births per")


- Slides: 57
Population Dynamics
• Population change in : – Size – Density – Dispersion – Age distribution • Change due to stress
Population change • Growth sources: – Birth, death, emigration (out), immigration (in) • Depends on resource availability • Density independent controls – anything that reduces size despite population size (natural disasters) • Density dependent controls – reduces size of population but size can influence (disease, predation)
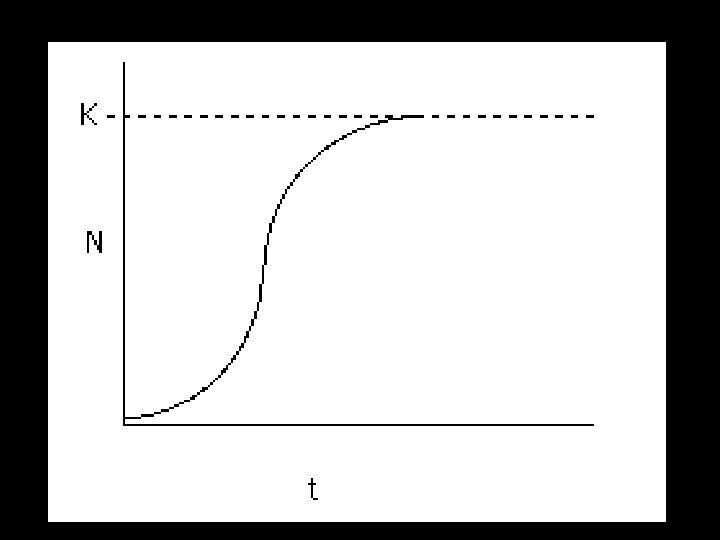
Carrying Capacity • Carrying capacity – max population that a habitat can sustain
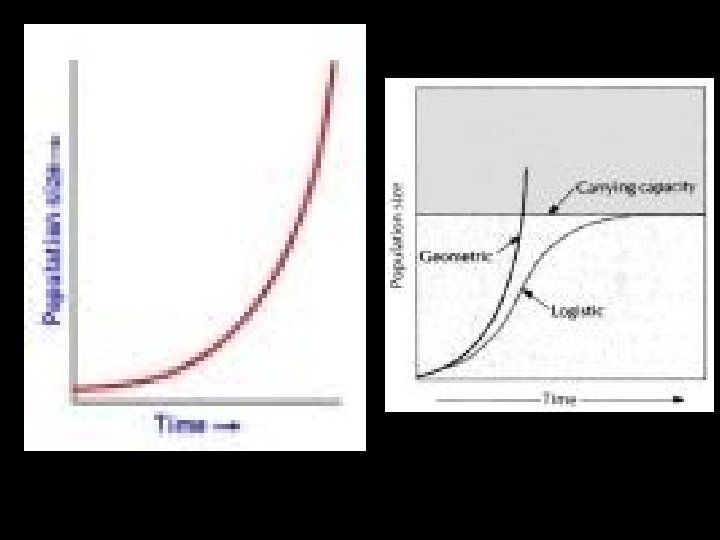
Population Growth • Exponential – has few resource limitations • Logistic – slow and steady over time; carrying capacity maintained
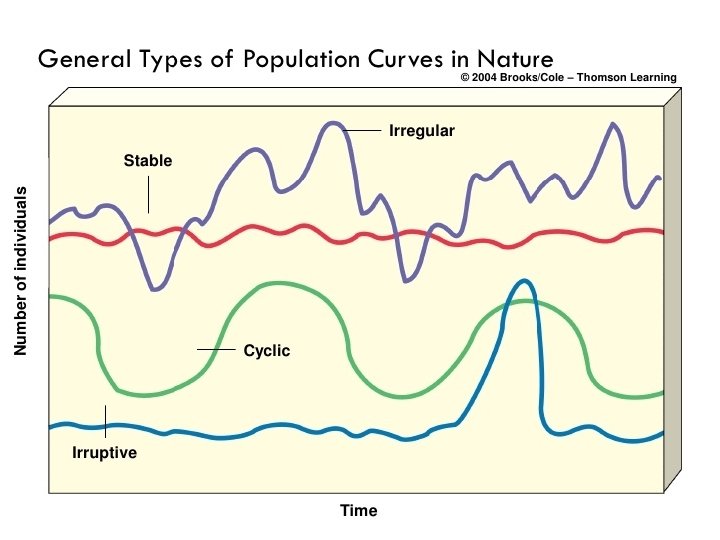
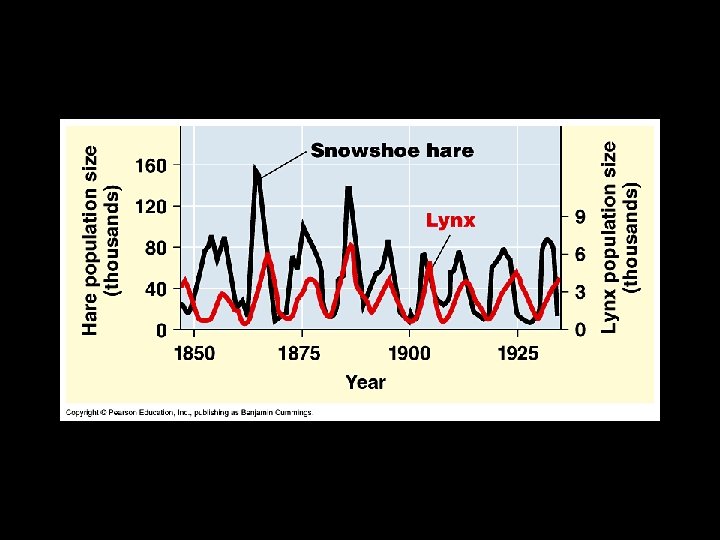
Population curves: – Stable – fluctuates right above and below K – Cyclic – rises and falls in regular intervals – Irruptive – increase drastically and quickly (more rare)
Predation and Population Control • Top-down control – Trophic cascade • Bottom-up control –Primary productivity
Opportunist or r-selected species • • • Reproduce early in life Short generation times Have many offspring Short life span Reproduce rapidly when conditions are favorable
Competitor or K-selected species • Reproduce late in life • Have few offspring that are nurtured them to maturity • Do well in competitive conditions
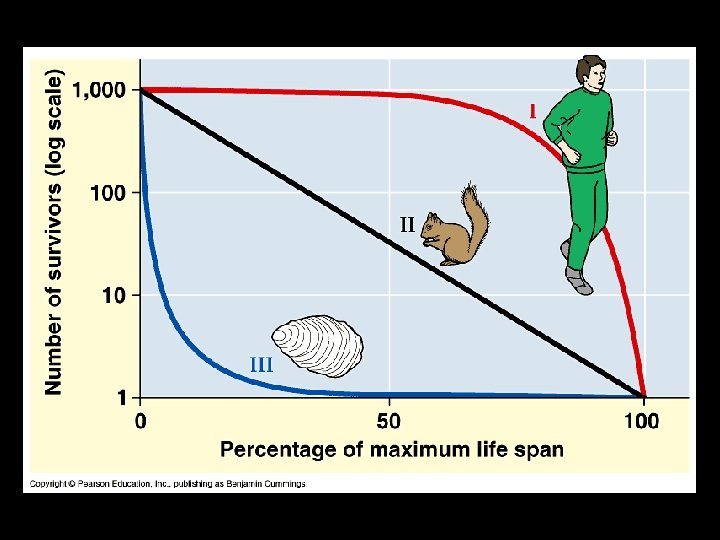
Survivorship Curves
Influences • List at least one thing that comes to mind with the following words? – Religion – Culture – Industrialized Nation – Developing Nation • How would these factors influence the population size of a country?
Survivorship Curves • Shows the number of survivors of each age for a particular species • Three types: – Early loss: typical of r-selected; many die out early in their life (Type III curve) – Constant loss: have fairly constant rate of mortality in all age ranges (Type II curve) – Late loss: typical of K-selected species; lots of energy to assure offspring reach reproductive age (Type I curve)
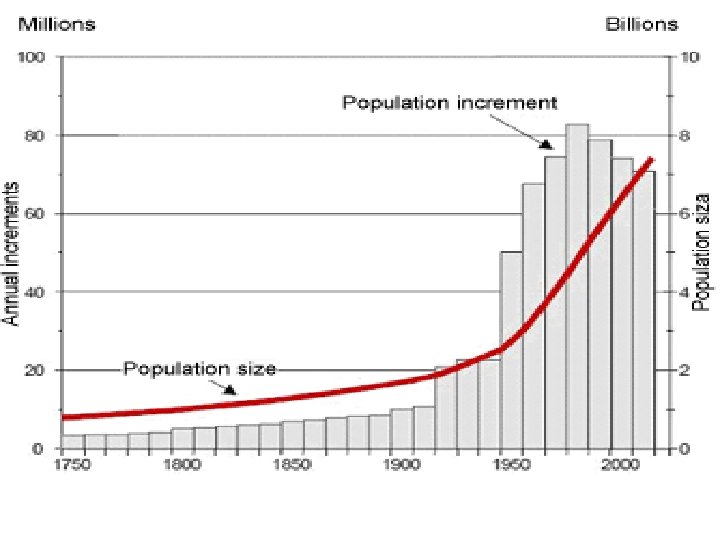
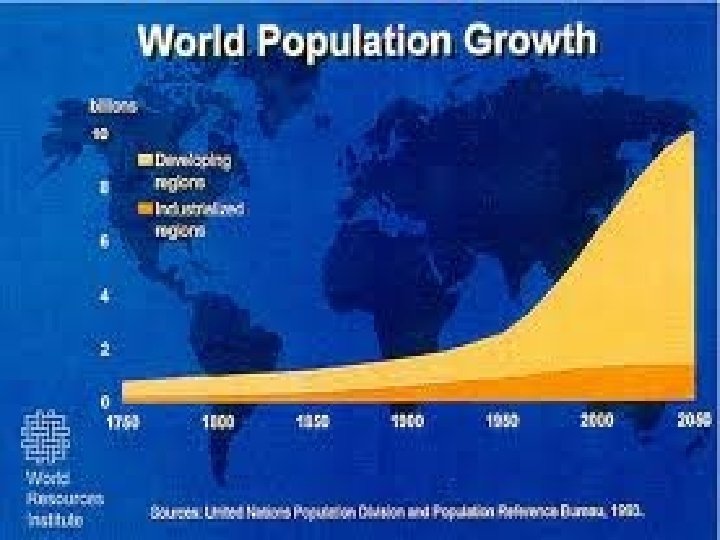
• The human population is about 7. 35 billion people. In the 1800’s, it finally reached 1 billion. What factors have contributed to this surge in the human population size?
Human Population
CBR and CDR • CBR (crude birth rate) – number of live births per 1000 people • CDR (crude death rate) – number of deaths per 1000 people • Demographers use CBR and CDR to make predictions about potential population size
Fertility Rates – Replacement level fertility – # of children a couple must bear to replace themselves – Total fertility rate – average number of children a woman will have during childbearing years • USA – 2. 06 • India – 2. 58 • China – 1. 55 Italy – 1. 4 Japan – 1. 3
Quality of Life Measure… • Infant mortality rate – Indicates health care capabilities of country
Factors Affecting Birth Rates • Are children important to the labor force? • Cost of raising and educating children • Educational and employment opportunities for women • Infant mortality rate • Availability of reliable methods of birth control • If it is available, will people use it? • Religious beliefs, traditions, and cultural norms
Factors that Affect Death Rate • Reasons for decline: – Increased food supplies – Better nutrition – Improvements in medicine and public health • As these things increase, so does the life expectancy of a society (average # of years a newborn can be expected to live)
Population Age Structure • Histograms show the proportion of the population at each age level • Divided by age and gender – Males – left; females - right • 3 categories: – Prereproductive (0 -14) – Reproductive (15 -44) – Postreproductive (45+)
What A Histogram Can Show You • • Industialization Growth rate War or Disease Baby boom
Type of population growth – Rapid – large section of population is 15 -under • Means lots of young people will move into reproductive age • More common in developing countries •
Rapid Growth
Slow – Zero Growth • Population pretty evenly distributed
Slow-Zero Growth
Negative Growth • Majority of population is in late reproductive to post reproductive age
Negative Growth
Compare the two histograms. Identify the growth rate and predict the population size in 50 years
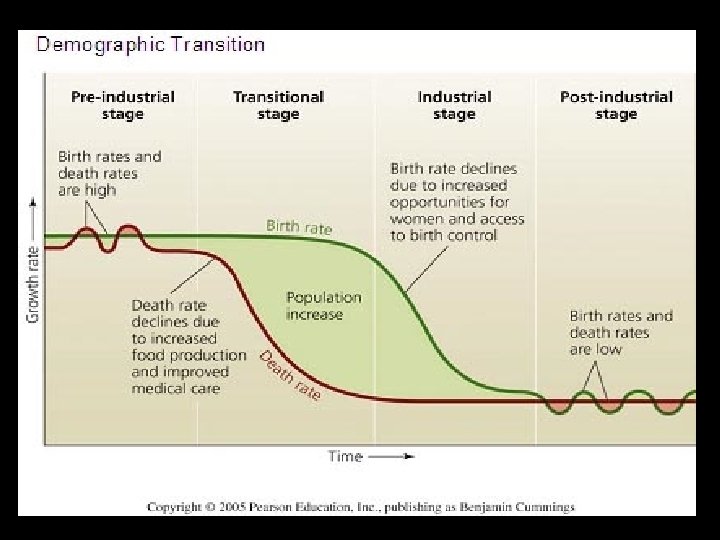
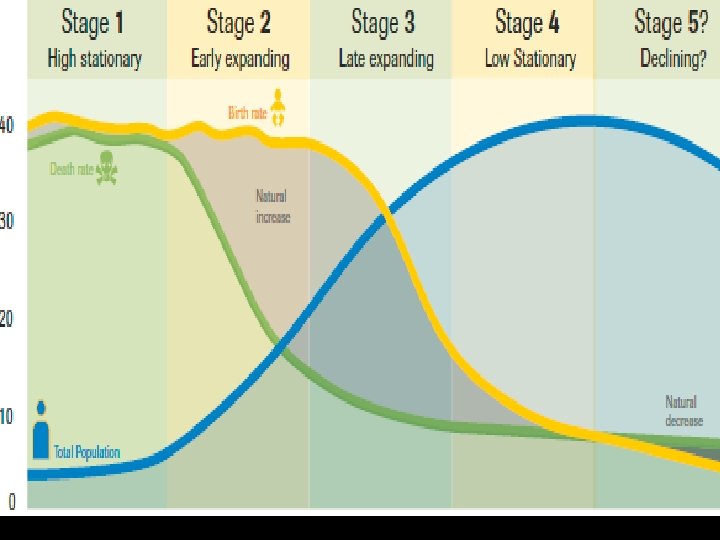
Demographic Transitions – Moving towards Industry • 4 Stages: – Preindustrial : • Little population growth due to harsh conditions • High birth rates and high death rates (close to ZPG) – ZPG – Population size remains steady, no growing – Transitional: • Industrialization begins, health rises, food rises • High birth rates b/c children aren’t dying out, but death rate drops
– Industrial : • Industrialization is widespread and birth rates begin to drop – Postindustrial: • Reaches ZPG
New th 5 Stage? • Declining – the population will decline due to death rate being higher than birth rate
No Calculator – Calculate the following • 1. 100/12 • 2. 60/2. 5 • 3. 48/3. 2
Calculating % Growth Rate • Formula = CBR-CDR/1000 x 100% OR CBR-CDR/10 • In 2000, the world birth rate was 10 births per 1000 people. The world death rate was 12 deaths per 1000 people. Calculate the world % growth rate
You Do It • In 1900, the world birth rate was 42 births per 1000 people. The world death rate was 36 deaths per 1000 people. Calculate the world growth rate %.
Doubling Time • Amount of time it will take a population to double in size (assuming a constant rate) • Can calculate by growth rate or years • To find years using a rate = 70 / Rate • To find rate using years = 70 / # of years
• Time Example – A population doubles in 10 years. What is the growth rate of this population?
You Do It • It takes a population 140 years to double in size. What is the growth rate of this population?
• Growth Rate Example – A population has a growth rate of 2. 0 in 2000. In what year would the population be double its current value?
You Do It • A population had a growth rate of 3. 5% in 2010. In what year would the population be double its current value?
Calculating Population Growth Over 1 Year • How a population changes over the course of a year including migration • Formula: – PN = PI + [(B-D)(# of thousands)] + [(I – E) (thousands)] • • • PN = Population expected for next year PI = Initial population of area B = birth rate D = death rate I = immigration E = emigration
• A suburb of Charlotte has a population of 5, 000 people in 2000. The birth rate was measured at 25 per 1000 population while the death rate was measured at 18 per 1000 population per year. Immigration was measured at 10 people per 1000 and emigration was measured at 7 people per 1000. Calculate the population size in 2001.
• A suburb of Charlotte has a population of 10, 000 people in 2002. The birth rate was measured at 10 per 1000 population while the death rate was measured at 15 per 1000 population per year. Immigration was measured at 10 people per 1000 and emigration was measured at 15 people per 1000. Calculate the population size in 2003.
Population Control in China and India • China • Considered successful because it is made available to everyone and there are economic incentives • India • Birth control is not equally accessible • Growth rate is declining • High infant mortality and early childhood mortality
Cutting Growth Population Growth • 1994 –Conference on Population and Development - Cairo, Egypt • Goals: – – – Stabilize population @ 7. 8 billion people Provide universal family planning Improve health care Increase access to education Take steps to eradicate poverty
Population Momentum • The natural rate of a country’s population increase
Find the growth rate, the population density, which country will double the fastest, and the population size after one year using the growth rate • Top 10 Most Populous Countries in the World: – China – India – USA – Indonesia – Brazil - Pakistan - Nigeria - Bangladesh - Russia - Japan
After you have calculated all countries… • Pick a country from the list. Summarize the information you found about population size, density, etc. Then, explain why you think this country’s population is the size that it is. Also, discuss at least 2 potential issues that the country should be on the lookout for at the current rate of growth…