POPULATION DYNAMICS Characteristics of Populations Factors Limiting Populations


 4. Growth rate, r • Exponential growth • Individuals in")
 4. Growth rate, r • Exponential growth • Individuals in")
 4. Growth rate, r • Logistic growth • Biotic potential,")


 does the human")


- Slides: 19
POPULATION DYNAMICS Characteristics of Populations Factors Limiting Populations Human Populations http: //filipinofreethinkers. org/wp-content/uploads/2011/12/Philippine-Lugaw-Line. jpg, http: //www. pensoft. net/J_FILES/1/articles/2447/export. php_files/Zoo. Keys-200 -001 -g 007. jpg, http: //farm 6. staticflickr. com/5191/7238292574_47 bdff 313 f. jpg
Kelp Forest Sea Urchins Sea Otters http: //phycology. mlml. calstate. edu/images/Canopy. jpg, http: //bioweb. uwlax. edu/bio 203/s 2008/bluske_brit/yawning. jpg
Characteristic # 1 Characteristics of Populations 1. Geographic distribution or range • Area inhabited by a population “The Philippine tarsier (Tarsius syrichta) is endemic to the southern Philippine islands of Bohol, Samar, Leyte and Mindanao, where it thrives mostly in secondary forests and dense patches or thickets of bush, tall grass and bamboo. ” http: //www. tarsierfoundation. org/content/the-philippine-tarsier
Characteristic # 2 • http: //www. unisdr. org/, http: //www. nscb. gov. ph/factsheet/pdf 08/FS-200806 -SS 1 -01. asp
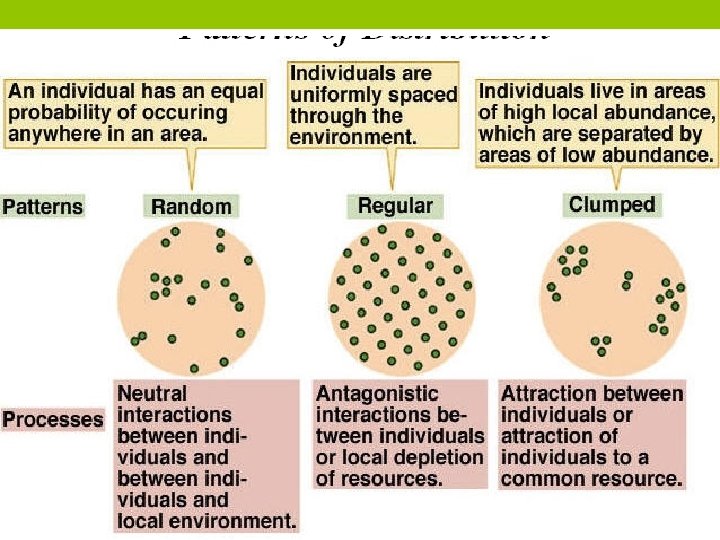
Characteristic # 3 3. Population dispersion • Patterns of spacing in relation to other members of the population • Clumped, uniform, random Concepts and Connections 2002 by Campbell
Characteristic # 4 4. Growth rate, r If • change in the number of individuals in a population per unit time • Factors affecting population size: 1. # of births 2. # of deaths 3. # of individuals leaving/entering • Immigration = into • Emigration = exit # of individuals added to/taken from the population r = pop’n growth rate b = birth rate/natality d = death rate/mortality i = rate of immigration e = rate of emigration Express r in terms of b, d, i, and e. r = (b+i) – (d+e) b vs. d growth rate i vs. e ? + ? ? - ? ? 0 ? http: //mysite. verizon. net/res 15 tbbv/sitebuildercontent/sitebuilderpicture s/animal-migration. jpg, http: //pull. imgfave. netdnacdn. com/image_cache/1288987440350429. jpeg
Characteristic # 4 (con’t) 4. Growth rate, r • Exponential growth • Individuals in a population reproduce at a constant rate • ex. bacterial reproduction: binary fission Time (hrs) # of cells 0 1 1/3 2 2/3 4 1 8 2 ? 3 ? : : 24 4. 720 x 10 ? ! 21!!! http: //www. emc. maricopa. edu/faculty/farabee/biobk/biobookmito. html
Characteristic # 4 (con’t) 4. Growth rate, r • Exponential growth • Individuals in a population reproduce at a constant rate Time (hrs) # of cells 0 1 1/3 2 2/3 4 1 8 2 ? 3 ? : J-curve : 24 4. 720 x 1021 Logistic growth • • Population’s growth slows/stops following a period of exponential growth steady-state log lag S-curve
Characteristic # 4 (con’t) 4. Growth rate, r • Logistic growth • Biotic potential, rmax • Max rate at w/c a population could increase under ideal conditions • Environmental resistance • Unfavorable conditions that prevent a population from reaching its rmax • Carrying capacity, K • Max # of individuals a given environment could support with its limited resources
http: //www. sustainabilitylabs. org/page/sustainability-five-core-principles
Survivorship Curves http: //www. kv. k 12. in. us/moodle/file. php/26/population_curve. jpg
Factors Limiting Populations • Limiting factor - factor that causes population growth to decrease • Density-dependent factors • Becomes limiting only when population reaches a certain level; mostly biotic factors • Density-independent factors • Affects all populations in similar ways, regardless of population size; mostly abiotic factors http: //www. cpsu. org. au/multiattachments/17146/Image/slow-down-sign. jpg
Factors Limiting Populations • Competition • Crowding and stress • Human disturbances • Natural catastrophes • Parasitism and disease • Predation http: //thumbs. imagekind. com/member/3 f 58 d 983 -4020 -4101 -a 3 fb-1 e 3 d 67 c 818 ac/uploadedartwork/650 X 650/d 6 b 32 ac 0 -cede-4422 -882 d-1723572 d 56 f 7. jpg, http: //reachthetribes. com/200909/big/kaingin. JPG, http: //static. guim. co. uk/sys-images/Technology/Pix/pictures/2009/10/21/1256124500714/Mount-Pinatuboeruption-i-001. jpg, http: //s 3. hubimg. com/u/593274_f 260. jpg
Human Population Growth Which model of pop’n growth (exp’l vs. logistic) does the human pop’n follow? Human pop’n size has increased through time What factors have controlled human pop’n growth through the centuries? Centralized agriculture Infectious disease Industrial, technological revolutions Modern medicine http: //www. bbc. co. uk/schools/gcsebitesize/science/images/bihumanpop. gif
Populations in developing vs. industrialized countries What does this graph tell us about birth rates in different countries? What about death rates?
http: //www. bio. miami. edu/dana/pix/agestructure. gif Demographics Age structure and Sex-ratio What do these graphs tell us about birth rates in different countries? What about death rates? What can age structure diagrams tell us about the population?
What are the effects of human population growth? What are the effects of different lifestyles? http: //kuro-kuro. org/wp-content/uploads/2010/10/population. jpg
Ecological Footprints http: //www. myfootprint. org/en/