Population Distribution The population distribution of the world

Population Distribution

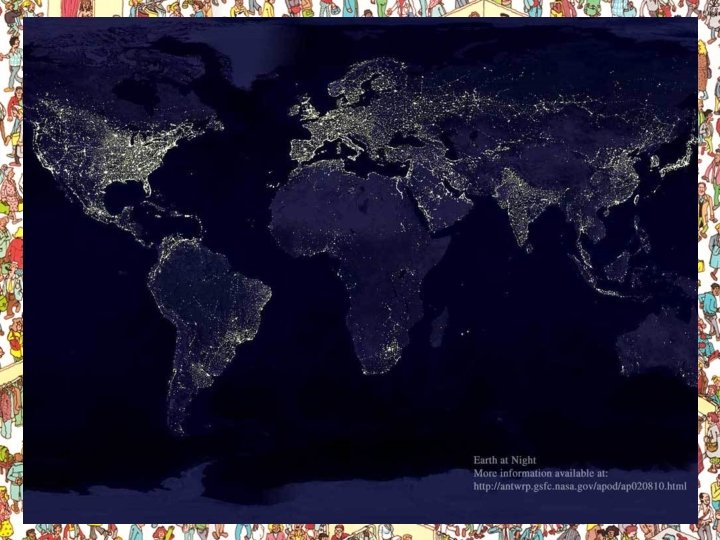
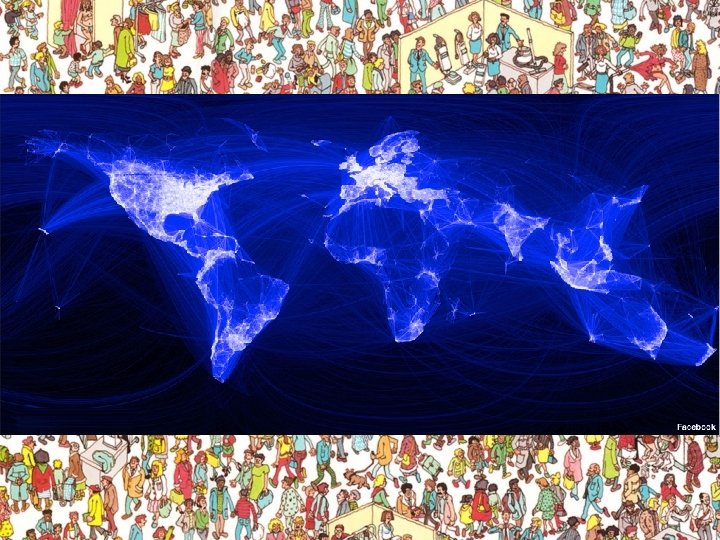
The population distribution of the world is uneven with large numbers of people living in some parts and very few in others. Factors affecting population distribution include access to water, food and areas of extreme climate (Hot and Cold Deserts). On the world map the bigger the country the larger the population

Population Key Terms

Population Key Terms Crude Birth Rate: is the number of people born each year per thousand head of population. Crude Death Rate: is the number of people who die each year per thousand head of population Fertility Rate: is the total number of children a woman can expect to have in her lifetime Natural Increase: is calculated as BR minus DR, is the increase in population per 1000 people. It can also be expressed as a percentage. Infant Mortality Rate: is the number of deaths of infants under one year of age per thousand live births Life Expectancy: is the average number of years somebody will live for. Globally this is estimated to be 65 for men and 70 for women. Carrying Capacity: is the maximum number of people that can be supported in an area, given their consumption of natural resources

Population Pyramids

Population Pyramids • Population Pyramids illustrate the age and sex composition of a population • The population can reveal changes in birth and death rates, the impact of migration and events such as epidemics and wars

Population Pyramids The Oldies -----------Economically Active -----------The Kids

Population Pyramids There are three basic shapes: The Xmas Tree The Box The Cup
 Developing Nation Growth")
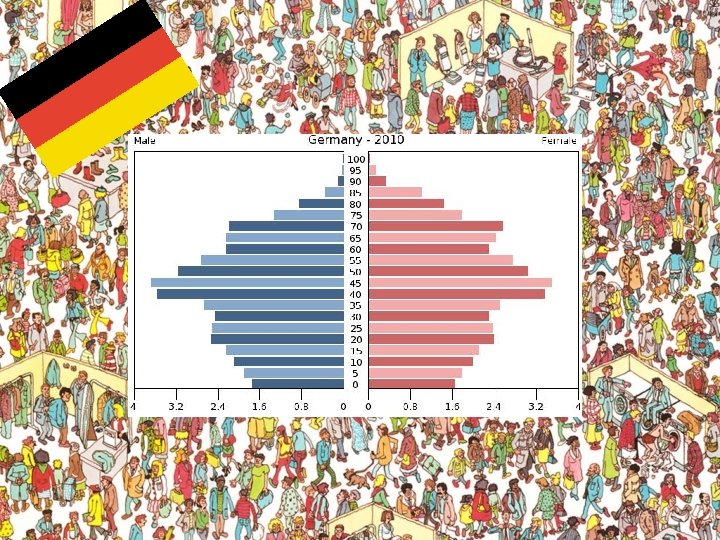
What is means… The Box The Tree Developed Nation (Slow Growth) Developing Nation Growth Rates are slow: • HIGH BR • HIGH DR Examples: • Bangladesh • Namibia The Cup • • Low Infant Mortality Slow Population Growth Examples: • Sweden • USA Developed Nation (Negative Growth) • • • Low BR Shrinking Population Long Life Expectancy Examples: • Japan • Germany

Population Pyramids The Xmas Tree

Population Pyramids The Box

Population Pyramids The Cup

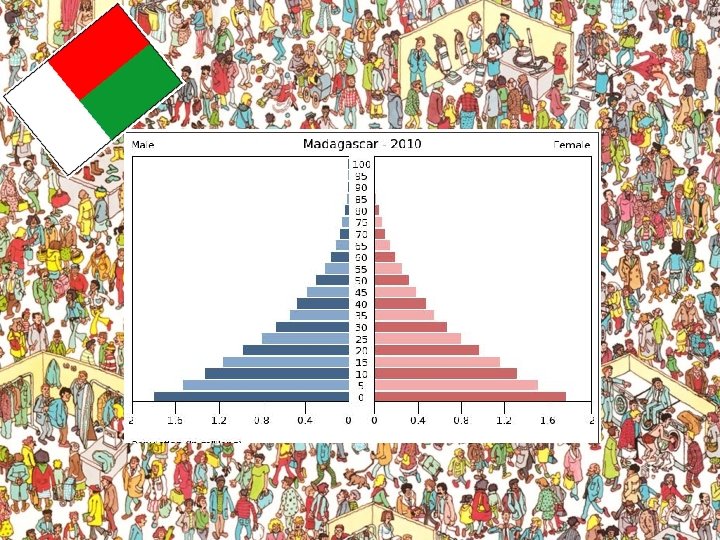
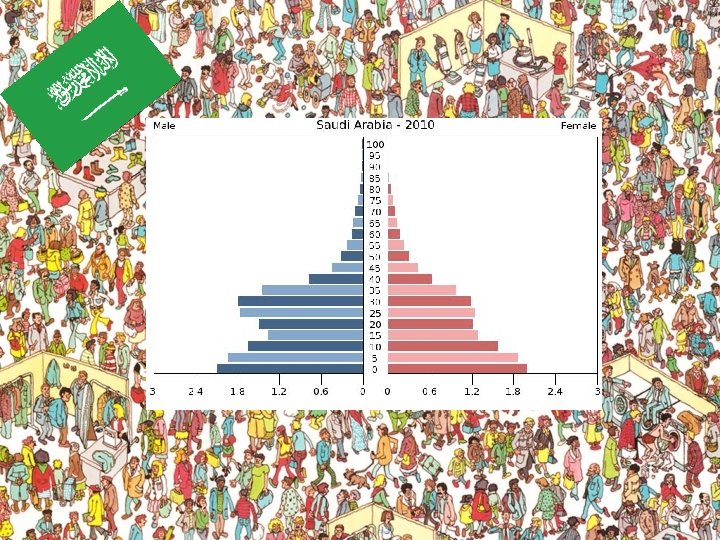
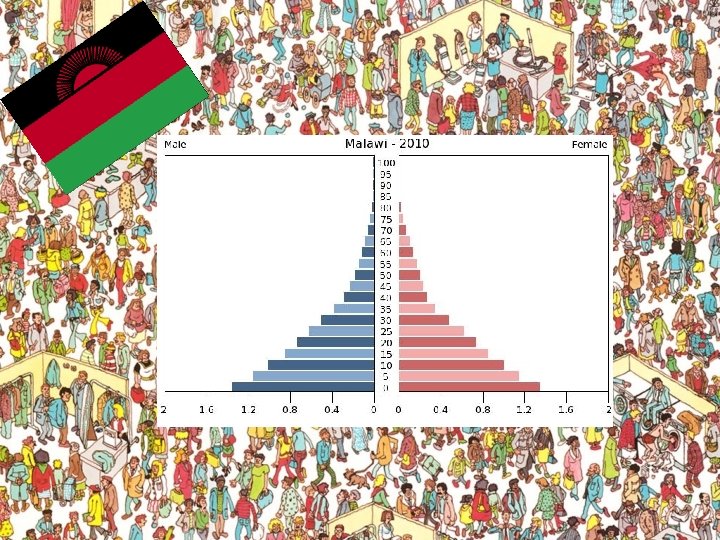
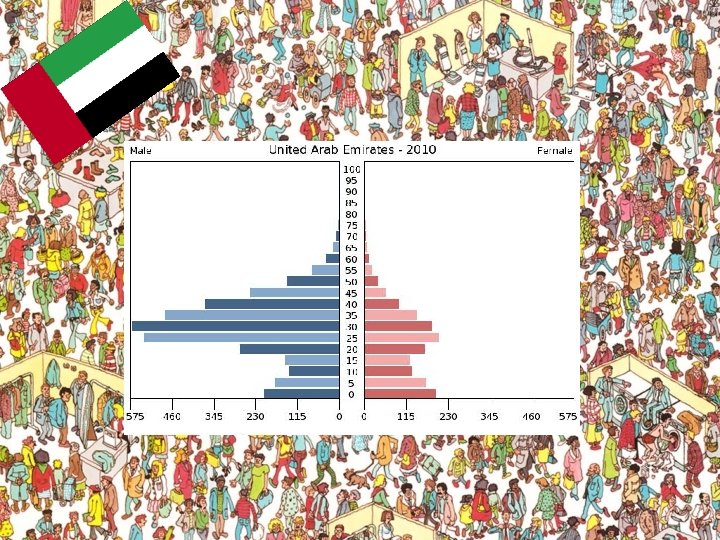
Population Pyramid: LEDCs Population Structure: • A High Birth Rate for Males and Females • A Large proportion of the population between 0 -15 • A definitive pyramid shape where the numbers of people in the upper age groups decrease rapidly • Very few people in the age groups above 60, showing a low life expectancy Reasons for Structure: • Limited provisions for women to enter the workforce (lack of education for girls). So they marry earlier and have more time to have more kids. • Lack of contraception • There is not enough money to spend on health care causing a higher DR. So families have more kids to replace the ones that die. • They have children to help them on the • They have them in the hope that one will look after the parents in old age • High BR as women are seen as useful for child bearing and rearing families in traditional cultures • Some religions do not allow the use of contraception • The Government is too poor to provide adequate health care.

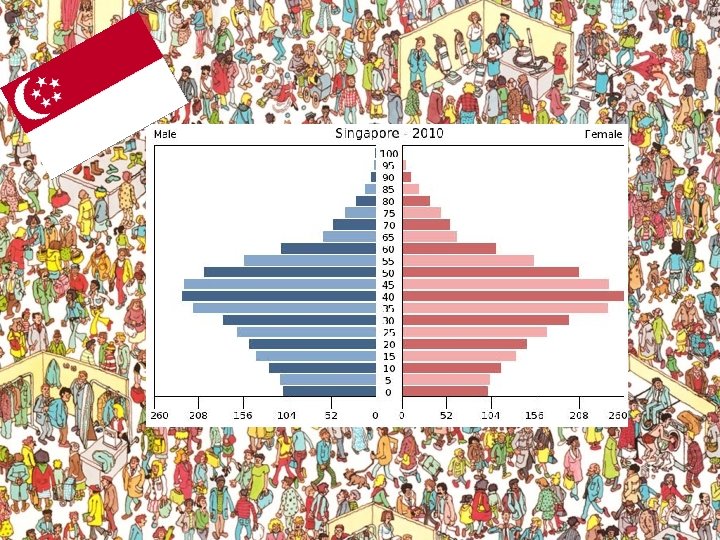
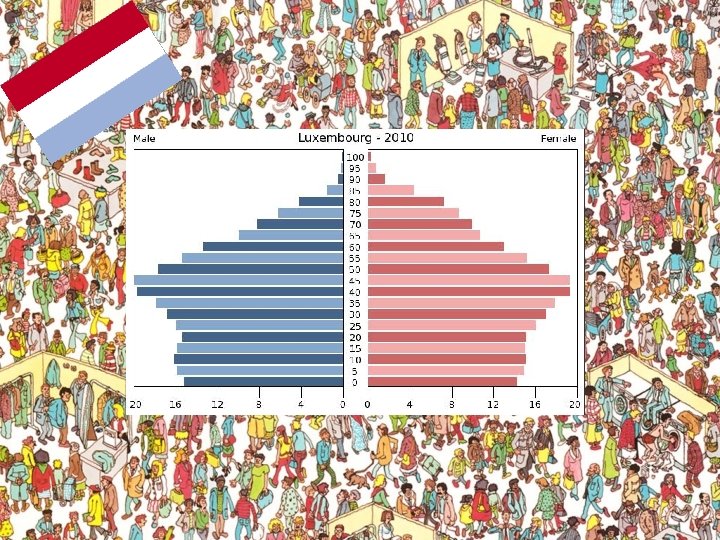
Population Pyramid: MEDCs Population Structure: • A low BR in both males and females • A bulge in the middle age groups (15 -60) indicating most of the population are in this range • A high percentage of the population in the groups 60+, indicating a high life expectancy and aging population Reasons for Structure: • Low BR due to • Access to cheap contraception. • Equality of women in society, so they choose careers over having children. • Couples having children later in life. • Awareness of expense of children. • Low DR due to: • Access for all to Healthcare (NHS in the UK) • High standards of housing and better nutrition. • Less Physically hard jobs • Government pensions and payments allow high living standards for all.

Population Pyramid: LEDC Problems • Overpopulation • Lack of Sufficient Food to meet demands • Inadequate Housing and creation of Shanty Towns • Spread of Diseases such as Typhoid • High Unemployment as there are too many people for the jobs available • Widespread Poverty • Lack of Services, due to high demand, creates poor health and education standards • Low Literacy Rates

Population Pyramid: MEDC Problems • Under population • Greater pressure on the economically active groups to support the others • Fewer young people deprives the country of a suitable workforce for future generations • More older people need to be cared for due to increased life expectancy • Increased demands for more medical care and spending on care for the elderly • A smaller economically active age group has to support an increasingly dependent population through increased taxes to pay for health and social services consequences of population change

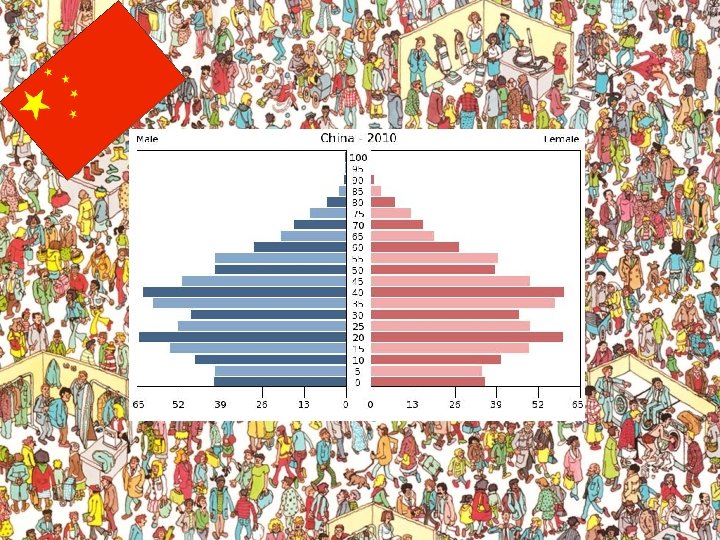
Population Pyramids: What can we tell about the countries from the following Population Pyramids?

Demographic Transition Model

Demographic Transition Model The demographic transition model attempts to show population changes over time. It has five different stages and can be used to explain how CBRs and CDRs respond to different economic and social situations. The stages can also be drawn as population pyramids.

Demographic Transition Model Stage 2: Early Expanding Stage 1: High Fluctuating • In this stage BR and DR are both high with low population growth • Medical science was at an early stage of development • Many people died at an early age from disease, poor diets and living conditions • Today found only in remote tribes in the Amazon • BR remain high but DR fall as diet and medical care improves • Consequently population grew rapidly • Nutrition is generally much better • Medicines help to control and prevent diseases • BR are high due to religious beliefs and to expand the family workforce Stage 3: Late Expanding • BR falls due to introduction of birth control • There was less need for a high BR as more children survived infancy • Some Governments introduced legislation to reduce BR (eg. China) • Countries tried to educate their population and show the benefits of a reduced BR

Demographic Transition Model Stage 5: Declining Population • Immigration is • BR is low and falling as people increased to fill delay having children or only have the jobs • BR and DR are both low and one child population growth is severely • There is potentially • Large proportion of elderly restricted racism and unrest • Mainly due to the wide availability population puts pressure on against the healthcare and social services of birth control Immigrants • Rise in taxes to pay to support the • Will have to extend • Increased employment of women and better education also reduce BR large dependent population the retirement age • Fall in those attending Churches • Couples now having children later in • Unemployment rises and thus ignoring traditional life and healthcare benefits see as schools close religious teaching people living longer • The country loses • There are less influence in the world people to do the jobs that need doing Stage 4: Low Stationary

Global Population Growth

Global Population Growth

Global Population Growth • Since the 19 th Century, and especially during the latter part of the 20 th Century, global population has grown rapidly, with the world becoming a much more crowded place • By October 1999, it reached 6 billion, a threefold increase from the late 1920 s and a six fold increase from the early 1800 s Exponential function explained. . .

Population Change: Key Words 1 • The number of people living in a country is called its population • Exponential Growth means an extremely rapid ‘explosion’ of growth. • Population Distribution means the spread of people across the surface of the earth. • Sparsely Populated means places where few people live (the population density is low). • Densely Populated means places where lots of people live (the population density is high).

Population Change: Key Words 1 • Population Density is measured by the number of people living in a square kilometre (km 2). 11 per Km² 2 per Km² The most populated country in the world is China (18, 196 / km 2) The most sparsely populated country in the world is Greenland (0. 026 / km 2)

Population Change: Key Words 1 Look closely at the images below… What physical factors affect population distribution? What human factors affect population distribution?

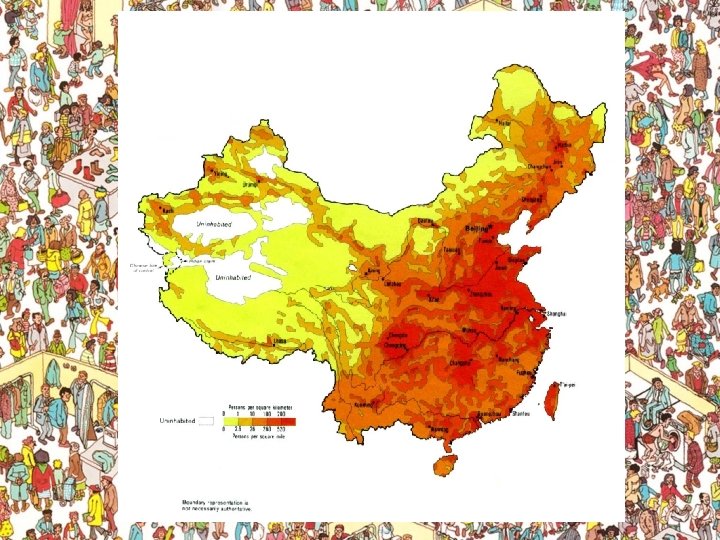
What does this map show us?

What does this map show us?

Population Density: Map Task Using one coloured pencil, shade the map in your workguide to show areas of different population density.
 have")
Factors Affecting Growth Factors reducing Death Rates: • . Standards of healthcare (NHS) have seen the eradication of diseases such as Cholera and Measles • Better access to a reliable food source and clean water • . Increases in medical standards have also helped to keep a larger amount of the population alive for longer so life expectancy is high • The provision of a public pension scheme, ‘meals on wheels’ services and a winter fuel allowance means the older population enjoy a high standard of living all year • Improved housing creating cleaner healthier environments to live in.

Factors Affecting Growth Factors reducing Birth Rates: • Access and provision by Government of cheap contraception • Better family planning education • Better health care reducing infant mortality. Means parents do not need to replace children that die. • Pension funds mean parents are not dependent on children’s income, or to look after them in old age. • Later marriages leaving less time for children • Women no longer expected to stay at home and raise a family. They can enter the work force and get married later.

Population Policies CHINA One Child Policy

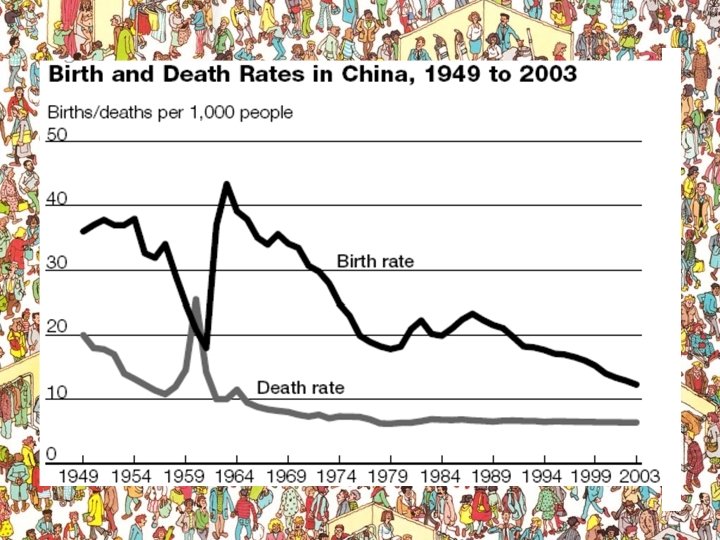
China’s Population

The Planned Birth policy of the government of the People's Republic of China is known as the One-child Policy LATER: Delayed marriage and delayed child bearing LONGER: Longer spacing between births FEWER: Fewer children – ideally one child per couple

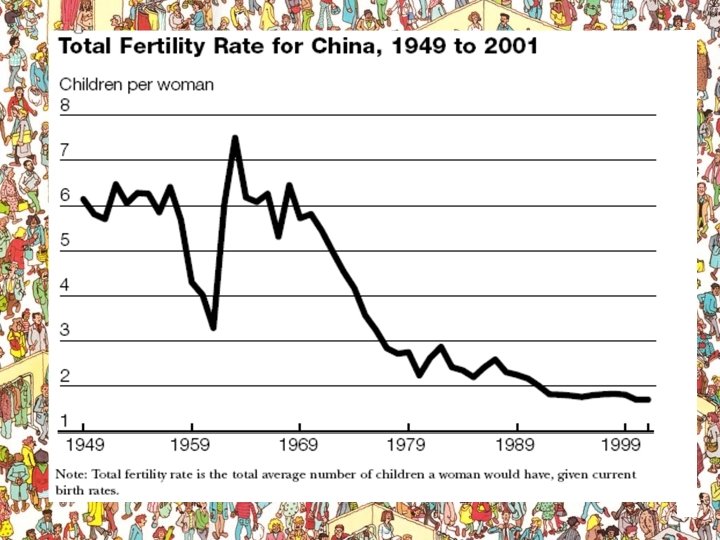
China’s Population: A History During Mao Zedong's rule the population policy of China was “the more people, the stronger we are”, leading to overpopulation and a series of famines. When Deng Xiaoping took power in 1978, his new policies focused on strengthening China's economy, and he saw overpopulation as a block to economic development. During the 1960 s the population growth rate averaged 2. 4% per year

China’s Population: A History In the 1970 s the Chinese government had issued three policies to reduce the birth rate: 1 Late marriage – men were encouraged to marry no earlier than 28 years old (25 in rural areas) and women no earlier than 25 years old (23 in rural areas). 2 Longer spacing between births – couples were encouraged to allow at least a fouryear gap after the first child before having another baby. 3 Fewer children – it was suggested that urban families should be limited to two children, and rural families to three children.

China’s Population: Propaganda

Population Census • Almost all countries have undertaken a census with the aim of acquiring statistics on the size, distribution and characteristics of all persons in a population • Heads of households are required, by law, to complete a form containing questions about all members of the household. Topics include age, sex, marital status, birthplace, nationality, migration, education and economic activity • The UN recommends a census be held every 10 years. A few countries like Mali have never had a census while some like Afghanistan have only one census to date. The last census was carried out in the UK in 2011 and cost £ 284 million to complete!!

Population Census: Other forms of data collection Civil Registration: • So called ‘vital events’ such as births, marriages and deaths, must be registered by law. • This data is collated to get a picture of where the population is growing or decreasing across the country.

Population Census: Problems with Data Collection Population Movement: Nomadic Tribes in Africa are hard to find Finance: Costs are high to create and undertake a census (UK 2011: £ 284 M) Transport Difficulties: Lack of roads limits access, especially in rural areas Purdah: In many Muslim countries Male enumerators cannot interview women Language: Some countries speak more than one language making translation difficult (Cameroon has 30 different languages!) Education: Low literacy levels prevent people completing the forms Misreporting: People may not wish to tell the truth (Illegal Migrants). Some people are genuinely unsure of their correct age. Conflict: During war and conflicts data collection is too dangerous Sheer Size: Countries like China and India are too large making data collection difficult

Advantages and disadvantages to migration Advantages Disadvantages Donor country Receiving country Migrant Strategies to manage migration • A points system. Where peoples’ skills, age or the amount of money they have are awarded points. They need to get a certain number of points to be allowed in e. g. USA, Australia • A working permission card (A Green Card in the USA). You can not work without one. • Legislation to prevent migration based on the ability to speak the language, marital status, criminal records

Population Movement: Migration

Population Movement: Migration When people move from one place to another on a permanent or semi permanent basis, it is known as migration. This can be for a matter of months, for years or on a seasonal basis.

• Loss of farm land through land reform and population pressure • Mechanisation leading to agricultural job losses • Low wages from agricultural employment • Low standard of living • Poor sanitation, water supply and rural infrastructure • Poor rural services eg. health care and education • Drought leading to crop loss • Decreasing productivity of agricultural land Population Movement: Push Factors

Population Movement: Migration James Buchanan’s relatives moved to America, from Ramelton, Ireland, around 1730 and entered through the port of Philadelphia James himself was born in 1791 in a log cabin in Mercersburg, PA

Population Movement: Migration James Buchanan never married and died on June 1 st 1868. He held a post of considerable responsibility and was replaced in 1861 by Abraham Lincoln He was the 15 th President of the United States

Population Movement: Migration We should be aware Migration between countries is often voluntary as migrants move for better paid jobs. International migration can be forced when people move because of Natural Disasters

Population Movement: Push Factors • The crop yields are low in the rural areas • Poor climate means that the crops can fail • There is a lack of education services • There is a lack of medical services • Wages are low • There are not many jobs • Transport is poor making it difficult to get to markets or a job • There is alack of entertainment

• Job opportunities in manufacturing and service sector • Better education • Better health care, doctors and hospitals • Higher wages • Better transport to get to the jobs • Possibility of better housing, sanitation and standard of living • Access to amenities, shops and entertainment Population Movement: Pull Factors

Population Movement: Migration Advantages for Receiving Country: • Overcomes labour shortages • Fill vacancies in unskilled jobs • Migrants prepared to work long hours for lower wages • Develops cultural links • May gain high skilled workers Disadvantages for Receiving Country: • Migrants likely to be the first unemployed • Live in poor conditions in overcrowded homes • Difficulties integrating into culture of country • Racial Tension and Discrimination • Limited skilled/educated group • Language difficulties • Lack of opportunity to practice religion/culture • Emergence of Shanty Towns in ELDCs

Population Movement: Migration Advantages for Losing Country: • Reduces pressure on jobs and resources • Loss of people of child bearing age reduces overall BRs • Migrants develop skills they can take back to home country • Money earned is sent back to home country Disadvantages for Losing Country: • Loss of Active Population • Loss of people with education and key skills • Males leave, causing division of families • Elderly people left behind, causing increased pressure on health services • Less tax revenue generated so essential services may be cut back

Population Movement: Migration Case Study: Polish Migrants to the UK Watch the DVD on Polish Migrants to the UK. Complete your worksheet showing the advantages and disadvantages of this migration for both the Losing and Receiving Countries
- Slides: 66