Population Distribution Population distribution refers to where people

Population Distribution Population distribution refers to where people live. On a global scale 75% of the population live within 1000 km of the sea. • Eighty five percent live in areas less than 500 m high. • Eighty five percent live between 68 N and 20 N. Less than 10 % live in the southern hemisphere. • The most favoured conditions include : fertile valleys, a regular supply of water, a climate which is not too extreme and good communications.
, mountains (too steep ), high")
POPULATION DISTRIBUTION • Disadvantages areas include deserts (too, dry), mountains (too steep ), high latitudes (too cold) and rainforests (too infertile). • There is no such thing as a best climate- many people live in south east Asia and this has a monsoonal climate, with hot , wet seasons and hot, dry seasons. • The most uniform distributions of population occur where there is little variation in the physical and human environments • Low densities are associated with high altitudes, polar regions, deserts and rainforests. • At the physical/ human interface the spatial incidence of disease and pests, particularly in developing countries, can limit human settlement. • The more advanced a country the more important the elements of human infrastructure become in influencing population distribution.

FACTORS INFLUENCING POPULATION DISTRIBUTION • Distribution relates to location based mainly on economic and physical factors. ECONOMIC FACTORS PHYSICAL FACTORS Relief Temperature Precipitation Vegetation

POPULATION CHANGE World Population Change For thousands of years population changed little, probably reaching 250 000 at the time of the Christian era. Change continued to remain low until about 200 years ago, linked initially to the industrial revolution in Europe. From this point the characteristics are : 1. World population reached 1000 million in the early 19 th century, 2000 mil in the 1920 s , 3000 mil in the 1960 s etc. An extra 1000 million added in 100, 40 and 10 years respectively. 2. World population doubled between 1820 and 1920. It doubled again in 50 years up to the 1970 s. The world’s population is increasing at an increasing rate.
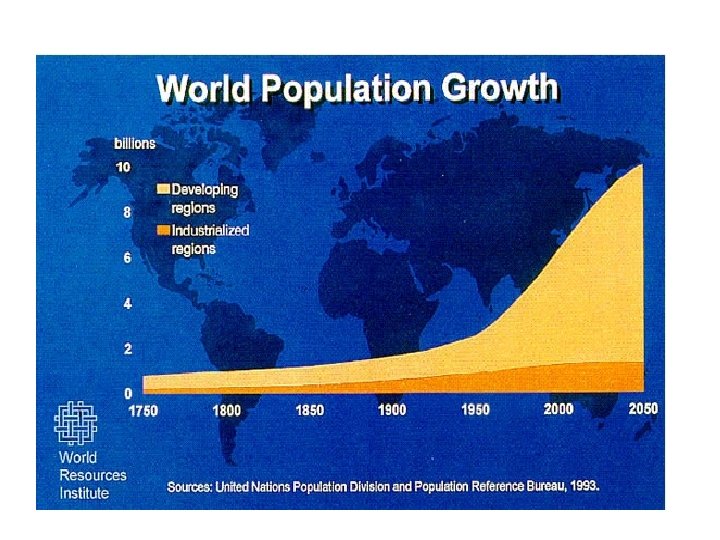
 • Population has not increase evenly over the world: some countries")
POPULATION CHANGE (con’t) • Population has not increase evenly over the world: some countries , especially in Africa and Latin America since 1950, have grown exponentially. • Asia has during all of this period maintained a very high half of the world’s population. • The growth rates of North African countries is in order of 3 % (enough to double the population in 25%) • This compares with many European countries who have experience drops in population in recent years. • It is estimated that 95 % of growth will occur in Africa, Asia and Latin America over the next 25 years. • Birth rates may continue to increase over the next 50 years.
 There are huge contrast between the developed and developing worlds is")
POPULATION CHANGE (con’t) There are huge contrast between the developed and developing worlds is readily apparent. • The developed has only about 20 % of world population and its population is growing at only one quarter of the global rate. • However, within developed itself there is a considerable difference in natural change between Europe on the one hand (-0. 1%) and North America and Oceania (0. 6% and 1. 1 % respectively) on the other. There also significant differences in the developing world, with Africa having by far the highest natural increase at 2. 5 %.
 exceeds the")
Causes of Change • If the number of births (birth rate =BR) exceeds the number of deaths (death rate= DR) in any one year then populations tend to increase. This is called Natural Increase. • In addition , if the number of immigrants that join a country exceeds emigration, population will rise. • Three main factors influence population change: Fertility+/- Mortality +/- Migration = +/- Growth

Reasons for Change Fertility is the measured capacity of a population to generate births. Two measures are used : 1. Crude Birth Rate – the number of births in a given year divided by the population and multiplied by 1000 (reliant on accurate data and does not account for age –sex structure 2. Total Fertility Rate – the number of children born to 1000 women passing through the child bearing ages ( assuming none of the women die); a fertility rate of 2. 1 births per women indicates the replacement level (stable population).

Factors influencing Birth Rates • • Availability of family planning information and services Education and Literacy Better Health and Fewer child deaths Later marriages Migration to towns and cities A better deal for women More employment opportunities More equal income distribution and rising living standards This has caused the BRs in the MEDCs to have fallen, whereas in the LEDCs high BRs have persisted but are falling in some.

Factors influencing Birth Rates Why LEDCs continue to have high birth rates? • The importance placed upon child bearing in some countries • Large families are seen as insurance for the future • Women are disempowered • More children= more workers

Factors influencing Fertility Rates • Demographic – particularly mortality rates influence social norms regarding fertility. One study of sub Saharan Africa, where average infant mortality is over 100 per 1000, calculated that a woman must have an average of ten children to be 95% certain of a surviving adult son. • Social/ Cultural - in some countries particularly in Africa, tradition demands high rates of reproduction. The opinion of women in reproductive years will have little influenced weighed against intense cultural expectations. Education, especially female literacy , is the key to lower fertility. With education comes a knowledge of birth control , greater social awareness, more employment and a wider choice of action generally.
 The more educated women are, the later they marry;")
Factors influencing Fertility Rates (con’t) The more educated women are, the later they marry; this widens the age gap between successive generations. • Most countries exhibit different fertility levels according to social class with fertility decline occurring in the highest social classes first. • In some countries religion is an important factor. For example Muslims and Roman Catholics religions oppose to artificial birth control. However, the degree of adherence to religious doctrine tends to lessen with economic development.

Factors influencing Fertility Rates • Economic – in many of the least developed countries children are seen as an economic assets. They are viewed as produces rather than consumers and as security when parents reach old age. In the developed world the general perception is reversed and the cost of the child dependency years is a major factor in the decision to begin or extend a family.

The value of children VALUE BENEFITS COSTS Economic • Help with domestic chores • Financial contribution to household • Security in old age • Cost of education • Cost of food , clothing and shelter • Loss of parental wage earnings Social • Companionship, love, • Mental strains happiness • Overcrowding of • Marital bonds family residence strengthened • Continuation of family name Psychological • Fulfillment • Living through children incentive to succeed • Parents feeling tired , down • Emotional strain • Disciplinary problems

Factors influencing Fertility Rates • Political – Governments use direct policies to change the rate of population growth for economic and strategic reasons. During the late 1930 s Germany, Italy and Japan all offered inducements and concessions to those with large families. In recent years Malaysia has adopted a similar policy. However , most governments that are interventionist wants to reduce population growth. Attempts include the level of family allowances, investment in sex education and family planning and care of the elderly.

Factors influencing Mortality Rates Mortality is different form fertility as it tends to be more stable and predictable. There a number of measures : 1. Crude death rate – the number of deaths in a specific period per 1000 of population (distorted by age structure ) 2. Age –specific mortality rates – the number of deaths of people of a certain age per 1000 e. g. infant mortality. 3. Life expectancy at birth – the average number of years a person can expect to live.

Factors influencing Mortality Rates Through the 20 th century, Africa has seen death rates halved , particularly amongst children. This has been brought about with improvements in sanitation and improved medical techniques, medicines and general provision. • Crude Death Rate is the most common measure of mortality. However, as it takes no account of population structure it is of little use ( a better measure is infant mortality, the number of deaths of infants under the age of one year old/1000 live births) • The Northern hemisphere generally has the lower Death Rates

Factors influencing Mortality Rates • Environmental Factors such as droughts and floods, hot, humid climates, pollution and sunny climates • Socio economic factors such as housing conditions, sanitation and access to clean water , social class – more important in developed economies • Sanitary Reforms- eliminate conditions favorable to the spread of diseases, water, food, vectors (carriers), air and personal contact all spread disease

Factors influencing Mortality Rates • Changing diseases - genetic changes in virulence of diseases can lead to less or more deaths • Advances in medical care - very important since World War II, penicillin very important • Improvements in Living Standards – improved nourishment, better hygiene and some argue food supply more important than medicine

Factors influencing Life Expectancy • Improved Sanitation • Improved Nutrition • Medical Innovations such as vaccines, penicillin and antibiotics, cardio vascular drugs

What is Doubling Time ? The amount of time for a given population to double, based on the annual growth. How long will it take for a population of a given area to double in size ? To determine doubling time, divide the growth rate as a percentage into 70. i. e. , a growth rate of 3. 5 represents a doubling time of 20 years. Examples: Afghanistan has a current growth rate of 4. 8%, representing a doubling time of approximately 14. 5 years (70/4. 8=14. 5).

Calculating Doubling Time • For Example Canada: • Birth rate: 10. 29 births/1, 000 population (2008 est. ) • Death rate: 7. 61 deaths/1, 000 population (2008 est. ) • Net migration rate: 5. 63 migrant(s)/1, 000 population (2009 est. ) • Population Growth 10. 29 -7. 61 = 2. 68 + 5. 63 = 8. 31 per 1000 people or 0. 83% Doubling time = 70/0. 83 = 87 years

Examples of Doubling time • • • World = 50 US =35 MDC =550 LDC = 40 Honduras =22 Denmark= 700
- Slides: 24