Population Distribution Density Census Population Structure Population ChangeGrowthStructures

Population Distribution & Density Census Population Structure Population Change/Growth/Structures Consequences Of Pop. Change Migration

Sparsely Populated Pop Distirbution/Density Densely Populated Factors Influencing Areas Physical Landscape ~ Climate ~ Vegetation ~ Infertile soils. . Grassland eg. . Soils ~ Water Supply ~ Disease & Pests ~ Areas with. . Few natural. . Resources ~ Communications ~Deep Economic ~ Political Areas difficult. . humus. . Sparse deserts. . Flat lowland. . Active volcanoes. . Reliable – either. . Unreliable or lack. . Evenly distributed. Drought, high. . Natural ports. . Areas devoid of. . Funding to create. . Malaria in central. . Large mineral. . Areas lacking in. . Intensive farming.

Malaysian Peninsula – Describe The Relationship Between Physical Features & Pop Distribution Ideas/Clues Relief Flat or Steep Cost Climate Temp. Rainfall Farming Daily Life Soil Slope Fertility Rocky/Marsh

N. Z. Describe & Explain Pop Distribution Mention Rainfall; Relief; Resources Describe Where most and least? Detail!!

N. Z. Describe & Explain Pop Distribution Mention Rainfall; Relief; Resources Explain Wet/Dry Areas Flat/Hilly Areas Soils? Natural Resources
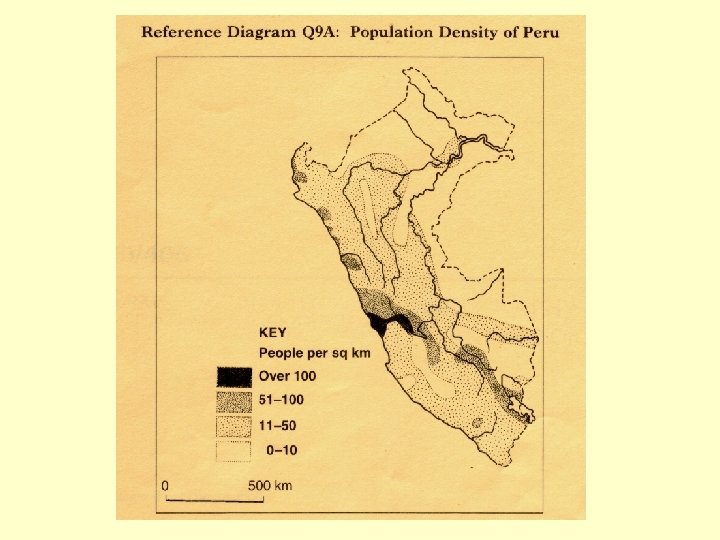

Population Distribution & Density
 Privacy Cost Remote Money Language Census Difficulties War")
Population Census – Difficulties (Q 1) Privacy Cost Remote Money Language Census Difficulties War Size Migration Nomads Corrupt
 High mountains in the West ____")
Population Census – Difficulties In Bolivia (Q 2) High mountains in the West ____ mean roads will be poor and so it is hard to get to roads in Bolivia in & count villages in these areas. There are few major ____ general so areas may be missed if they can’t reach these remoter villages. Thick rainforest in the Amazon rainforest has seen little development and so are again hard to reach as are the wandering tribes of this area who have no ______ permanent address. Other people wandering about are migrants looking work and may be counted in the wrong area. There is a low literacy for ______ fill in the census rate which means that many people will not be able to _____ accurately made worse by the fact that some people don’t understand the language ______ it is written in e. g. the Indians. The country has a low GNP and administer the census correctly leading to so won’t be able to afford to ______ analyse the inaccuracies and may not be able to employ enough staff to _____ shanty towns will also be missed as information they gather. People living in ______ there is no record of where they live.

Table Showing Uses Of Census Data Census Use True False 1 Knowing the number of elderly means you can plan to provide more or less maternity wards 2 Census data will tell you how many people there are in the country and where they live 3 Areas of high unemployment will show up so Govt. can try and create jobs there 4 Areas of good quality housing can be spotted and so more money can be spent here to improve houses 5 Knowing the number of working people and how much they earn, allows you to work out how much tax to collect 6 Areas with few youngsters can be targeted so that more schools are built in these areas. 7 Areas with few ethnic people living there can be seen and so they are given more money to help with translations 8 Increases in population in areas will allow Govt. to provide more infra-structure like roads, water, electricity & gas
 These allow countries to predict population trends e.")
Population Census – Why? (Q 3) These allow countries to predict population trends e. g. distribution of people in the country. If the country is ageing they can provide more social and health care e. g. meals on wheels and care homes. If there are many youngsters being born than they provide services such as schools and maternity wards, this includes training staff as well as new buildings. They can also plan to build more housing if the population is rising or if they know that houses people live in are getting older. They can also plan for areas, so if an area has many unemployed they can provide more money to the local council for retraining schemes. They will also be able to work out how much money is needed for benefits too. Services have to be paid for so they can estimate how many people will be paying tax in the futures and so adjust tax rates and pensions accordingly.

Population Change Definitions Birth Rate the number of births there are in 1 year for every 1000 women aged 15 -45 Death Rate Number of years you expect to live when born Natural Increase A rapid explosion in population Life Expectancy there are Number of babies born for every 1000 people Infant Mortality Number of deaths for every 1000 people there are General Fertility rate The number of babies who die before they are 1 Population Explosion The difference between the birth and death rates

World Population Change 6 x 5 4 Billions Of People x 3 2 x 1 x x x 0 1600 1650 1700 1750 1800 1850 1900 1950 2000 Year

High 40 Deaths And Births Per 1, 000 People Low 7 Stage 1 Stage 2 Stage 3 Stage 4 Stage 5 Now describe the birth rates and death rates using the words on your sheet. Stage 1 - High Birth Rate & High Death Rate Stage 2 - High Birth Rate Rapidly Falling Death Rate Stage 3 - Rapidly Falling Birth Rate Slowly Falling Death Rate Stage 4 - Low Birth Rate Low Death Rate Stage 5 - Slightly Falling Birth Rate & Low Death Rate
")
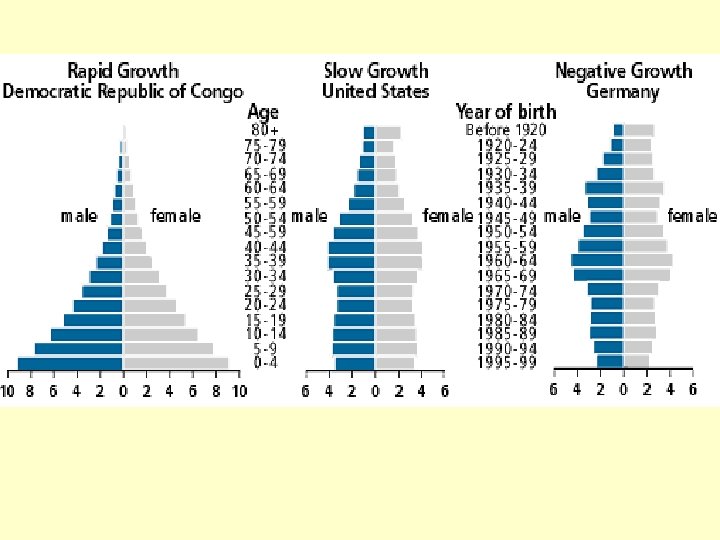
Population Pyramids (A)

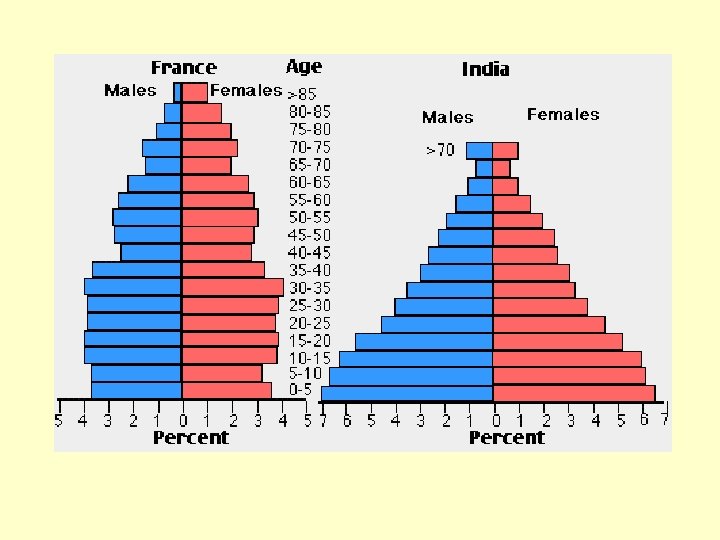
Population Pyramids B

Dependency Ratio Copy out and answer the following questions using the population pyramid you completed earlier. 4 1) ____% of the population are aged 0 to 4 years. 2) The total number of young dependents (0 – 14 year olds) accounts for ____% of the pop. 15 3) Extension – copy out with correct answer only. 4) There are 0. 1/0. 5/0. 9% of the pop. Aged over 90. 5) The total population over 65 years of age is 5%/15%30%.

Patterns Of Population Change Many young dependents Many old dependents
- Slides: 21