Population Density Worksheet B The worksheet is in

Population Density – Worksheet B The worksheet is in 3 sizes.

Printing To print handouts from slides Select the slide from the left. Then click: File > Print > ‘Print Current Slide’ To print multiple slides Click on a section title to highlight all those slides, or press ‘Ctrl’ at the same time as selecting slides to highlight more than one. Then click: File > Print > ‘Print Selection’ To print double-sided handouts Highlight both slides before using ‘Print Selection’. Choose ‘Print on Both Sides’ and ‘Flip on Short Edge’.
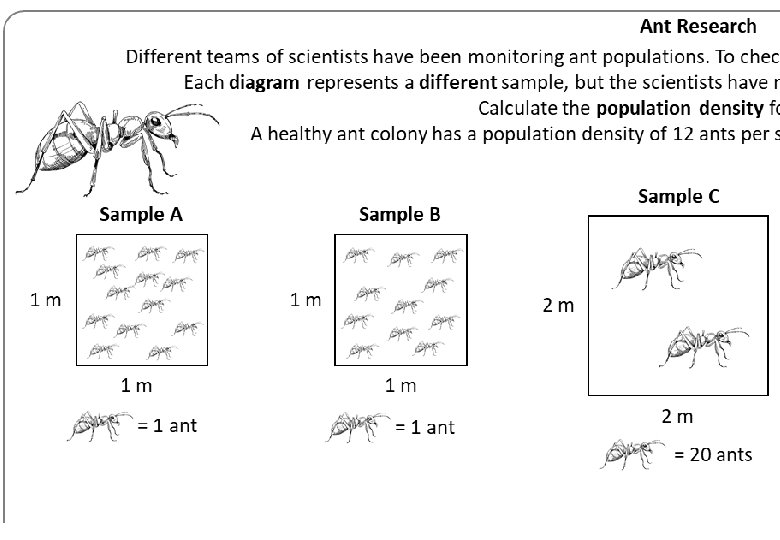

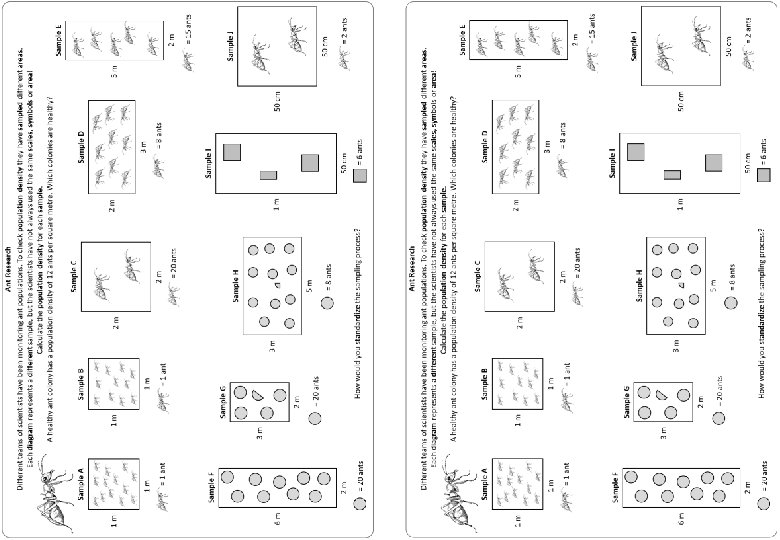
Ant Research Different teams of scientists have been monitoring ant populations. To check population density they have sampled different areas. Each diagram represents a different sample, but the scientists have not always used the same scales, symbols or area! Calculate the population density for each sample. A healthy ant colony has a population density of 12 ants per square metre. Which colonies are healthy? Sample E Sample A 1 m 2 m 2 m 1 m Sample D 3 m 1 m = 1 ant 5 m 2 1 m Sample C Sample B 2 m = 1 ant = 8 ants 2 m = 20 ants = 15 ants Sample I Sample F Sample G Sample J Sample H 3 m 3 m 6 m 1 m 50 cm 2 m = 20 ants 5 m 50 cm = 8 ants 2 m = 20 ants 50 cm How would you standardize the sampling process? = 6 ants = 2 ants

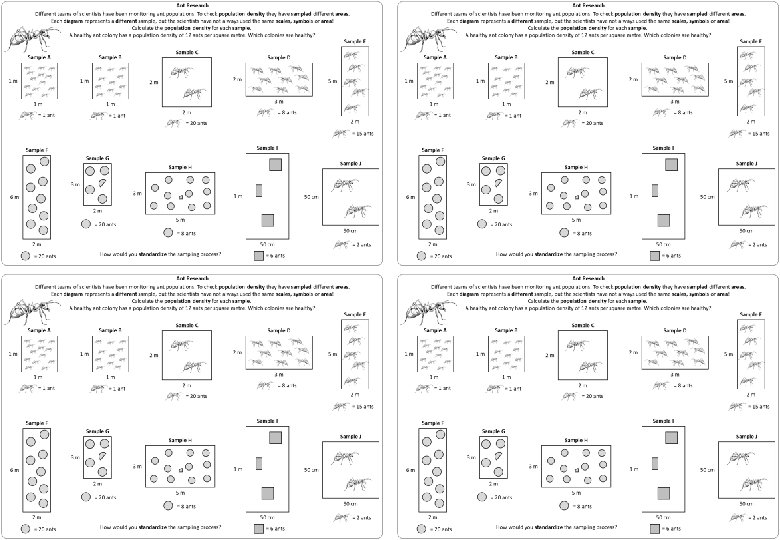
= Ant Research Different teams of scientists have been monitoring ant populations. To check population density they have sampled different areas. Each diagram represents a different sample, but the scientists have not always used the same scales, symbols or area! 75 ÷ 10 Calculate the population 2 40 ÷ 4 density for each sample. = 7. 5 per m A healthy ant of 12 ants 2 per square metre. Which 13 ÷ 1 11 colony ÷ 1 has a population density 72 colonies ÷ 6 are healthy? = 10 per m Sample E 13 per m 2 = 11 per m 2 = 12 per m 2 Sample C Sample A Sample B Sample D 1 m 2 m 2 m 1 m 3 m 1 m = 1 ant 5 m 2 1 m 2 m = 1 ant = 8 ants 2 m = 20 ants = 15 ants Sample I Sample F Sample G Sample J Sample H 3 m 3 m 6 m 1 m 50 cm 2 m = 20 ants 5 m 50 cm = 8 ants 2 m = 20 ants 50 cm How would you standardize the sampling process? = 6 ants = 2 ants

= Ant Research Different teams of scientists have been monitoring ant populations. To check population density they have sampled different areas. Each diagram represents a different sample, but the scientists have not always used the same scales, symbols or area! 75 ÷ 10 Calculate the population 2 40 ÷ 4 density for each sample. = 7. 5 per m A healthy ant of 12 ants 2 per square metre. Which 13 ÷ 1 11 colony ÷ 1 has a population density 72 colonies ÷ 6 are healthy? = 10 per m Sample E 13 per m 2 = 11 per m 2 = 12 per m 2 Sample C Sample A Sample B Sample D 1 m 1 m Sample F 5 m 3 m 1 m = 1 ant 180 ÷ 12 = 15 per m 2 2 m 2 m 2 1 m 2 m = 1 ant = 8 ants = 20 ants 90 ÷ 6 = 15 per m 2 90 ÷ 15 = 6 per m 2 Sample G 2 m 15 ÷ 0. 5 = 30 per m 2 = 15 ants 4 ÷ 0. 25 = 16 per m 2 Sample I Sample J Sample H 3 m 3 m 6 m 1 m 50 cm 2 m = 20 ants 5 m 50 cm = 8 ants 2 m = 20 ants 50 cm How would you standardize the sampling process? = 6 ants = 2 ants

Ant Research Different teams of scientists have been monitoring ant populations. To check population density they have sampled different areas. Each diagram represents a different sample, but the scientists have not always used the same scales, symbols or area! Calculate the population density for each sample. A healthy ant colony has a population density of 12 ants per square metre. Which colonies are healthy? Sample E Sample A 1 m 2 m 2 m 1 m Sample D 3 m 1 m = 1 ant 5 m 2 1 m Sample C Sample B 2 m = 1 ant = 8 ants 2 m = 20 ants = 15 ants Sample I Sample F Sample G Sample J Sample H 3 m 3 m 6 m 1 m 50 cm 2 m = 20 ants 5 m 50 cm = 8 ants 2 m = 20 ants 50 cm How would you standardize the sampling process? = 6 ants = 2 ants

Questions? Comments? Suggestions? …or have you found a mistake!? Any feedback would be appreciated . Please feel free to email: tom@goteachmaths. co. uk
- Slides: 10